The Lead and Copper Rule is a National Primary Drinking Water Regulation under the Safe Drinking Water Act. Its purpose is to reduce lead and copper at the tap in drinking water provided by regulated public water systems. On December 22, 2020, the Environmental Protection Agency (EPA) finalized the first major update to the Lead and Copper Rule since it was initially enacted in 1991.
Updates to the rule include the following:
- Using science-based testing protocols to find more sources of lead in drinking water
- Establishing a trigger level to jump-start mitigation earlier and in more communities
- Driving more and complete lead service line replacements
- For the first time, requiring testing in schools and childcare facilities
- Requiring water systems to identify and make public the locations of lead service lines
According to the Journal AWWA article “National Survey of Lead Service Line Occurrence,” there are 6.1 million full or partial lead service lines present in US community water systems. The cost of replacing a lead service line is estimated to range from US$2,500 to US$8,000 per line. Identifying and replacing lead service lines is a lot of work as well as a significant expense. Working to collect the location of lead service lines, visualizing and analyzing the data, and creating easy-to-use resources for the public will be challenging for many utilities.
Not all utilities can quickly or easily identify where lead service lines are located. This information is often lost within historical paper records that are difficult to access and time-consuming to review. Identifying lead service lines is done primarily with physical inspections of the pipe. If digital data is available, analytics can be used to prioritize inspections, sending inspection staff to areas that are likely to have lead pipes. Whatever method is used, identifying the lead service lines and visualizing them on a map will improve workflow efficiency. It will also enable easy sharing of the information with stakeholders and the public.
Collecting lead service line information, showing it on a map, and sharing it with the public are tasks that Esri’s ArcGIS system can help with. Water utilities across the United States are using ArcGIS to help them prepare to meet the new requirements within the Lead and Copper Rule, each in their own way.

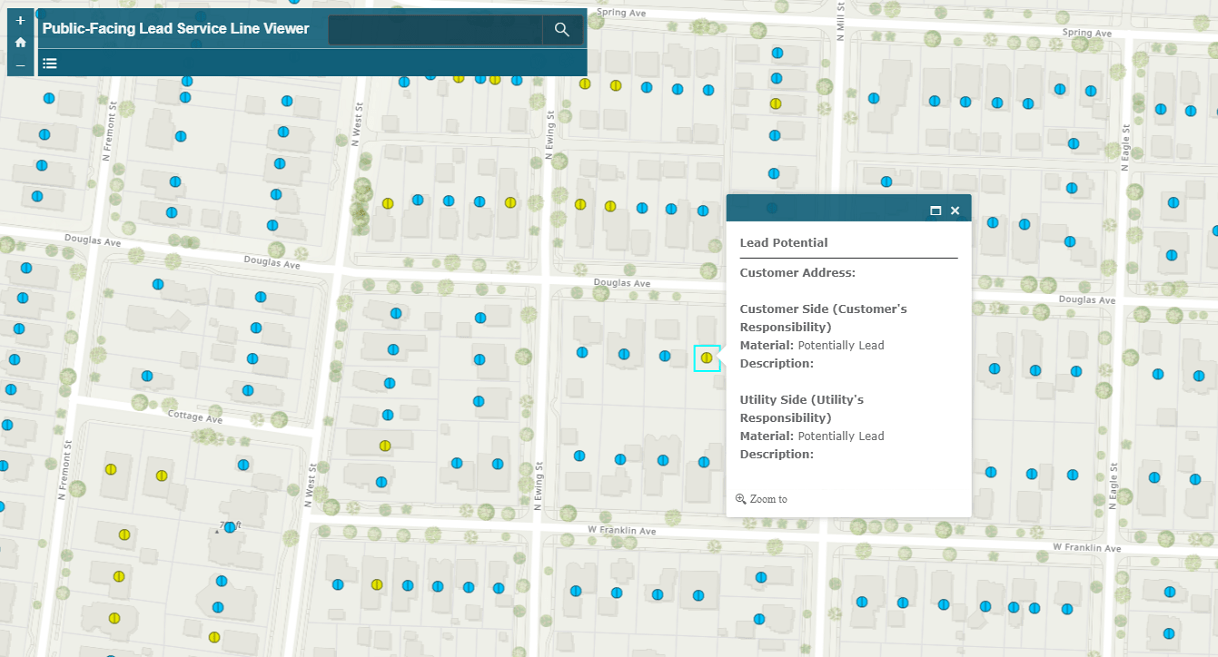
In 2020, Denver Water launched its unprecedented Lead Reduction Program. The program was approved by the Environmental Protection Agency and the Colorado Department of Public Health and Environment. It contains several regulatory requirements, including the identification, inventory, and removal of lead service lines. Information on service lines was incomplete because the utility does not own any part of these lines. The work of identifying the location of these lines and the materials they are made of required extensive research and analysis. Using ArcGIS Pro, utility staff were able to identify the maximum number of lead service lines and create a plan to remove all of them over 15 years. The utility then developed a strategy to share information with the public. Using ArcGIS Online, ArcGIS Web AppBuilder, and ArcGIS StoryMaps, staff provide customers with up-to-date information about the Lead Reduction Program.

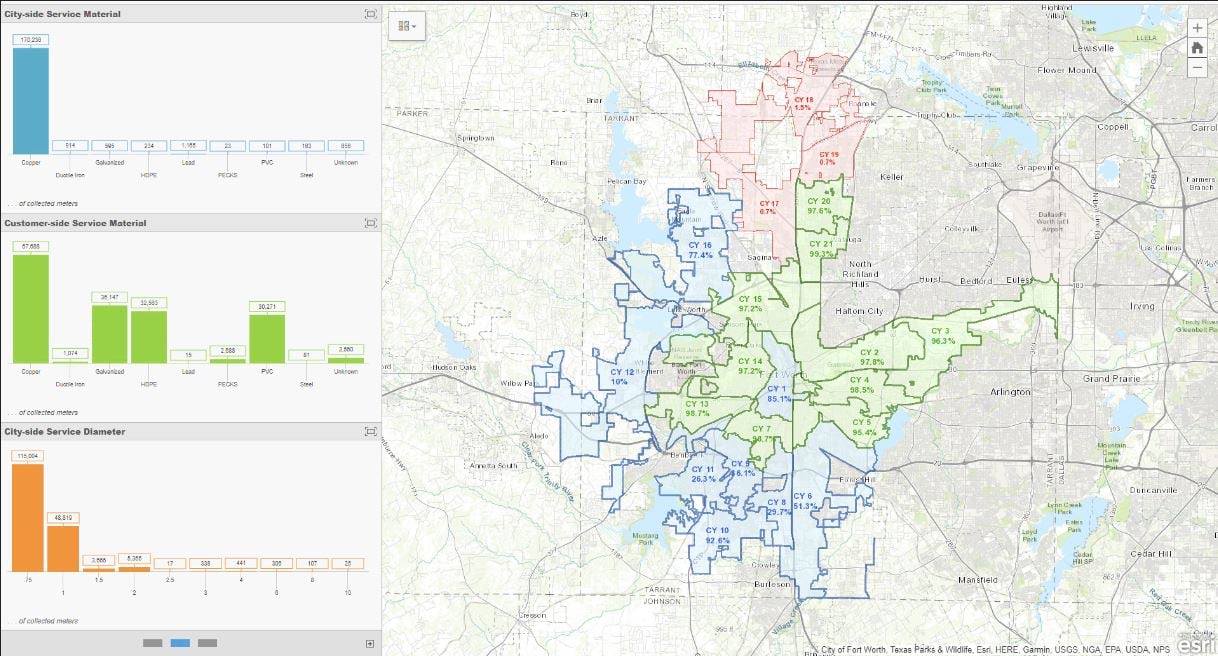
In 2014, Fort Worth’s water utility—like many of its counterparts nationwide—admittedly didn’t have complete records about how much lead pipe was still in use in the city. Now, they are working to replace all lead service lines by the end of this year. Using field applications and ArcGIS Dashboards, utility staff are confident that they will reach their goal. “The dashboard shows you the progress and displays the areas where data was collected,” Homer Garza, Fort Worth’s water utility IT manager said. “It also displays progress based on the previous 60 days’ collection, and based on that rate, it projects an ending date. That right there has given supervisors a method to see what they’re up against in their progress.”
In an effort to help utilities meet the new Lead and Copper Rule requirements, Esri has developed the Lead Service Line Inventory solution that includes preconfigured maps, apps, and dashboards. This solution delivers a set of capabilities that help utilities to:
- Inventory lead service lines
- Validate service line materials in the field
- Monitor replacement activities and regulatory compliance
- Share information with the public

Reach out to Esri’s Water Team for help getting started using Esri solutions to meet the updated Lead and Copper Rule requirements.


Article Discussion: