Since the seventies, human geographers and health researchers have been using “activity spaces” to better understand life patterns, environmental exposures, and human experiences. This approach has become ever more popular in the social sciences with the rise of accessible GPS technology. The activity space is commonly understood as the geographic area that is frequented by a person, family, or other group of people as a consequence of their regular activities (R.G. Golledge, 1997).
Where do people live? Where do they work? Socialize? Gather resources? Attend school? Worship? Organizations like The National Library of Medicine use activity spaces to better understand community health. Urban planners use them to help designate services like sidewalks and bus routes.
The ability to plot lifestyles in space and over time has opened many doors for a qualitative GIS approach focused on lived experiences. This blog post will highlight some GIS projects and workflows centered around activity spaces and life spaces.
Activity Spaces vs. Life Spaces
Continued efforts in human geography research have resulted in the rise of a connected concept—“life space”—which reflects “the ability of a person to move and engage with activities beyond the home” (Szanton et al. 2023). Activity spaces are the objective and factual places that people frequent, whereas life spaces include places they wish they could go to, infrequently visited places of importance in their lives, and more. These concepts can be utilized in tandem to develop further understandings as to how and why people interact with their locality, and to understand how places provide meaning to individuals. For example, arts and cultural institutions may be present in life spaces, but not activity spaces, highlighting both an interest and a potential barrier to engagement.
Peoples’ everyday lives can be invaluable in planning infrastructure, community engagement, campaigns, and more, as well as serving as a medium for social science research. Emerging work has identified relationships between life spaces and demographics — like race, age, and gender. Examining life spaces provides insights into spatiotemporal patterns in safety, mobility, and walkability.
Both are Applicable to a Wide Range of Topics
Inspiration for the GIS use-cases discussed here are derived from two very different projects:
- A study of health aging, conducted by Dr. Hannah Grove, exploring how older people define and enact aging well in place in the Greater Dublin Area in Ireland. Participants were asked about places they visit, and how often, as well as places they wished to frequent more. An important component of aging well in place is being able to leave the home and engage in meaningful activities and interactions. However, for older people with mobility challenges, accessibility and availability of services makes a big difference.
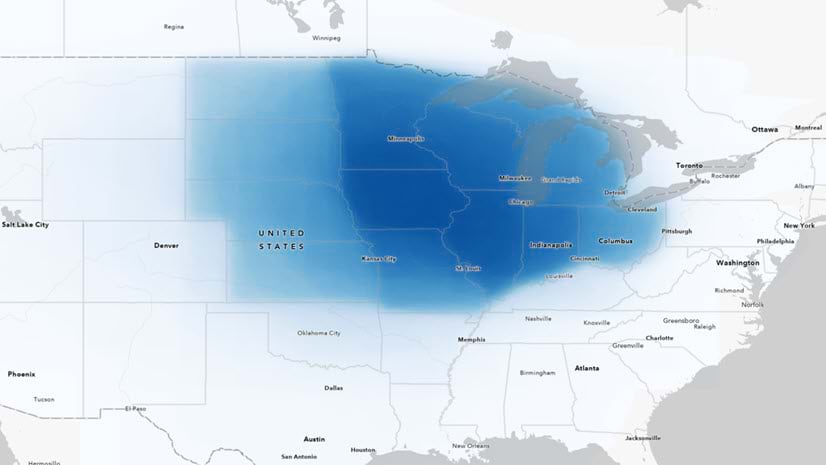
- A study of electric vehicle drivers, conducted by Esri’s Living Atlas Policy Maps team. Participants were asked about where they charge their cars, and how they plan their trips. Do you consider existing street network, with all its distances and traffic patterns, vs. the electrified street network to ensure access to chargers?
While walkability varied for participants in both studies, a sharp dichotomy between the EV and health aging studies is the participants’ predominant mode of transport. In Dr. Grove’s analysis in Ireland, many participants in the inner-city were walking to their area of interest. In the EV study based mainly in Southern California, participants are practically forced by their environment to be car dependent.
Additional topics around the built environment
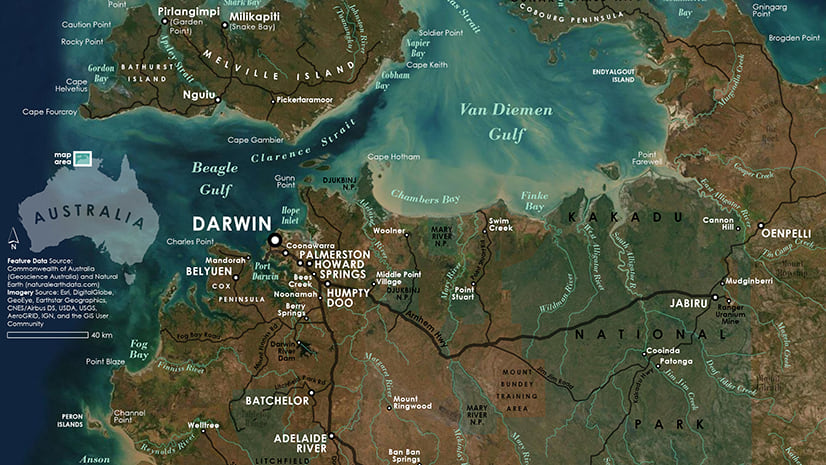
An additional evergreen topic is the labor involved in gathering resources in developing countries. In Sub-Saharan Africa, activity spaces have been found to differ dramatically by gender. Resource gathering plays an outsized role in the lives of many women in areas of low development, with many walking many kilometers daily to access basic resources like drinking water and firewood. Community mapping efforts in Mozambique revealed actual paths taken by women to gather water, which greatly differed in length from remotely calculated Euclidean distances. This participatory gathering of information has thus proven essential in understanding the true labor costs of homemaking in the region. See The challenge of global water access monitoring: evaluating straight-line distance versus self-reported travel time among rural households in Mozambique | Journal of Water and Health | IWA Publishing (iwaponline.com)
In all three topics (aging in Ireland, driving in Southern California, gathering water in Mozambique), the built environment plays a huge role. A further inquiry on micomobility and walkability could prove fruitful on better understanding activity spaces and access to amenities outside the home.
Whatever the topic, both activity spaces and life spaces can be collected, visualized, and analyzed using ArcGIS.
Collect Locations
There are many ArcGIS tools available for capturing the individual locations of an activity space. The key is to find the right tool for your specific project. ArcGIS Survey123 and ArcGIS Field Maps are great for capturing data while on the move, whereas adding Map Notes in ArcGIS Online or ArcGIS Pro are better suited for interview settings in front of a computer.
The Survey123 Field App allows researchers and study participants alike to collect data about their current field location. The form-centric solution notes the location where the data is being collected, along with the necessary attributes, notes, and photos. Therefore, Survey123 is a strong solution for those looking to study activity spaces while on the move, and to allow the participants themselves to add points and information. Go-along interviews and in-depth interviews are common practices to collect qualitative data about a participant’s use of activity spaces and can generate rich spatial data.
Both the health aging study and the EV drivers study used traditional interview methods that collected both qualitative and spatial data, which was processed later on.
The Health Aging study geocoded addresses from a spreadsheet
For her fieldwork, Dr. Grove collected both qualitative and spatial data. She conducted interviews with participants which included a mapping activity, where participants identified the places, routes, routines and interactions of most importance to them. Participants then took part in an optional go-along interview or interview on the mobile, where they showed some of their daily routines.
Afterward, Dr. Grove examined each place that was identified and how it was described. Because this study took place in the same city for all participants, places such as specific shopping centers, pharmacies, and hospitals came up for multiple participants. Data was stored in a spreadsheet which included attribute data such as how many participants mentioned a particular place, and how many times. Ultimately, she brought in an Excel file with 221 places to ArcGIS and geocoded the addresses to get points on a map.
The EV Drivers study used Map Notes in ArcGIS Online
Similarly, the interviews with EV drivers took place over video calls, and participants discussed a typical week. The interviewer was the one to add the points on the map using Map Notes, while sharing their screen with the participants. Map Notes in both ArcGIS Online and ArcGIS Pro allow for graphical notations on a map or scene.
Then, the interviewer generated a feature layer using the Merge Layers tool. This merged all the points that came up during the interview. Now the team had a feature layer for each respondent. The Living Atlas Policy Maps team went back though the interviews to do thematic coding for themes such as convenience, safety, and car as status. Through this process, the team added attributes and quotes to the points after the fact, while going through the transcripts. Map Notes is a great choice for allowing the interviewer/researcher to add data values in the office rather than in the field.
Additional Tools
While neither study used the new Sketch mapping capabilities in ArcGIS Online, this is yet another tool that allows participants to annotate a map about their experiences.
In addition to collecting spatial data using ArcGIS tools, both the health aging study and the EV driver study collected qualitative data as well. The researchers used established qualitative data techniques with additional tools to do thematic coding and look at categories and characteristics of the places mentioned.
Visualize Activity Spaces
Often, making maps to communicate details about an activity space involves displaying quotes along side the points on the map. Dr. Grove created static maps as layouts with annotation for her final dissertation, whereas the policy maps team created interactive web maps for their final story.
Static Maps as Layouts
Here is a map series of three participants’ life spaces. The three participants here were Edith, Eamon, and Moira. Each life space in the series has the same symbology.
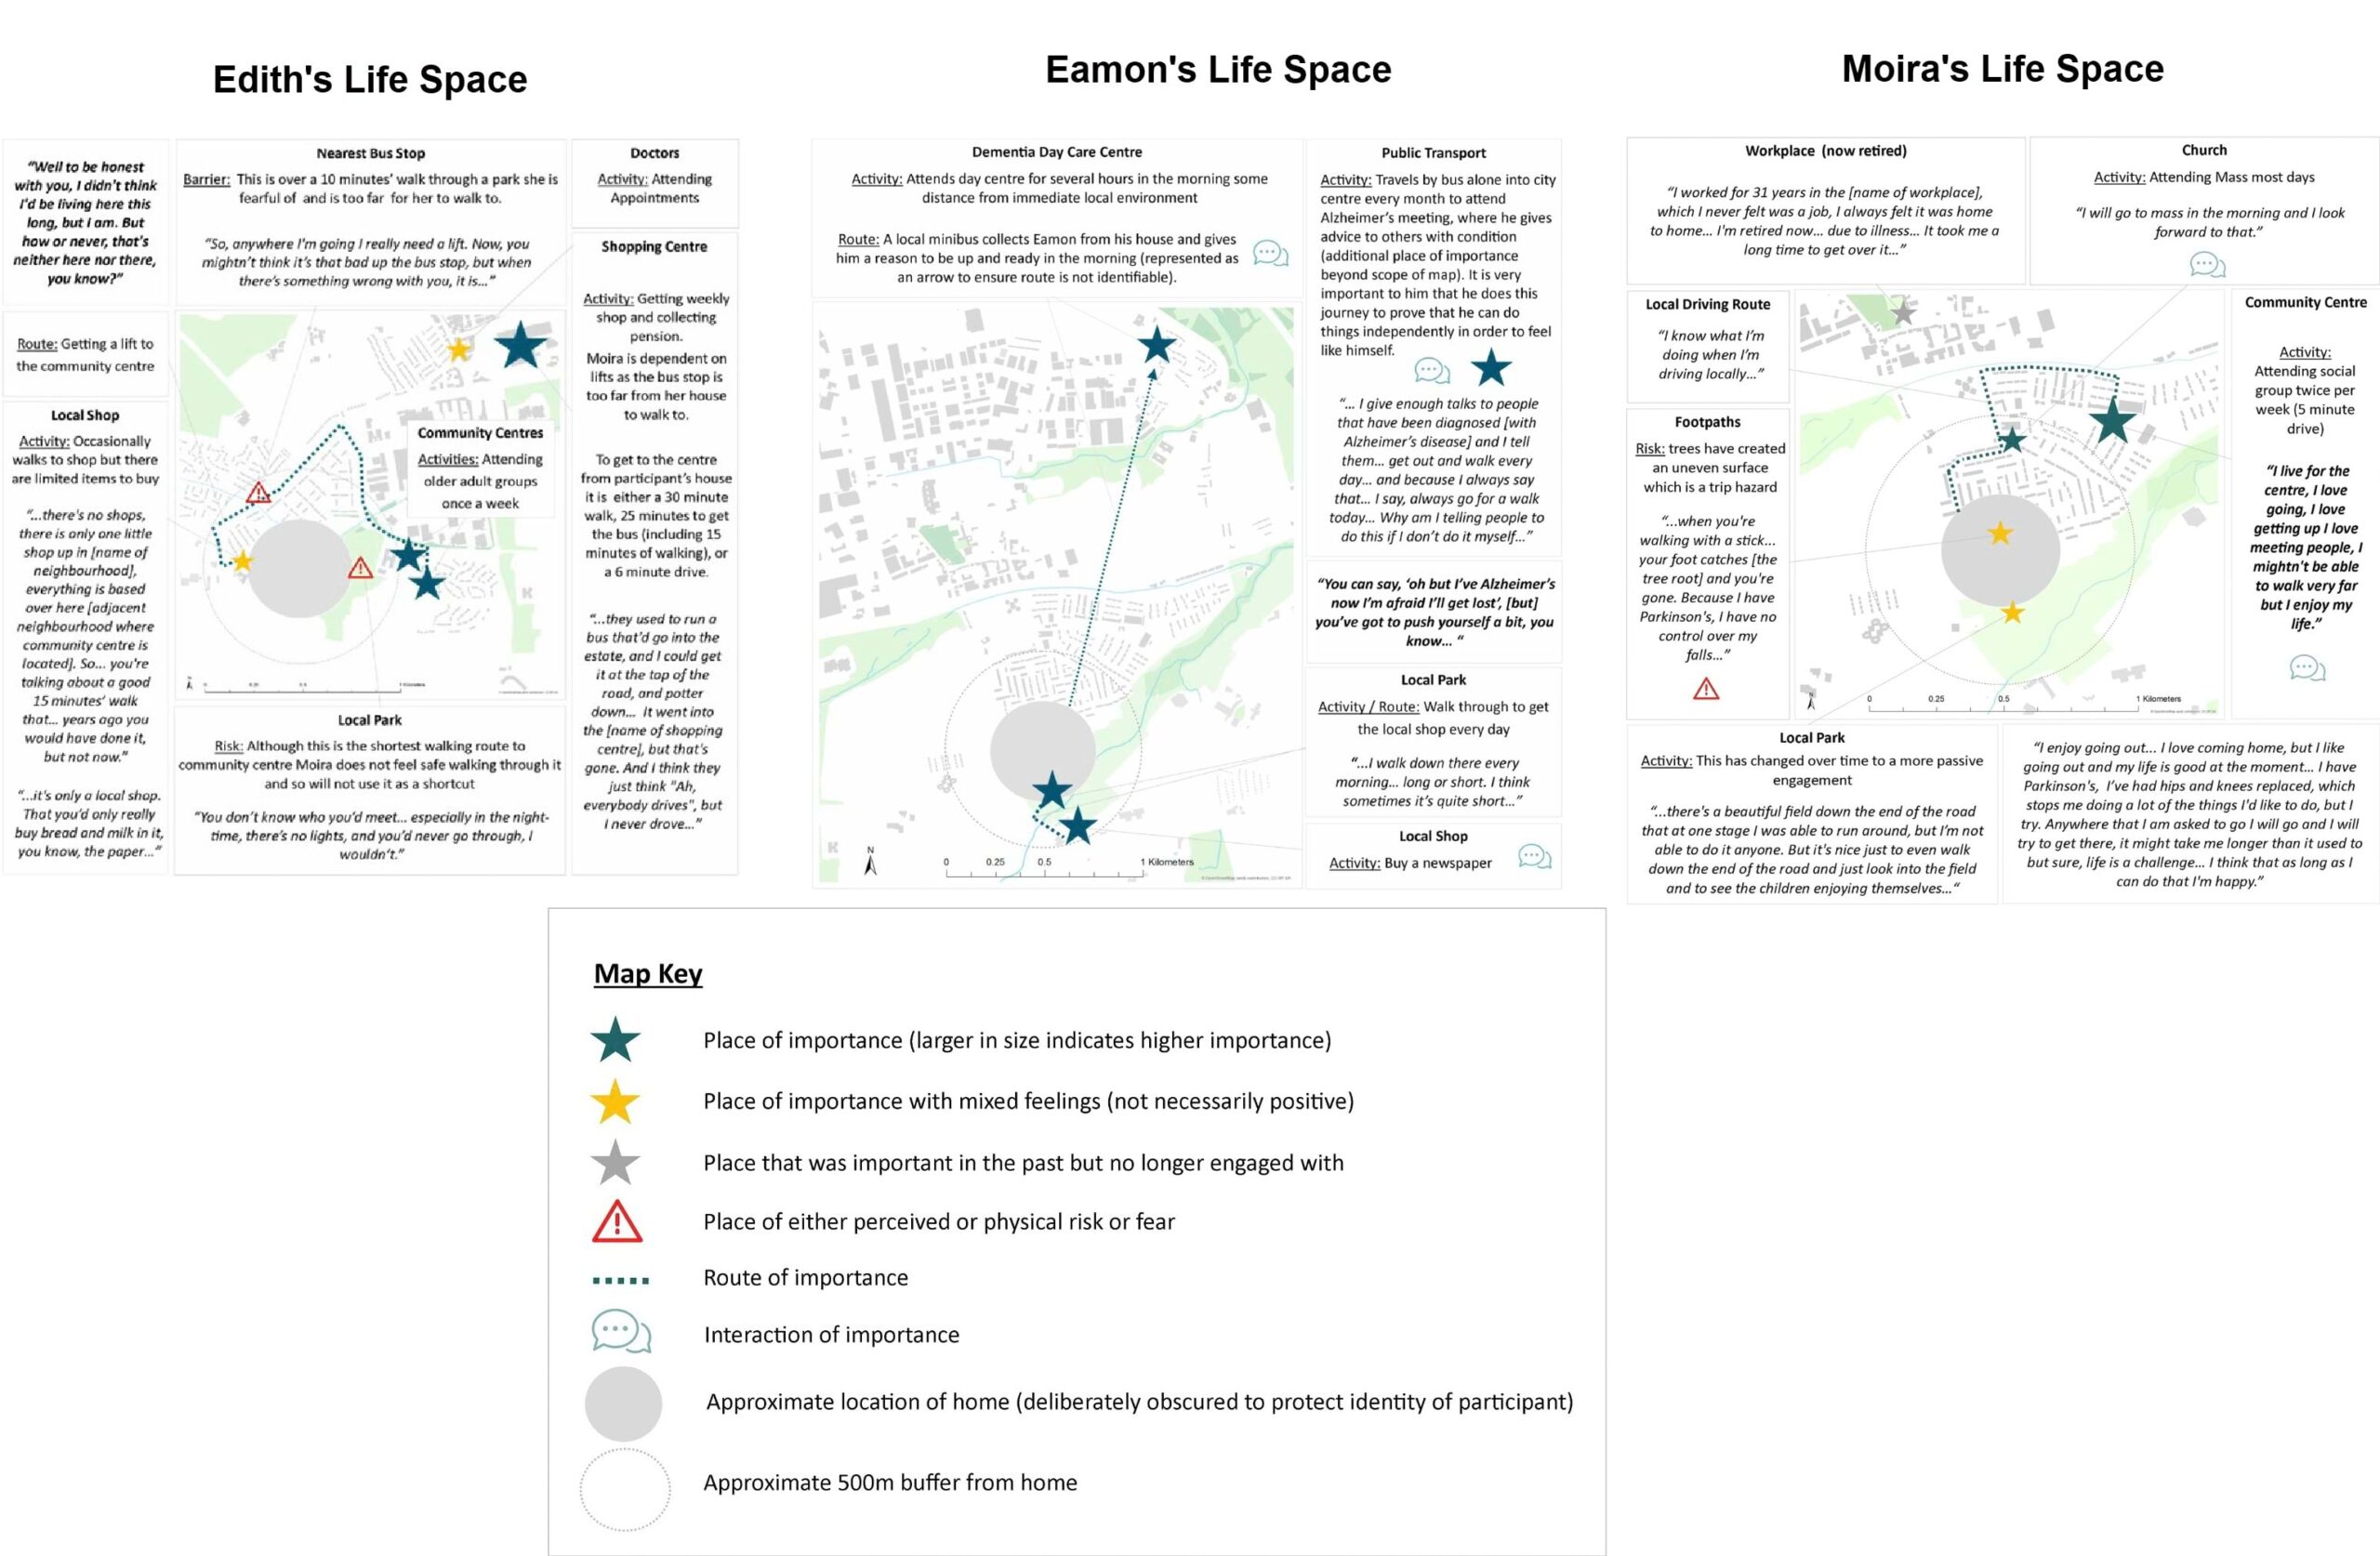
Learn more about creating text-heavy map layouts in ArcGIS Pro through this tutorial. In addition to the layout options in ArcGIS Pro, you can use any graphics software, including ArcGIS Maps for Adobe Creative Cloud. In fact, Dr. Grove created these annotation-rich maps in Microsoft PowerPoint.
Interactive Web Maps
Static maps tend to be more information-dense since the map’s audience can’t click and zoom around to get more info. Static maps need to present all the information needed in one view.
Interactive web maps allow for showing more and more detail as someone zooms in. In the EV maps, quotes and transcript snippets were configured as labels. Labels can be set to turn on only when zoomed in to a defined scale.

Do you want the quotes to appear only when someone clicks on a point? If so, a pop-up rather than a label could be another way to present the information. This blog post has more examples and ideas for mapping quotes, stories, sentiments, and experiences.
How will you be communicating and showcasing your maps? This can inform whether a static layout or an interactive web map (or both!) is the best approach for your project.
Privacy and Ethical Considerations When Creating Visualizations
When researching and analyzing activity spaces, we are exploring people’s lives in such a way that reveals intimate details relating to where they shop, exercise, worship, receive medical care, and more. These locations are imperative to analyzing and understanding activity spaces; however, they reveal personal data that leads to privacy concerns and even can threaten personal safety.
Dr. Grove addresses the ethical considerations of qualitative inquiry throughout her map by omitting certain details, including street names, last names, and general regional information. Consider the level of detail you will be including in your project. How identifiable is this information? While one location on its own might not pose a concern, how identifiable is the entire set of locations/details when presented together? Since this study focused more on individual experiences, it meant that fewer details about the study areas could be presented.
Ways to “Anonymize” Maps and Visualizations
You can configure simple settings to increase a study participant’s privacy. For example, within the basemap settings, users can increase map transparency and turn off reference layers (street names, transportation routes, building names, etc.). The OpenStreetMap Light Gray Canvas basemap works well with the reference layer turned off.
Tilting or rotating the map can provide an element of confidentiality by shifting the landscape while maintaining the data integrity. To rotate the map in ArcGIS Online, move two fingers in a clockwise or counterclockwise direction on the map. In ArcGIS Pro, click the Map Properties dialog box and select the General tap. For Rotation, select or type the desired rotation angle and click okay.
Controlled Access to Participants’ Activity Spaces for Researchers Only
While the research team needs full access to participant data, the audience of the final study often does not. ArcGIS Groups are one way to configure who has access to which items in ArcGIS Online. Groups provide a way for users to maintain privacy and easily organize their data and map information. With Groups, users can assign access privileges to manage organization members. Group owners can decide who can find, join, and contribute to the group.
Quantify Relationships with Analysis
Use the analysis tools in ArcGIS Online, or the geoprocessing tools in ArcGIS Pro to quantify the geographic relationships in your participants’ activity spaces. One analysis that can quickly communicate the size of participants’ activity spaces is creating Convex Hulls, or Minimum Bounding Geometry. A set of points that is run through this geoprocessing tool gives you a polygon of the minimum bounding geometry enclosing each point in one’s activity space.

This allows you to
- compare the size of activity spaces across different participants
- compare the size of an individual’s activity space to their life space
- compare the size of individuals’ activity spaces over time
Mixing qualitative and quantitative methods provides even more ability to test hypotheses and triangulate research findings. For example, In Dr. Grove’s study on aging well in place, she learned from her interviews that many individuals’ activity spaces had decreased over time as they aged. Through her interviews, she even discovered reasons for this: locations that appear to be accessible and close on a map were not frequented as much due to perceived and physical barriers, such as lower energy, reduced mobility, and risk considerations. She discusses how documenting activity spaces often reveal only a “moment in time” rather than a lifetime of movement.
Another set of tools that allow you to add the street network into the equation is the Network Analyst extension for ArcGIS Pro. While typically used by businesses to optimize route planning, researchers and analysts also use Network Analyst in their work. For example, our very own Maggie Carmody showed that a one-hour drive from Capitol Hill has been shrinking over the years due to increased traffic in Washington, DC.

Call to Action
Overall, there is huge potential in qualitative GIS. By combining and integrating qualitative and spatial data, we can better understand the everyday mobilities of individuals from a range of contexts and understand more about about their decision-making processes in terms of how and why people move.
Activity spaces are an established construct in many disciplines, and they can can be collected, visualized, and analyzed in ArcGIS.
Do you use activity spaces in your projects? What methods work best for you when collecting the data? How do you like to visualize the points? Have you used any analysis tools to quantify the relationships? Let us know in Esri’s Health and Human Services community. Or send in your work about your innovative use of ArcGIS to be considered for a presentation at an upcoming conference.
Thank you very much to ArcGIS User Dr. Hannah Grove! She is a Research Fellow at the Global Centre on Healthcare and Urbanisation at Oxford University. The study described here was conducted while she completed her Ph.D. in the Department of Geography at Maynooth University. Hannah is passionate about combining qualitative and spatial approaches to better understand lived experiences of place and the impact on health and wellbeing. She regularly uses ArcGIS tools in her research and teaching.
Note: The Collect Locations section of this blog was updated on August 22nd, 2024.


Article Discussion: