ArcGIS Velocity allows organizations to ingest, visualize, analyze, and act on data from sensors and asset tracks. It also enables processing of high-volume historical data to gain insights into patterns, trends, and anomalies. Remote monitoring of assets, predictive maintenance, and process optimization are a few of the benefits you can gain from your sensor and IoT (Internet of Things) data using Velocity.
ArcGIS Velocity is updated regularly, below are several highlights of the March 2022 release:
- Licensing and performance: Run more feeds and analytics with the Standard and Advanced subscriptions.
- Feeds, data sources, and outputs – The gRPC feed type is now out of beta and is fully supported in your production workflows.
- Analytics – Dynamic geofencing and dynamic joins in real-time analytics are now out of beta and are fully supported in your production workflows.
- Visualization – New user experience for setting default symbology for output stream layers including simple, class breaks, and unique value rendering options.
Now, let’s take a deeper dive into each of these exciting new capabilities and enhancements!
Licensing and performance
In this release, you’re now able to run more feeds and analytics across all subscriptions. With the Standard subscription, you can now run up to 10 feeds and analytics (previously the limit was 5). With the Advanced subscription, you can now run up to 15 feeds and analytics (previously the limit was 10). In the Dedicated subscription, you will also be able to run higher numbers of feeds and analytics than previously as well. For details on these updates, see Licensing.
In addition, several enhancements were made in the Velocity app to keep you better informed of subscription management needs. For instance, notifications for feed data rates were improved to clarify the specific feeds exceeding max data rates. Another area notifications have been improved is when monitoring compute usage on Dedicated subscriptions. This now includes the ability for an administrator to set the cadence they prefer for compute notifications (daily, weekly, or monthly).
Lastly, autoscaling has been enhanced especially for lower velocity feeds and real-time analytics. For example, enhancements have been added to avoid over-scaling when the data being ingested is in larger, infrequent batches, such as when polling a third-party API like Waze.
Feeds, data sources, and outputs
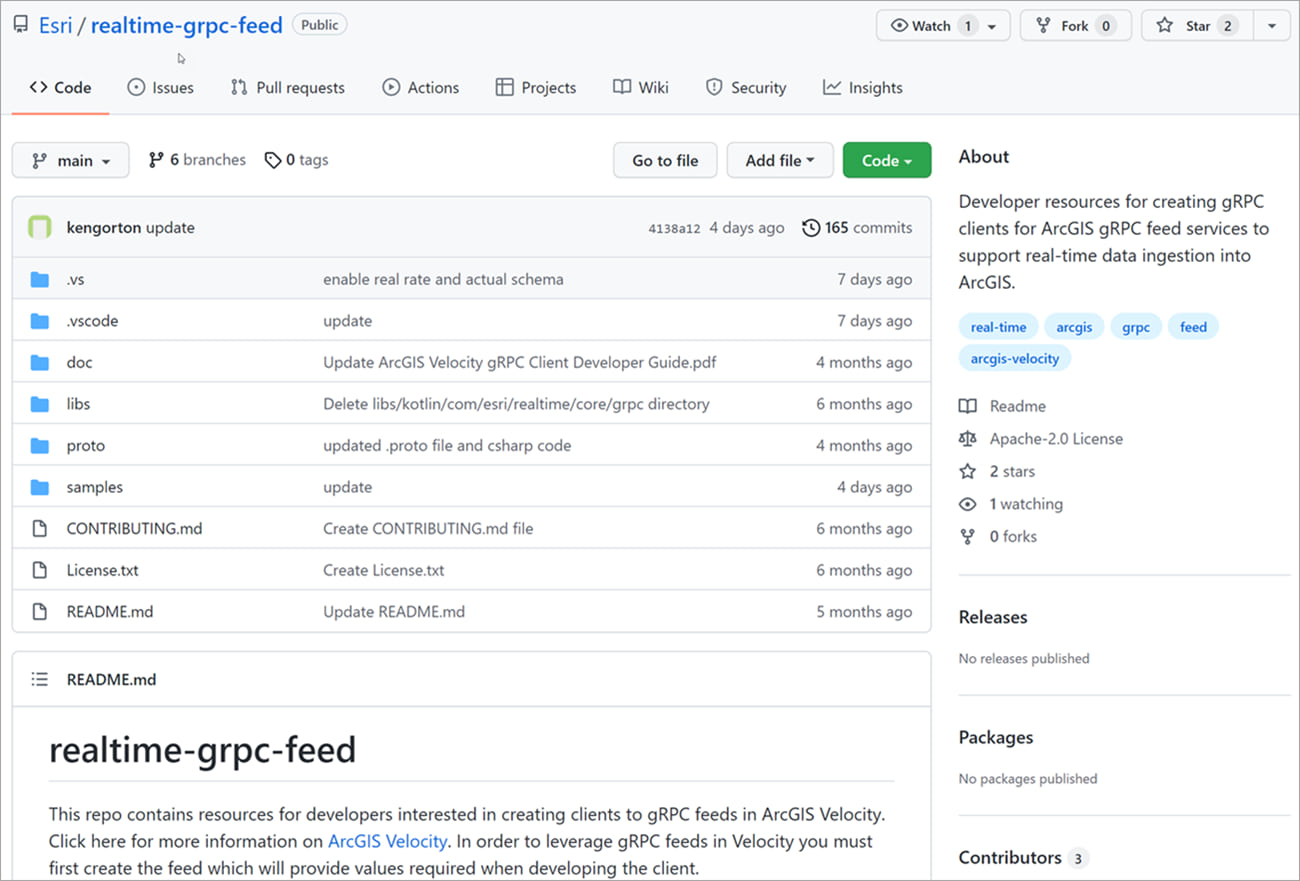
Do you have use cases that require you to ingest real-time data using feed types not available in ArcGIS Velocity? If so, you’re in luck with this release. The gRPC feed type, based on the gRPC remote procedure call framework, is out of beta and is fully supported for production workflows. This feed type allows you to push real-time data into ArcGIS via a hosted endpoint, by developing integrations for real-time data providers not supported out-of-the-box with Velocity. To get started, review the documentation, learn more about how the gRPC feed works by reading the Velocity Blog in the Esri Community, and check out all the great resources available to developers in the gRPC feed repo in GitHub.

The Geotab feed type was also enhanced to enable specifying additional attributes from the Geotab database for ingestion, for example allowing you to enrich your tracking dashboards with driver information.
And lastly, the Feature Layer (new) output has been enhanced to support writing output data to ArcGIS Online hosted feature layers from big data analytics. Note that, as with real-time analytics, there are limits on the supported output rates to hosted feature layers.
Analytics
At an earlier release, dynamic geofencing and dynamic join capabilities in your real-time analytics were introduced in beta. With this release, we’re excited to announce they are out of beta and fully supported in your production workflows. Dynamic geofencing and joins are important because they support use cases where finding relationships, performing spatial enrichment, and making decisions based on spatial proximity between two real-time feeds are necessary. Tools that support these capabilities include Detect Incidents, Filter by Geometry, Calculate Distance, and Join Features.
In addition, both the Detect Incidents and Join Features tools have been updated. Detect Incidents in real-time analytics now returns incident duration in milliseconds instead of seconds, to better align with the tool specification. And Join Features now allows the target feature’s geometry to be replaced with the geometry of the join feature. This benefits many different use cases such as infrastructure hazard monitoring; for example, affected infrastructure features can be returned and visualized immediately in a web map.
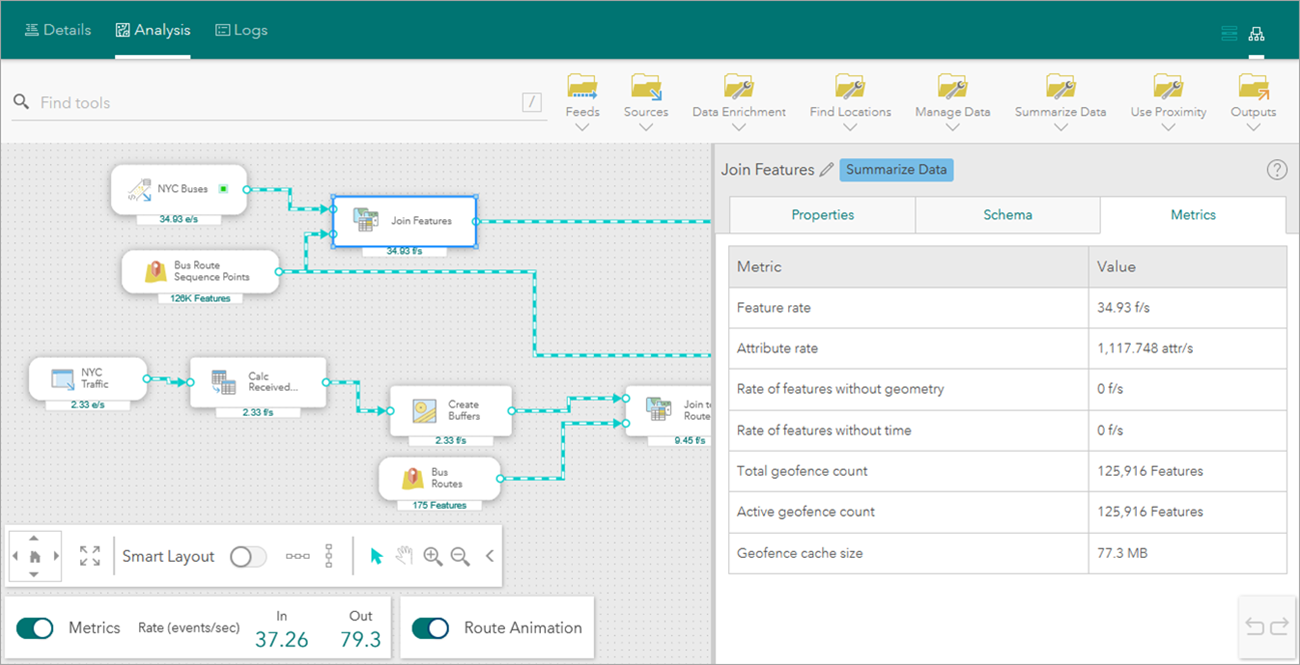
Finally, new analytic metrics are available in the editor experience when analysis tasks are running, including data rate in bytes per second and the size of the join/geofence data for tools that run on two inputs.

These new metrics are useful when troubleshooting or trying to figure out if an analysis process is working as expected. For more details, see View analytic details and status.
Visualization
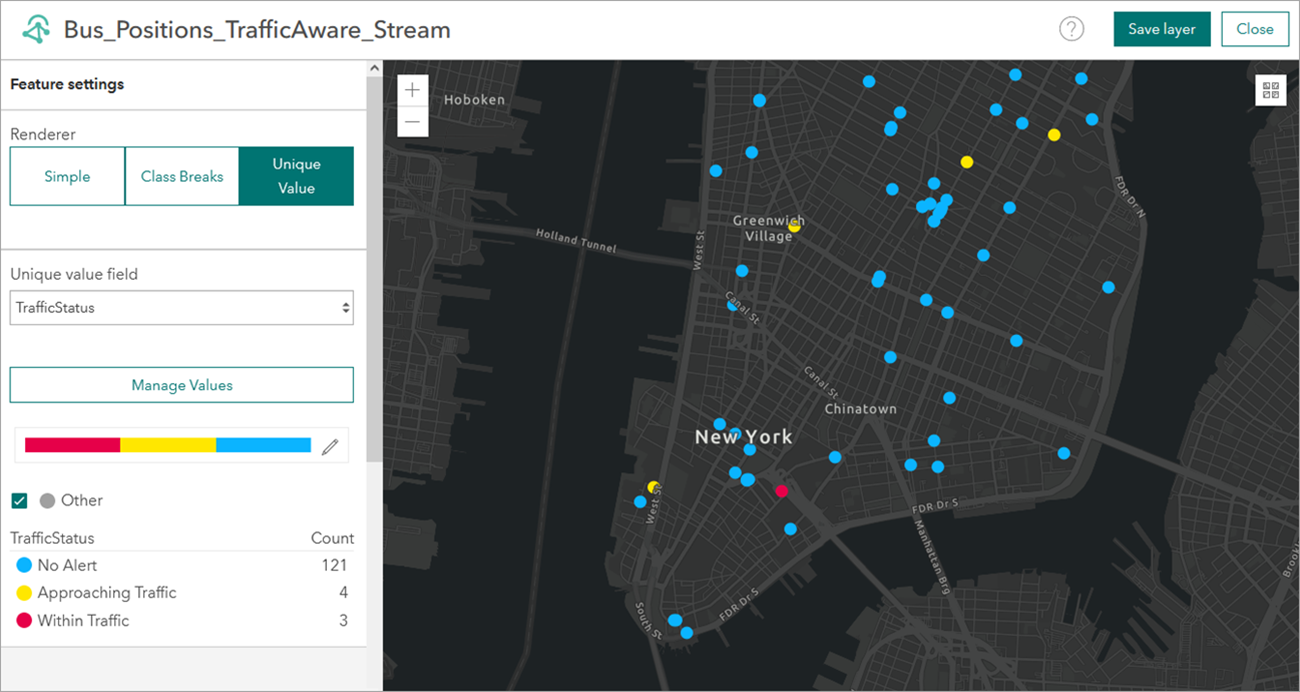
In many use cases, visualizing your streaming data and results of analysis in a web map is critical. You now have a new experience for defining the symbology of your output stream layers including simple, class breaks, and unique value rendering.

This expands the ability to use stream layers in the new ArcGIS Online map viewer with user-defined rendering. For more information, see Visualize stream layers.
Moreover, the stream service was updated for scenarios when the service is configured to store the latest observation in an associated feature layer, as well as when associating a reference feature layer to provide geometry for incoming data.
Furthermore, enhancements were made to spatiotemporal feature layer views to enable item details to display the relationship between a view and its source feature layer and allow users to set view definitions within the new ArcGIS Online user experience.
And more…
For a complete list of enhancements, check out the what’s new topic in the documentation. If you have ideas/enhancements/feature requests for the product, be sure to post them on the ArcGIS Velocity Ideas board in the Esri Community.
To learn more about Velocity, peruse the available resources to access product videos, quick lessons, documentation, and more!

Article Discussion: