July 2023: Waze has made some changes to the Waze Data Feed links and this blog has been updated to reflect these changes. Please see below for details.
Many local governments and municipalities use Waze data for crowd-sourced reports on traffic jams, road hazards, crashes and other issues. This data provides situational awareness, helping these organizations quickly respond to incidents, understand patterns of transit flow and improve motorist safety.
Waze and Esri’s partnership (Waze for Cities program) enables cities to share their data in ArcGIS into Waze. This data includes road closures and points of interest. Waze provides back a real-time stream of community-reported alerts. Esri then provides this data as a live layer so that governments can integrate it into web applications and dashboards for operational insight.
Waze data can now also be used for incident detection, response, and pattern analysis with ArcGIS Velocity. In this blog, we will go over the steps to configure a feed of Waze data and use that feed in in a real-time analytic.

Ingesting Waze alerts
A feed is a new type of item in ArcGIS that connects to external real-time data sources, ingests data, and makes it available for visualization, storage, and analysis. Feeds bring in data from either ArcGIS data sources such as feature layers, IoT cloud providers, web & messaging platforms or partner APIs (in this case Waze).
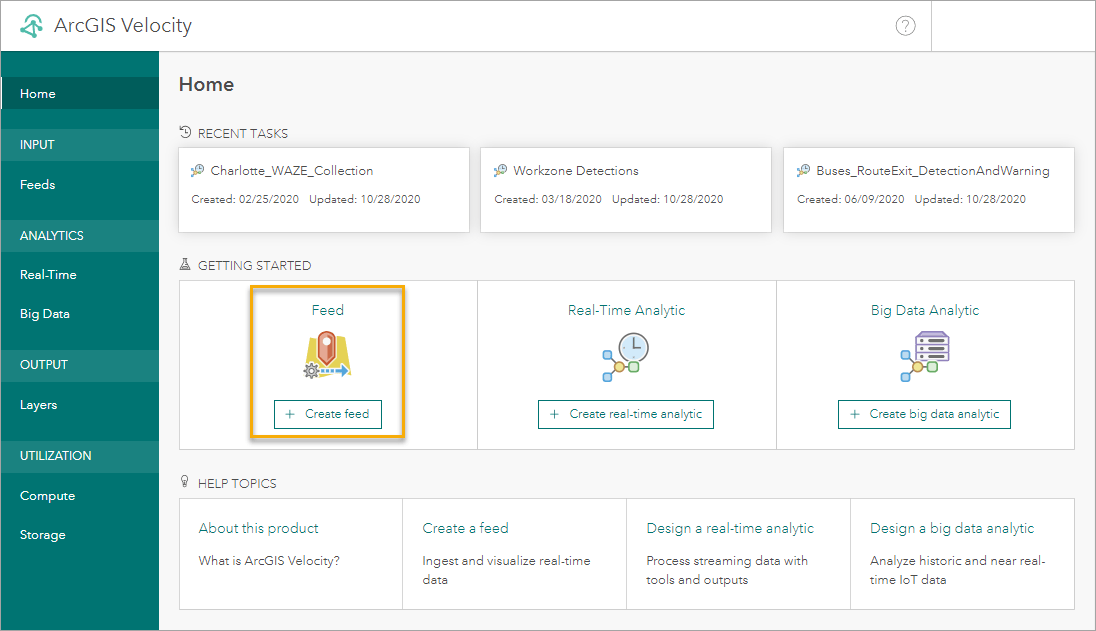
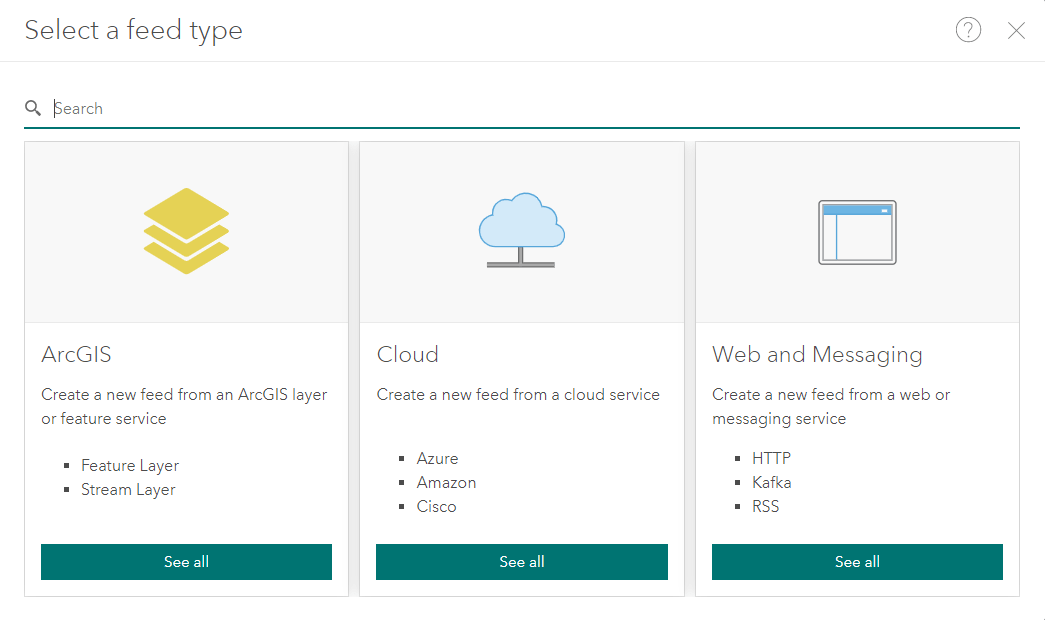
To connect to the Waze for Cities data stream, you can use the HTTP –> HTTP Poller feed type under Web and Messaging. The HTTP Poller feed type allows you to send a request to a website or third party API to request data on a recurring basis. To get Waze alerts, enter the URL request to the Waze for Cities API. You will be able to obtain this URL from the Waze Partner Hub site.
Your URL to Waze will look similar to the below. In this example, the URL is requesting the data back in JSON (format=1), and specifically the alerts data (types=alerts):
https://www.waze.com/partnerhub-api/partners/<partner-id>/waze-feeds/<unique-token>?format=1&types=alerts
In the above, you would substitute your partner id and unique token, for example:
https://www.waze.com/partnerhub-api/partners/116773849/waze-feeds/646a7d93-6e34-42ca-b3aa-15487953abcd?format=1&types=alerts
Additional URL parameters for retrieving the data from Waze are documented on the Waze Data Feed spec.
The HTTP Poller feed also allows you to configure connection properties like method (GET vs POST), authentication, custom headers.
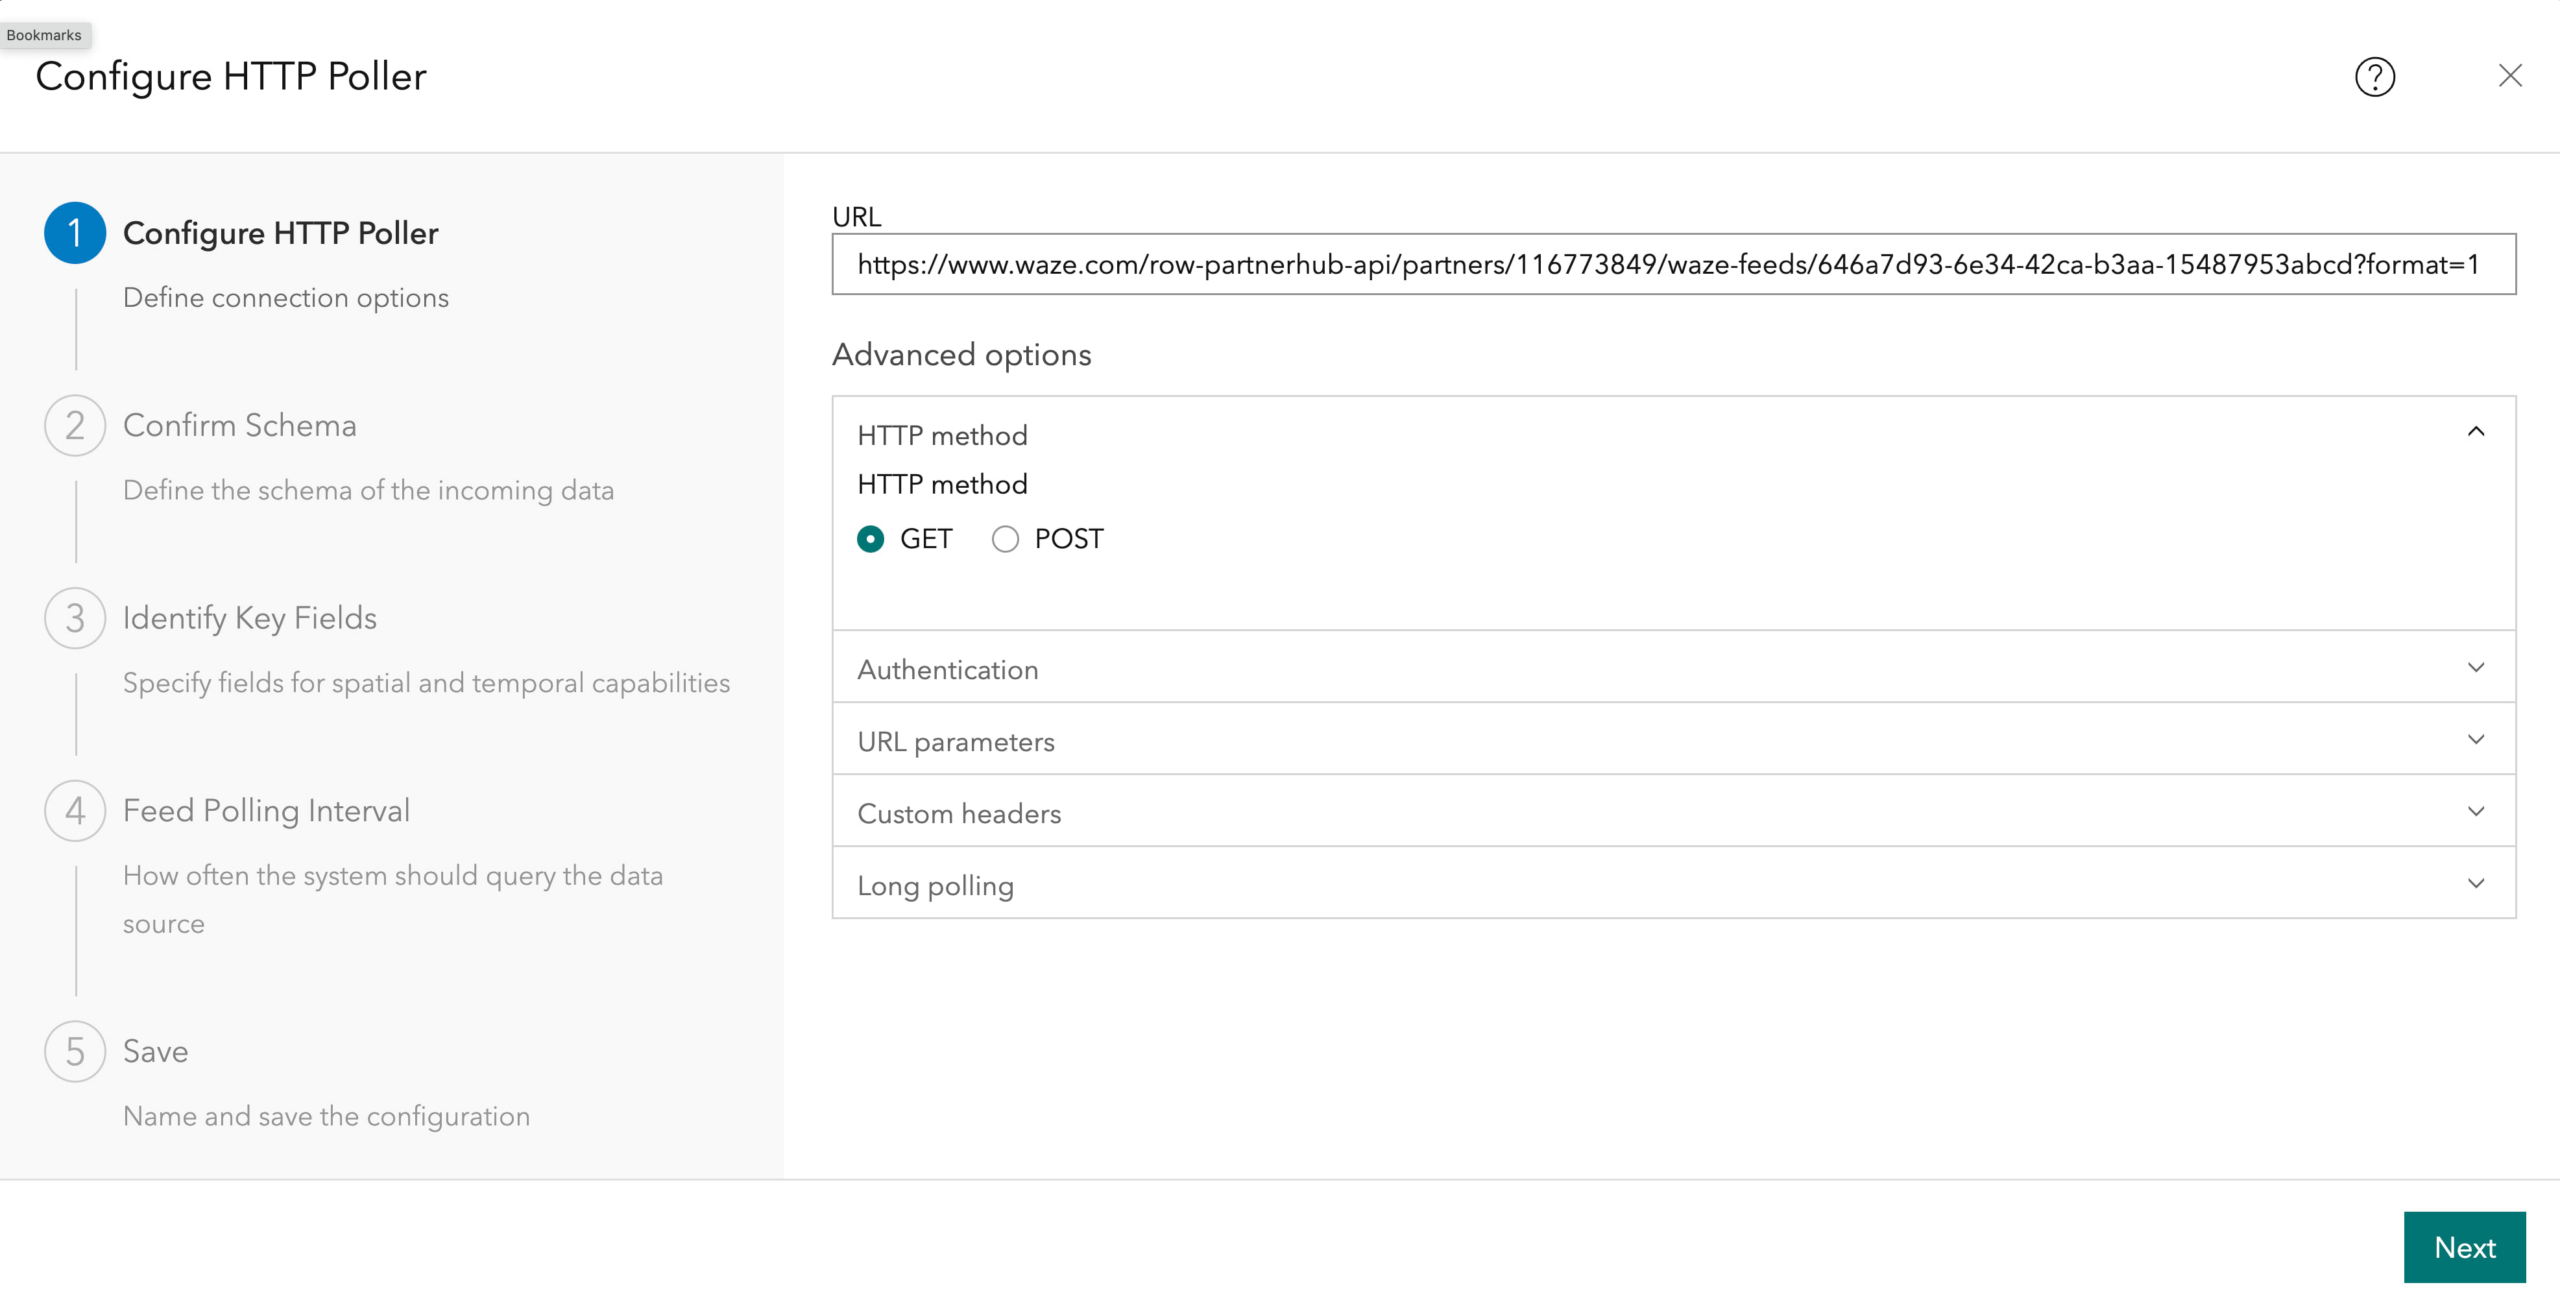
After entering the connection information, ArcGIS Velocity samples the data stream and derives the schema for you.
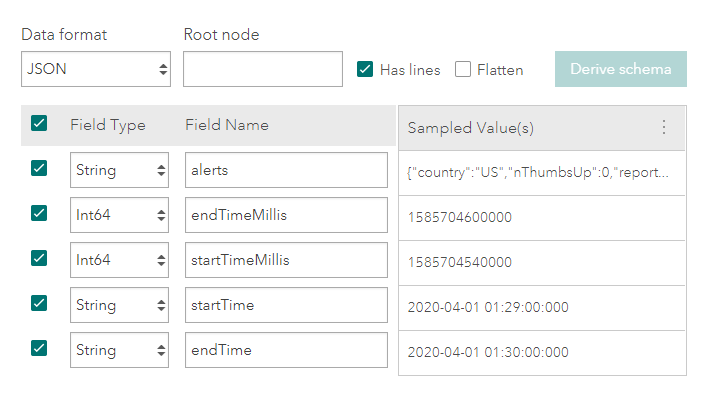
Waze data is being returned as JSON in this case, but the structure is nested and the various event records are contained within the “alerts” JSON node. Individual messages in nested JSON structures can be parsed by specifying the root node containing the information of interest, so you can enter “alerts” in the root node text box and press Derive Schema to update the automatically generated list of fields.
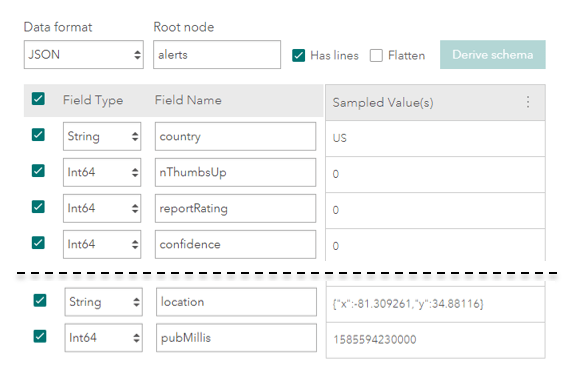
The schema now shows the attributes of the Waze reports themselves, including measures like report rating, confidence, and report type.
There’s also an attribute called “location” which a nested object containing the x and y coordinates. You can use the Flatten checkbox to break out all attributes to a single level.
Next you have the opportunity to flag how the geometry, time information, and track id should be recognized in incoming data. For Waze alerts:
- Messages are point features that are represented as x and y coordinates in the WGS 1984 spatial reference
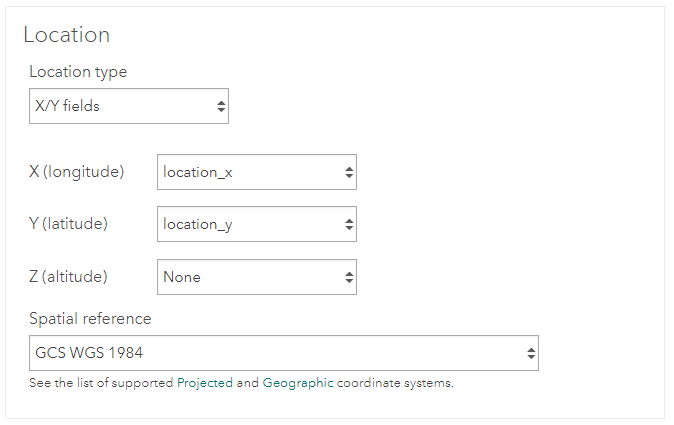
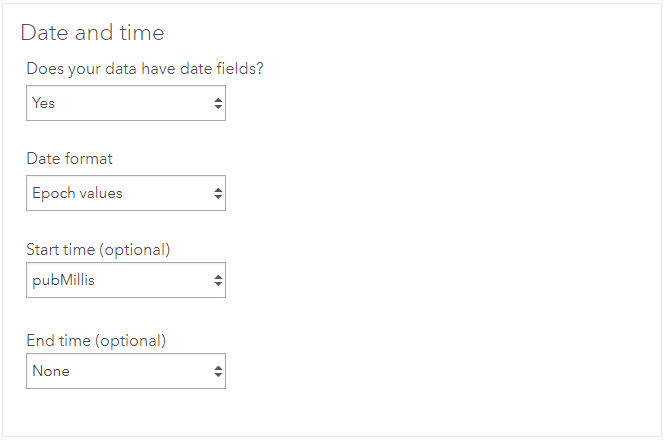
- Each alert has a single timestamp field, “pubMillis”, which represents datetime as epoch values
- The track id, or unique identifier for each entity is the “uuid” attribute, which is the id of the report itself (not the user making the report)

Following these key properties, you can define how often you want to request data as the feed runs. The right frequency will vary based on the use case – for example if the incoming data is only reported once every 5 minutes there’s no need to poll every minute. Waze users are reporting data all the time, so a frequency of 1 minute or 30 seconds might be appropriate.
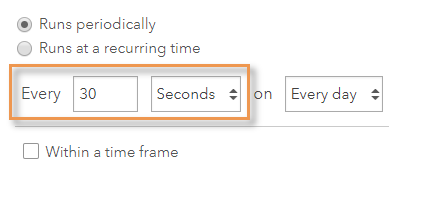
With that, you’re done configuring your Waze feed. Just give it a name and a summary to complete the publication process, and once the feed is running, you can open it in the ArcGIS map viewer to immediately visualize the real-time data.
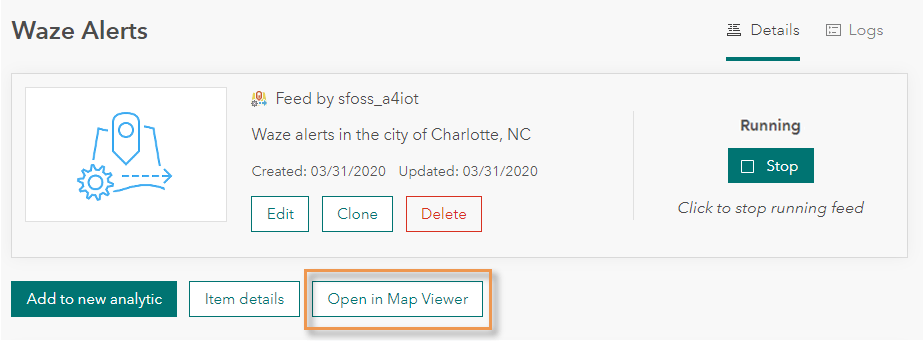
In a web map, a feed behaves like a stream layer, meaning that as new data arrives it’s immediately pushed to the web map. If you set your polling schedule to 30 seconds, you’ll see the latest alerts on the web map after that amount of time upon adding the layer.
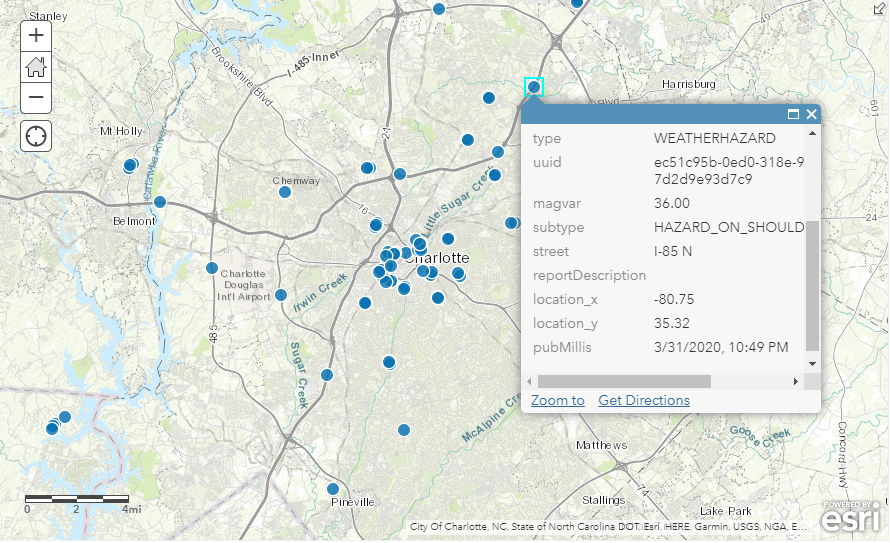
When it comes to visualizing Waze reports, both the Waze Live Alerts Layer and a user-defined Waze feed can be incorporated into end user applications and each serves different purposes. The Live Alerts Layer always shows events from the past hour, keeping a consistent time period of data on the map. You’ll want to set the refresh interval to 1 minute to keep loading the latest data. A feed layer of Waze alerts will receive new data automatically and retain those events as long as the map is open, up to a maximum of around 2000 features (after which the oldest data points will drop off). This allows you to display more than an hour of data if necessary. Beyond ingestion and visualization, a feed can be used to ask questions of and collect incoming data using real-time analytics, so that you can cut through the noise and identify important incidents.
Processing and collecting Waze alerts
Using Velocity, you can configure real-time analytics to transform, enrich, analyze, and store incoming data, and make data-driven decisions.
For instance, you can store Waze data for your municipality and use it to assess patterns of traffic jams or crashes and generate ideas to improve driver safety.
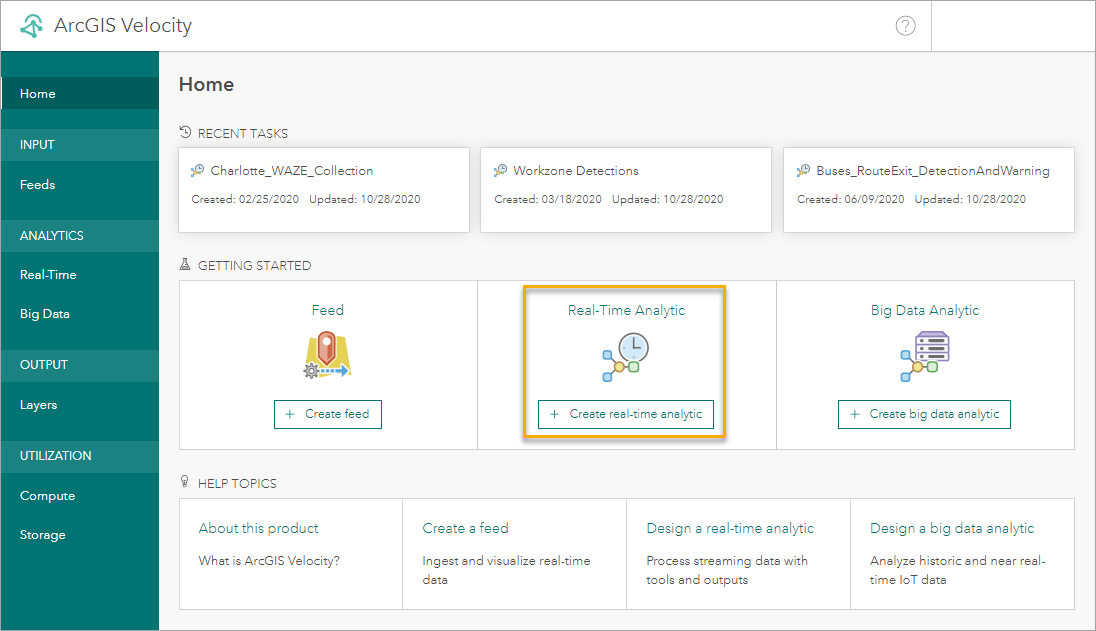
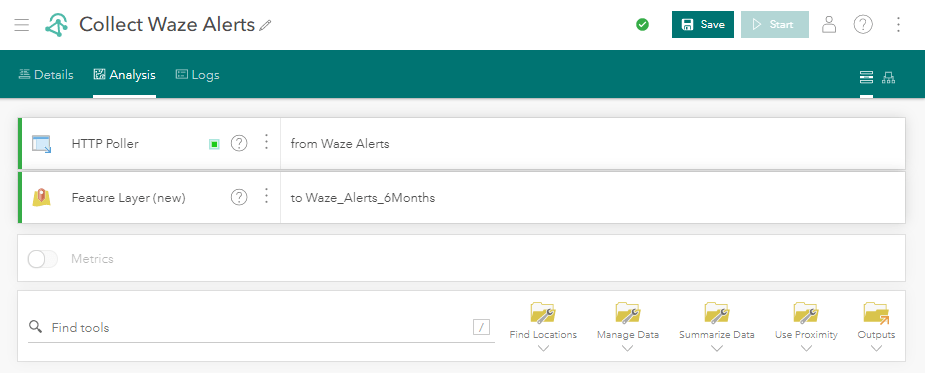
A real-time analytic starts with at least one input feed, so in our example here we’ve added a Waze feed like the one described in the previous section.
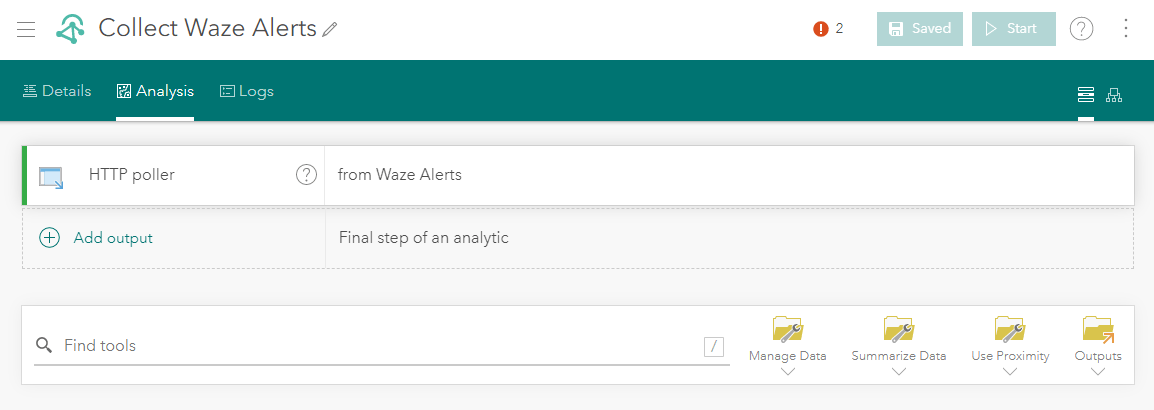
From here, you can add any number of tools to adjust or analyze data, and outputs to dictate where you want to send data at the end of the process. For Waze data, you can write the alerts to a new feature layer. This output gives you a couple of storage options.
Under Data storage method, you can choose whether you want to add every observation or keep the latest observation for every track id. For Waze alerts, you should actually choose to keep the latest feature, because the same event could be reported by Waze between subsequent request of the API, meaning you’d end up with duplicate alerts in the output.
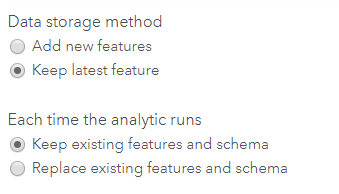
Under Each time the analytic runs, leave the option for Keep existing features and schema. Analytics can be used either to append results to your output feature layer, or to replace the previous results every time the analytic runs. Replacing previous results is more common when working with big data analytics as you try out different analytical approaches.
Finally, you’ll choose a data retention setting for this output feature layer. This allows you to store the Waze data for longer than the past hour, building up a historical archive that can be used for broader pattern analysis. You can also archive older data to the feature archive (cold store).
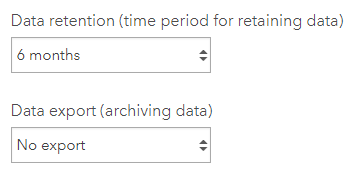
So far, we’ve put together a simple real-time analytic that stores all incoming Waze alerts. This could be expanded upon with steps that, for example, enrich the alerts with additional information about their spatial context, or filter events based on patterns of interest.
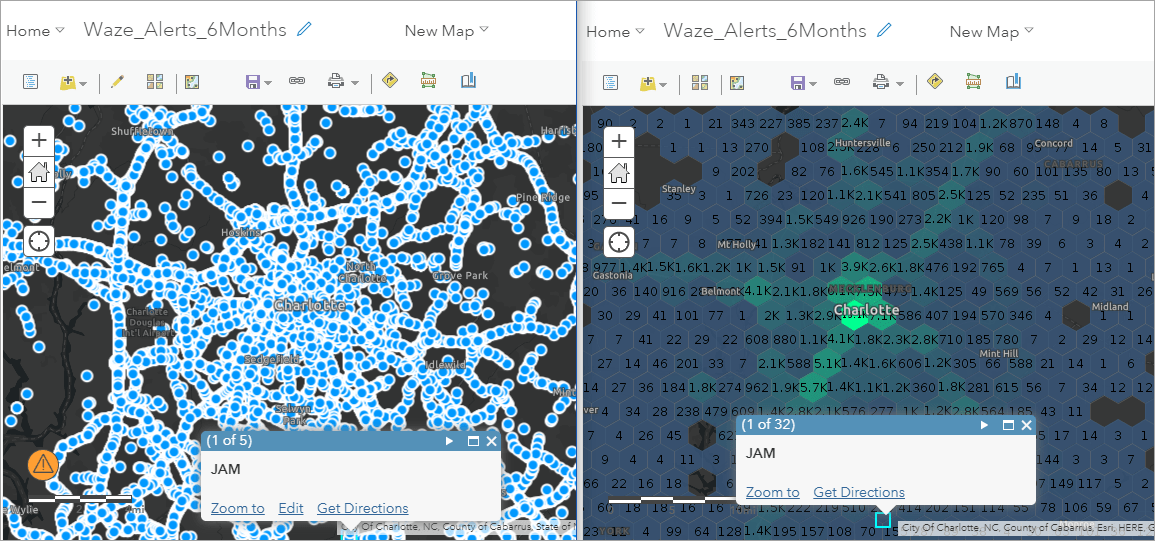
Once the real-time analytic is started, and data is flowing, the feature layer is automatically created and managed by ArcGIS Velocity. A map image layer for the data is also created, which allows you to visualize data as dynamic aggregations such as the count of alerts in any area. This is useful for working with data that can accumulate to higher volumes like Waze.
What’s coming
In a later blog, we’ll share how you can analyze and summarize Waze alerts using big data analytics. Meanwhile, learn more about ArcGIS Velocity with the help of these resources – product page, resource page, blogs and YouTube playlist. You can also read more about Esri’s partnership with Waze.

Article Discussion: