Every single day, employees of United States federal agencies are doing important work—work that benefits people living all across the U.S., and even throughout the world.
We know that it can sometimes be a challenge to effectively communicate the fruits of that work in a way that feels accessible and tangible to the public. That’s where ArcGIS StoryMaps comes in.
ArcGIS StoryMaps is a powerful (and FedRAMP-compliant) multimedia storytelling tool that is tailor-made for taking complex, nuanced, and often data-heavy subjects and presenting them in ways that anyone can understand and draw conclusions from. But it’s also a perfect medium for other, less information-dense purposes: presentations, announcements, newsletters, photo galleries, etc. To our delight, we’ve seen federal agencies take full advantage of ArcGIS StoryMaps to tell their stories across the entire spectrum of uses.
In fact, we’ve been so impressed by their efforts that we’ve put together a collection of more than 20 exemplary stories that have been produced by federal agencies. Let’s take a closer look at six of those stories, created by six different agencies, and each showcasing a different way that ArcGIS StoryMaps can be used to great effect by the federal government.
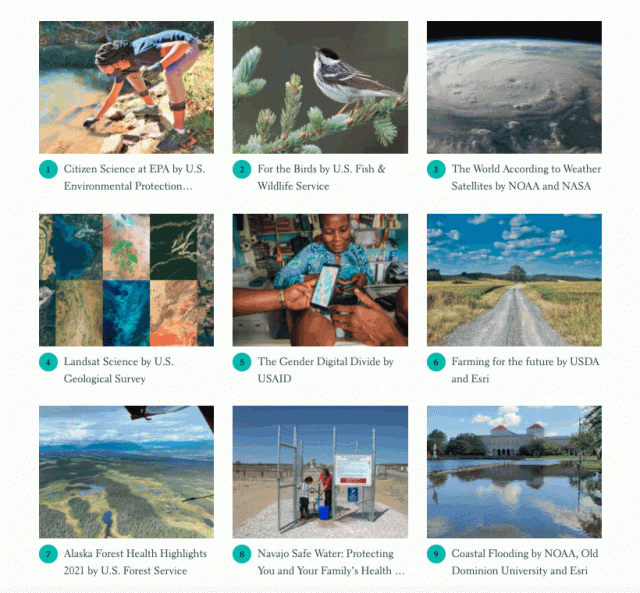
ArcGIS StoryMaps can be used to…
Promote a specific project or initiative
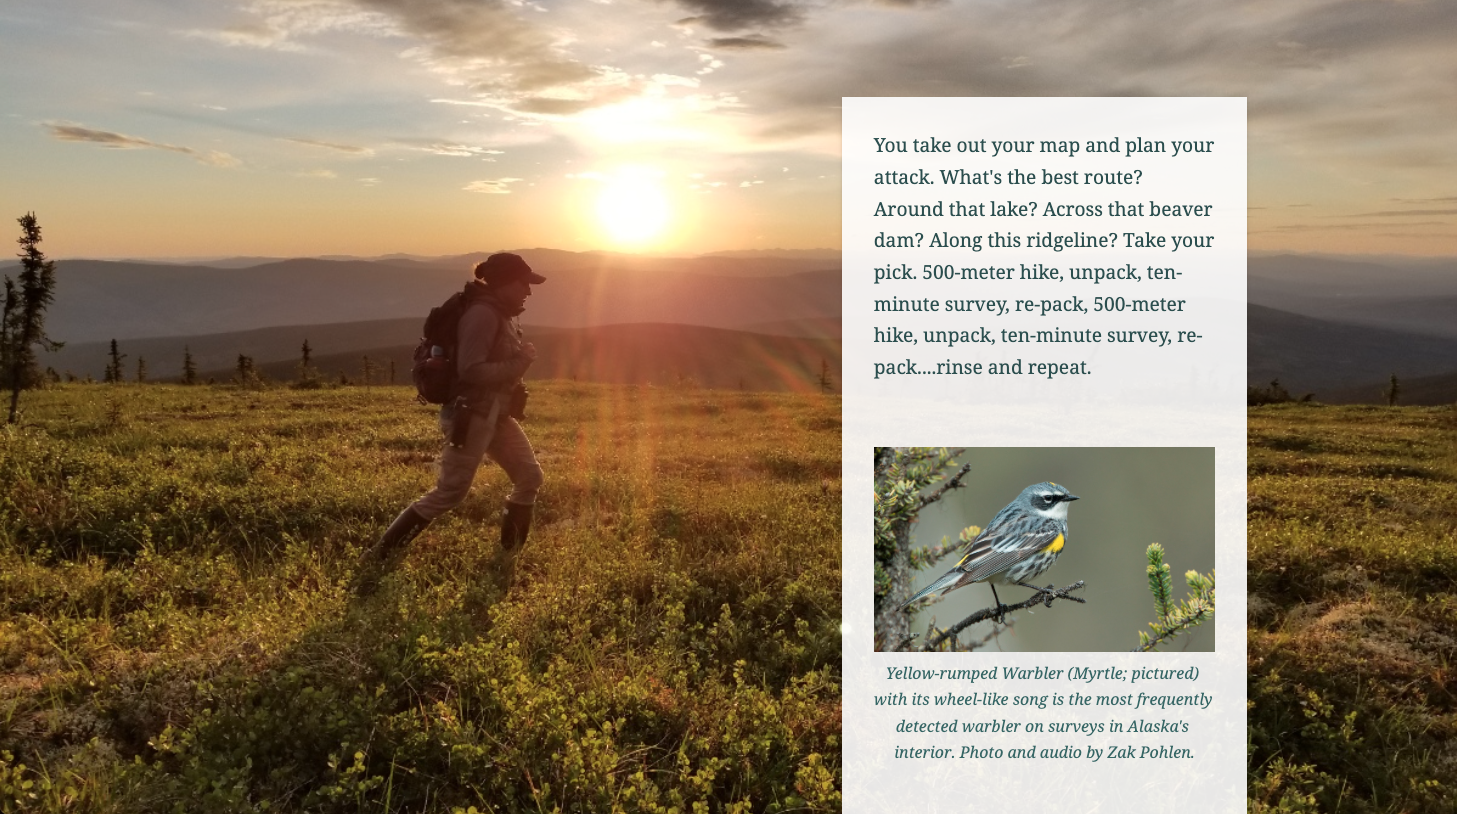
The U.S. Fish and Wildlife Service’s story For the birds is not at all for the birds—it’s actually a wonderful example of how ArcGIS StoryMaps can be used to keep the public informed about specific initiatives or projects. In this case, the story chronicles USFWS efforts to monitor breeding landbirds in inland Alaska.
For the birds starts with an engaging second-person narrative to set the stage and draw the reader into the scene, then keeps them hooked with a variety of multimedia components. Gorgeous photography, short videos, and simple, interactive maps are complemented by the use of ArcGIS StoryMaps’ background audio capability. Layering in the sounds of nature and birdsong really creates an immersive experience for the reader! And through it all, the story’s text succinctly explains what the project’s goals are, why they’re important, and also invites participation at the end.
Raise awareness of a broader issue
ArcGIS StoryMaps is also an effective way to educate the public about broader issues that could affect large chunks of the population—and to talk about what the federal government is doing to address those issues. One top-notch example of this approach is the National Oceanic and Atmospheric Administration’s primer on Coastal flooding.
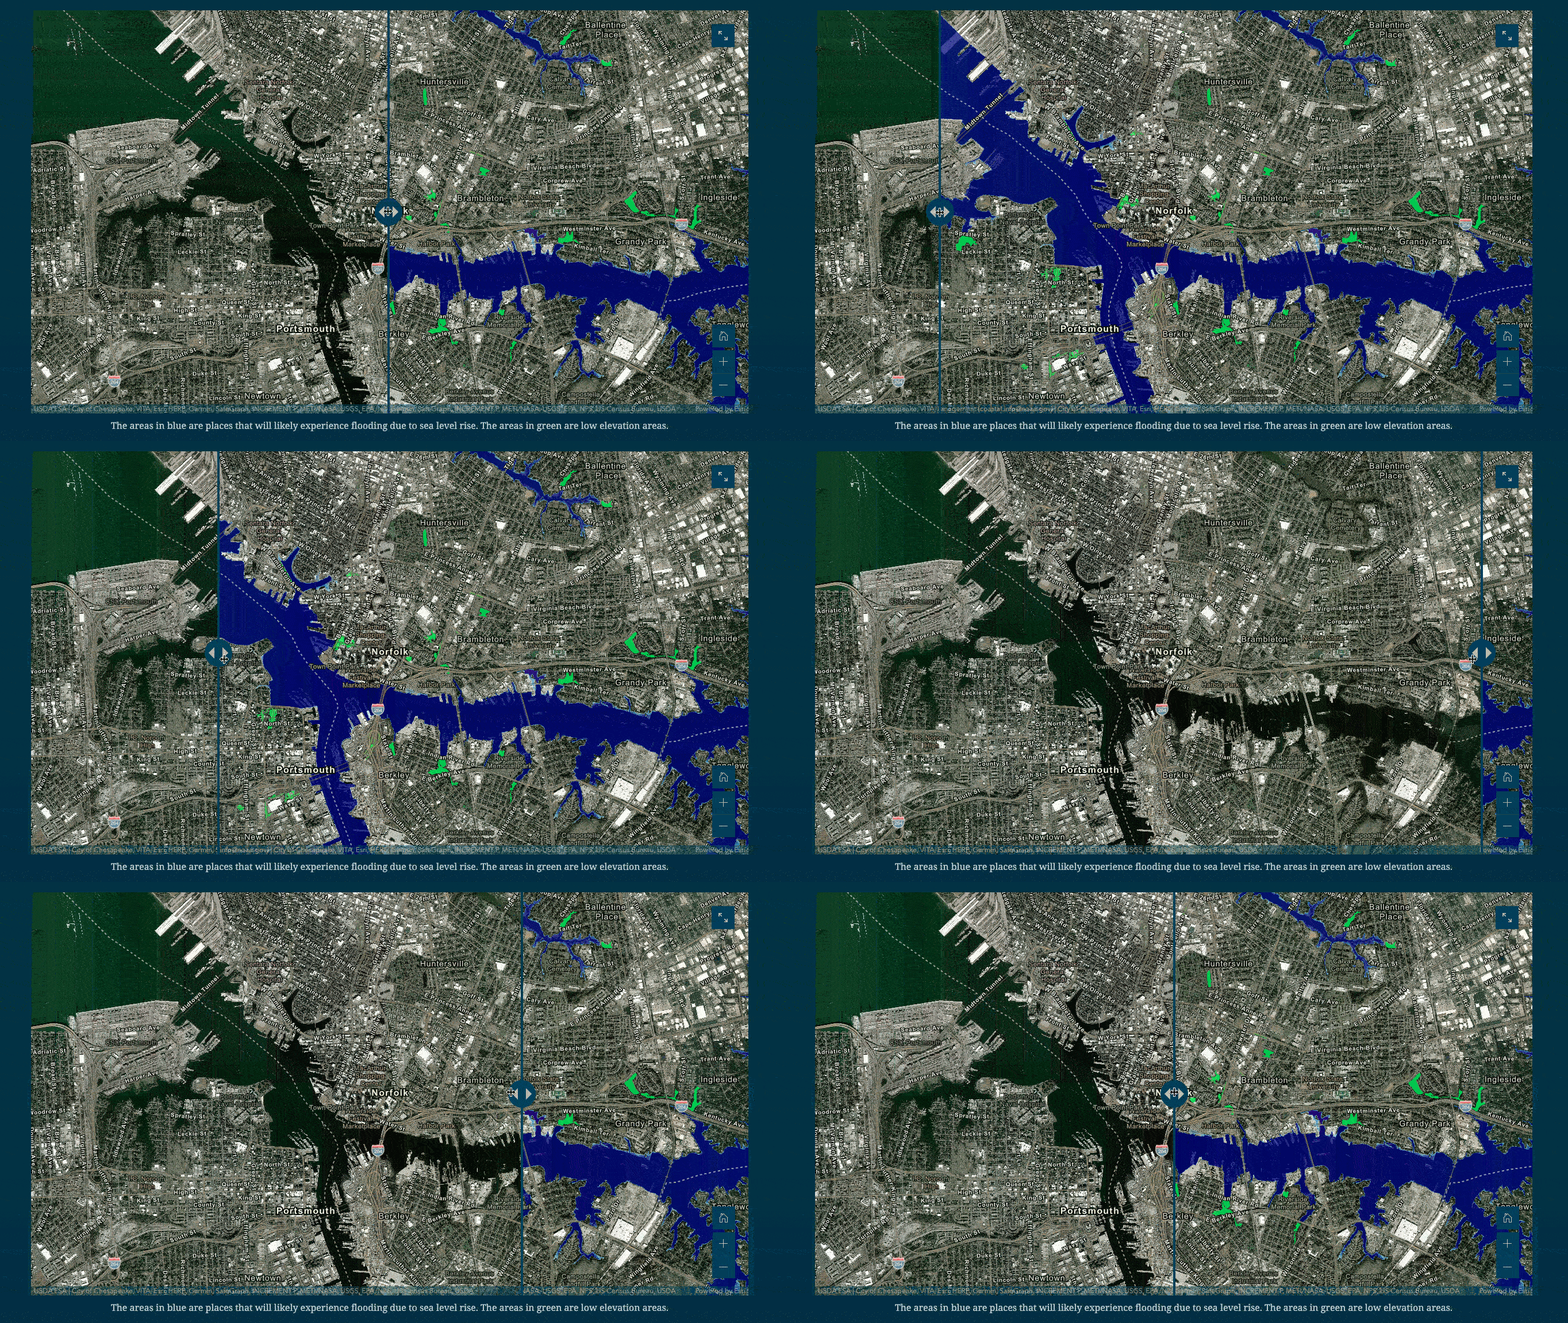
The topic of sea level rise is worthy of entire books, but in one quick read, NOAA’s Coastal flooding story manages to deftly introduce the threat of flooding in a brief tour of its impact around the world. The story then brings geographic data into the picture in simple terms while avoiding jargon or complicated technical concepts. Finally, it focuses on the future of one particular region of coastal Virginia. Especially eye-catching is the use of a swipe block to compare present-day satellite imagery with the potential outcomes of rising seas.
Engage with and solicit input from the public
It’s one thing to put together a whiz-bang story that shows and tells about a particular federal project, but ArcGIS StoryMaps can help get constituents involved, too. Giving members of the public the chance to make their voices heard is not only the right thing to do, it’s also a necessary part of some processes and regulations, such as the National Environmental Policy Act. The National Park Service’s story Mount Rainier National Park is a shining example of how to do just that.
The story outlines the need to develop a new management plan for the Nisqually Corridor of that park and shares the process of formulating that plan. To help convey those messages, the NPS makes fantastic use of multiple immersive blocks, namely slideshow, as an “aside” relating the history of the park, and two different guided map tour layouts that walk through important points in the focus area of the park.
But to get readers to make the jump over to the NPS website where they can submit their own input, the story relies on one of the simpler, but more elegant features of ArcGIS StoryMaps: buttons. After each section, a request for feedback is punctuated by a lime green button link that stands out against the story’s dark background, making sure that readers won’t miss the opportunity to register their thoughts. (Customizing the colors of story elements can be done using the theme builder.)

Note: While the NPS invites participation through their own website, ArcGIS Online and Enterprise come with a built-in app, ArcGIS Survey123, that can be embedded in stories and used to collect voluntarily submitted information from readers. For more on using Survey123 in conjunction with ArcGIS StoryMaps, check out this blog post.
Provide educational materials for students
One thing we love to see is ArcGIS StoryMaps being used to educate students of all ages, all around the world; its multimedia capabilities are ideal for helping to distill complex topics down into easily understood concepts. Government agencies have been no stranger to such efforts, with the NASA/U.S. Geological Survey “Camp Landsat” course standing out as one of our favorite recent examples.
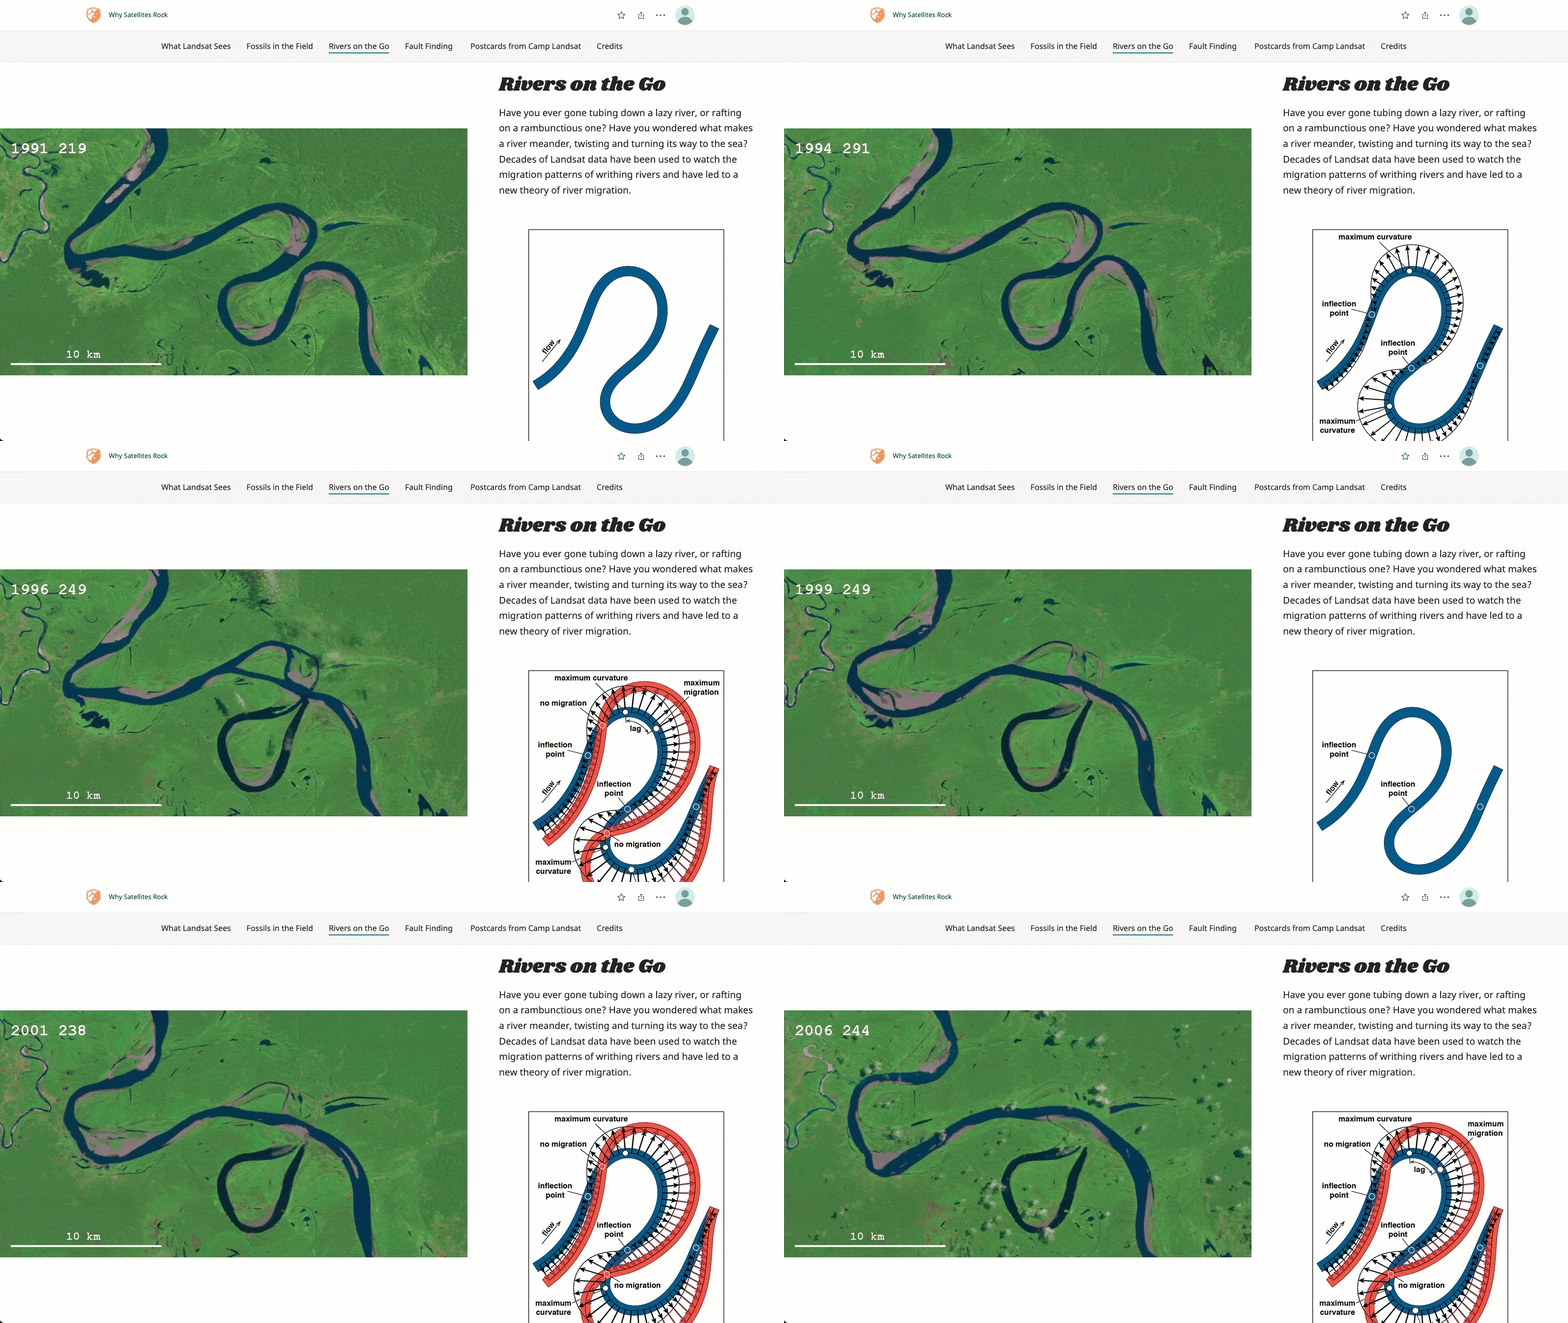
This nine-week online curriculum exposes curious grade school-aged students to the goals, results, and lessons of the Landsat program, the longest-running endeavor to collect comprehensive satellite imagery of the Earth. Each week’s theme comes with an accompanying story, from which much of the associated content is disseminated. For instance, the first week’s story, Why satellites rock, uses sidecar and swipe blocks full of colorful satellite imagery to show how changes in landscapes over time can be observed from space.
Encourage recreational and tourism opportunities
The federal government, among its countless duties, is a steward of millions of acres of public land. Such lands serve a number of purposes, from conservation to recreation, the latter of which often has the ancillary benefit of boosting a local economy through the people it attracts. Thus the agencies responsible for maintaining public lands have not shied away from promoting them. ArcGIS StoryMaps, it turns out, is perfectly suited for providing tourism- and recreation-oriented information, as seen in the Bureau of Land Management’s story, Top BLM motorized recreational opportunities.
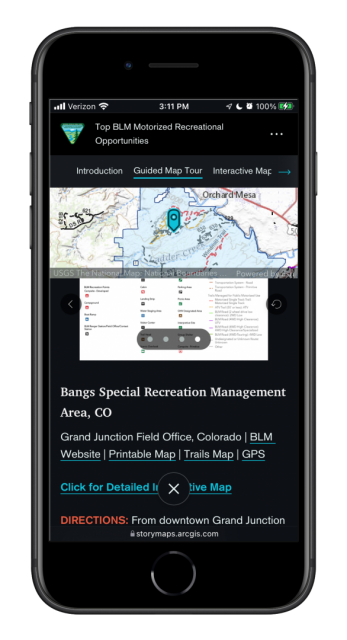
The centerpiece of this story is an explorer map tour consisting of nearly 30 BLM-managed areas that are great for off-road vehicle adventures. Explorer tour differs from guided tour in that readers don’t need to scroll through every single point. Instead, they can use the grid or list of titles and thumbnails, or the array of points on the accompanying map, to jump right to the location(s) that most are most interesting or geographically nearest to them.
What’s especially fun about this story, though, is that BLM has added a good dose of customization to the tour block, taking advantage of the ability to use a web map as the basemap for a map tour. BLM’s basemap contains all of the trail information and other points of interest for each of the featured locations. And, they’ve cleverly reserved one space in each location’s media carousel for a graphical legend that further explains the basemap.
Oh, and because the information presented in this story will be especially useful when people are actually onsite, or on their way there, it’s good to know that ArcGIS StoryMaps is optimized to work on mobile devices, including smartphones.
Give a report or presentation
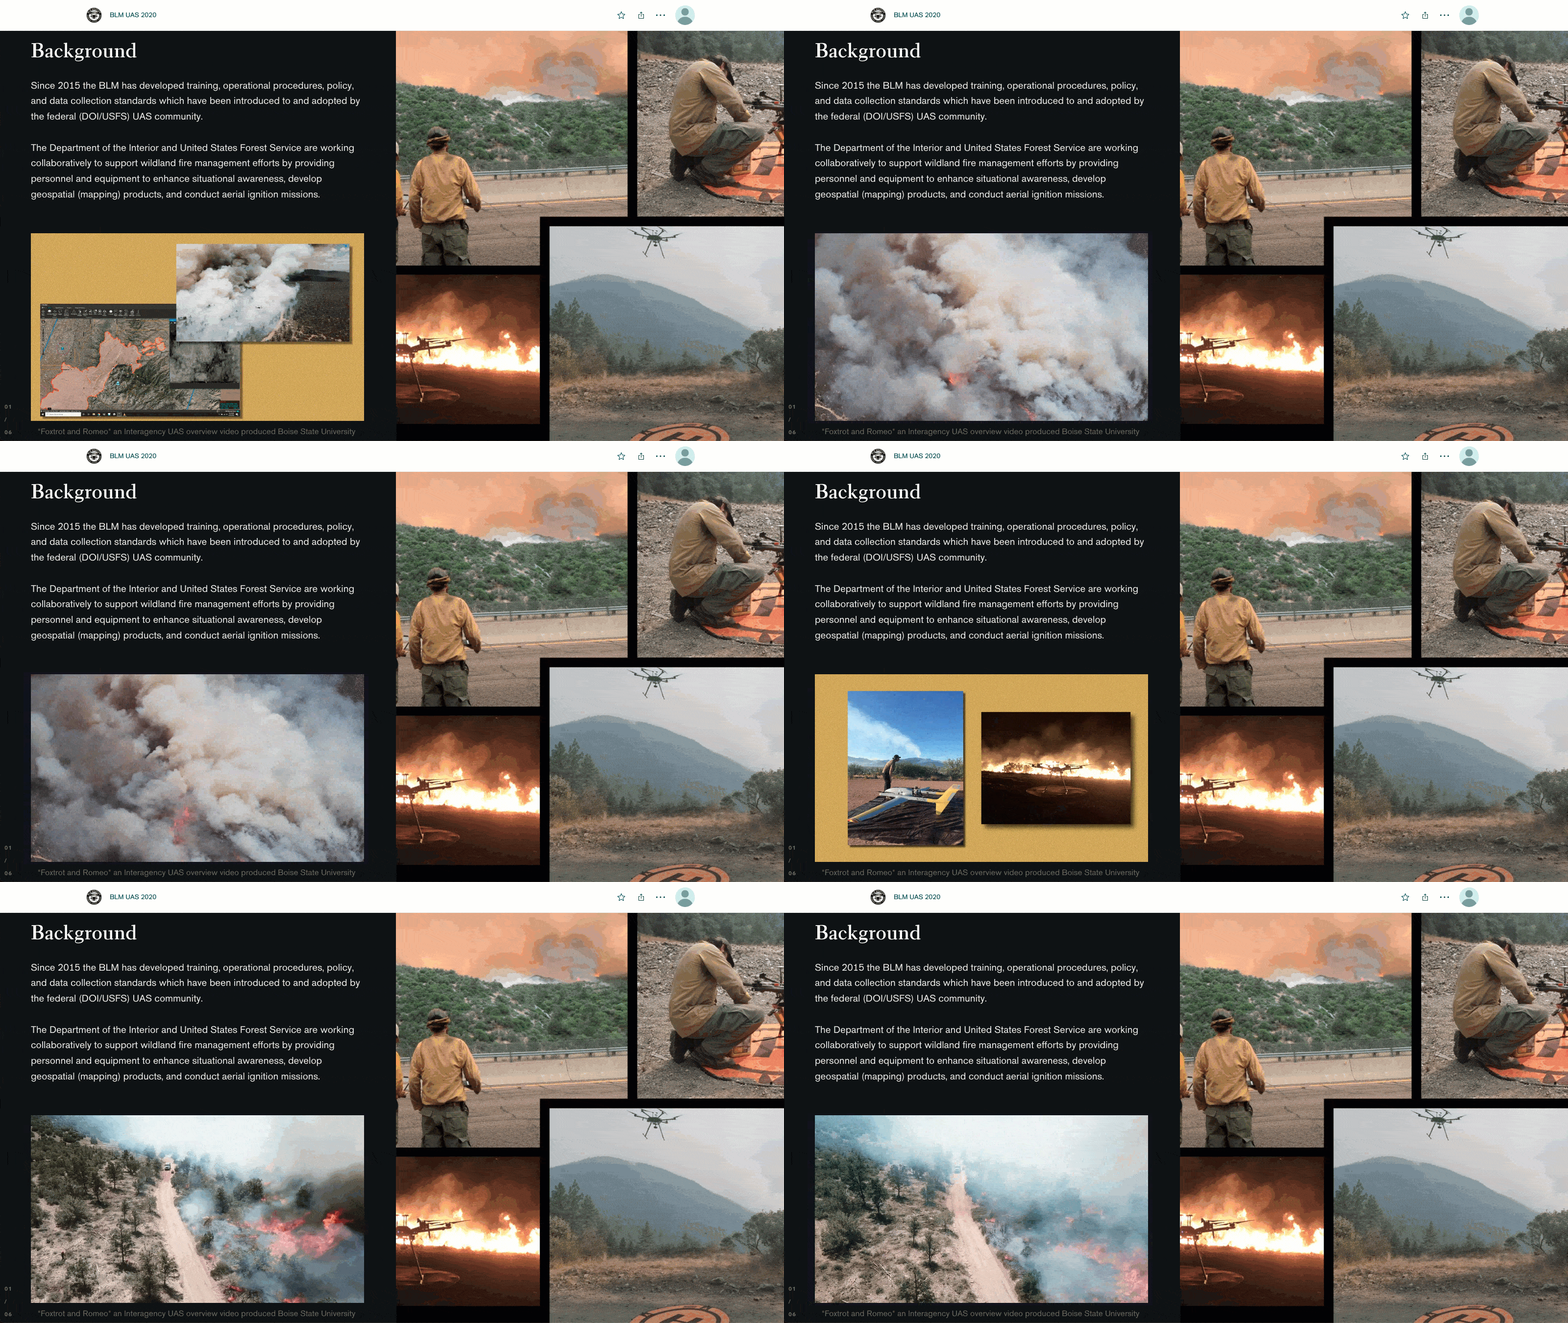
When most people think of an annual report, things like spreadsheets, charts, and—if you’re lucky—some Powerpoint slides are what comes to mind. But BLM’s UAS 2020 isn’t your grandparents’ annual report: It uses ArcGIS StoryMaps to give a recap of the agency’s Unmanned Aircraft System operations during the 2020 financial year. The story makes robust use of ArcGIS StoryMaps’ multimedia capabilities, combining photos, videos, and maps as it talks about the different kinds of unmanned aircraft operations employed by the BLM, the people behind these operations, and challenges and goals for the future.
The six stories highlighted here and the others in our aforementioned federal government collection are just scratching the surface of the myriad ways that ArcGIS StoryMaps can be used—and is already being used—to tell the stories of the tireless work being done by U.S. federal government agencies. If you happen to be aware of other great examples of federal agencies using ArcGIS StoryMaps, never hesitate to reach out to us on Twitter @ArcGISStoryMaps and let us know about them!
It’s also important to keep in mind that many of these use cases, and the features and capabilities that make ArcGIS StoryMaps ideal for them, can be applied far beyond the federal government sphere. Governments and other public service entities at all scales, from multinational organizations down to individual towns and neighborhoods, can benefit greatly from using ArcGIS StoryMaps to tell their stories and achieve their objectives. In another collection, we’ve gathered more than two dozen stories produced by a wide variety of public service agencies that demonstrate the power of ArcGIS StoryMaps for uses such as emergency management and urban planning.
If you work for a federal agency (or any other public service organization) and are intrigued by how ArcGIS StoryMaps could help your agency carry out its missions, our resources page is a good place to start. Or, if you already have some experience putting stories together and would just like some specific guidance, advice, or help, please use the ArcGIS StoryMaps feedback form. Just select “direct product feedback,” then provide a brief synopsis of your needs, and we’ll be sure to get back to you!

Article Discussion: