This post was ghostwritten by Lee Bock, an application programmer on Esri’s StoryMaps team.
_______________
Has this ever happened to you?
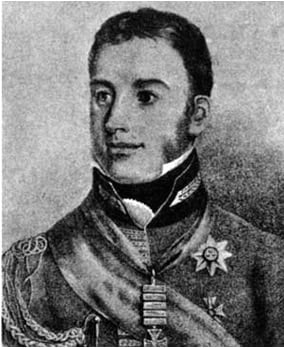
So, there you are…burning the midnight oil to knock out a story about the Battle of New Orleans. You’ve got some great maps and a killer portrait of British Major General Sir Edward Pakenham. Your copy is coming together quite nicely as well. To pull the whole thing together, though, what you really need is a good way to lay out the battle’s chronology.
Sure, you could enumerate the major plot points in a paragraph or two, but your readers will be cranky. Whose brain can be bothered to scan and parse text to construct a sequence of events? You’ll be booed off the stage at the next history club meeting!
A bulleted list, then? Come on…where’s your sense of style? More like the Battle of New Snoreleans (snort).
You might spend a few hours using a graphics program to create a slick timeline image—if you have the know-how. But even that option, though visually appealing, still leaves a lot to be desired: How will the image look on mobile devices? And what about accessibility? Screen readers can’t make much sense of a png…
A new block, just in time
Enter the new ArcGIS StoryMaps timeline block! This block provides a fun and intuitive way to add chronological visualizations to your story in a more flexible and dynamic presentation than static images or purely text-based lists can offer.
Storytellers can enter up to 20 “events” in a vertical chain, and can accompany each event with an image, if desired. You can also add a spacer in between events if you want to indicate that a particular lapse in time is longer relative to others.
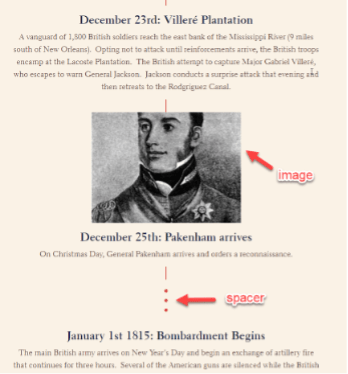
Note that images added to a timeline block are set to fill the allotted space, meaning that they may be cropped, depending on their aspect ratio. You can always change the focal point of the image in the image options (little gear button) to ensure that the most important part of the image will be visible.
Think of the possibilities!
Sure, epic historical sagas are all the rage. But there are so many other ways to apply the timeline block as a storytelling device.
- Think smaller. Some phenomena unfold in moments rather than over weeks, months, or years. Consider using a timeline to document shorter episodes like a vacation or road trip, conference agendas, or even celebrity Twitter feuds.
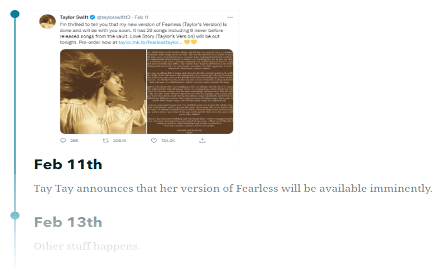
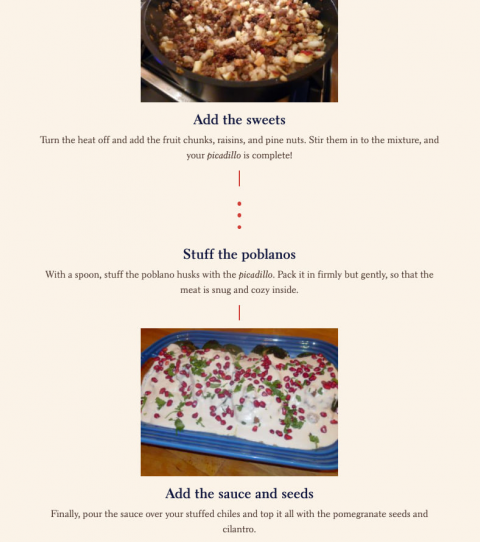
- Steps in a process. Sometimes it’s more about a sequence than precise times. Recipes and other how-to instructions are a natural fit for a timeline block.
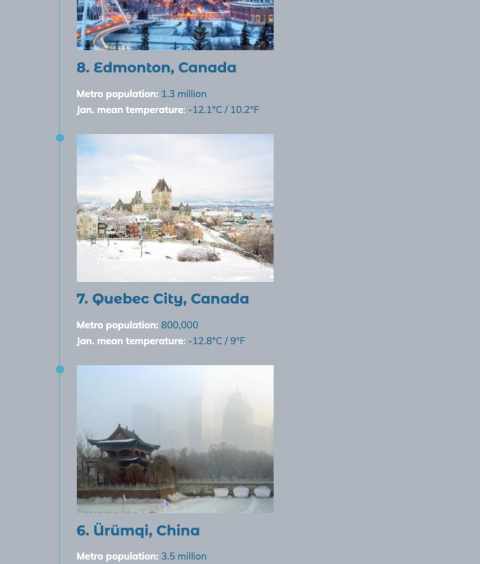
- Rankings. Best cities to live in? Who wore it best? ArcGIS StoryMaps has you covered.
Ready to begin?
It’s super easy to create a timeline in ArcGIS StoryMaps. In fact, here’s a quick how-to guide in the form of…you guessed it…an actual timeline block!
You can even add a timeline block to the narrative panel of both docked and floating sidecar slides.
More to come!
The timeline block is still being worked on to make it even more versatile for storytellers. In the future, look for more layout possibilities, including the exciting prospect of creating timelines horizontally in addition to the vertical layouts.
In the meantime, have fun exploring timeline’s possibilities! Please find us on Twitter or on the Esri Community to give us feedback and share your creations.
Watches photo: Heather Zabriskie, via Unsplash


Article Discussion: