

By showing people how all these infrastructure systems are actually playing a role in their daily lives we can make the case for investing in infrastructure. ArcGIS StoryMaps helps show this overall system of systems approach to infrastructure and how it's all interconnected.
Infrastructure is essential for the functioning of cities and communities across America. It ensures safety and supports daily activities, like driving over bridges or flying to destinations. The quality of infrastructure is crucial for our safety.
The 2025 Infrastructure Report Card by the American Society of Civil Engineers (ASCE) offers a detailed look at America’s core infrastructure, including bridges, roads, ports, and more. It uses geospatial data to provide a comprehensive overview. This year’s report is notable for showing the impact of increased federal investments from the Infrastructure Investment and Jobs Act (IIJA). ASCE is using ArcGIS StoryMaps for the first time to present the findings.
We spoke with Caroline Sevier, Managing Director of Government Relations and Infrastructure Initiative, about the report and the role of geospatial data in evaluating infrastructure. The conversation has been edited for clarity and brevity.
Q. It’s wonderful to speak with you again, Caroline. Can you please share a little about ASCE and your role there for our readers?
I’m the Managing Director of Government Relations and Infrastructure Initiatives at The American Society of Civil Engineers (ASCE) which represents about 160,000 individual civil engineers around the world from the public sector, private sector, and academia. I oversee all federal and state lobbying and advocacy work at ASCE, as well as our policy reports, that help inform that advocacy work. Our hallmark report is the Infrastructure Report Card.
Q. Can you tell me more about what goes into making the Infrastructure Report Card and why this 2025 report is so significant?
The Infrastructure Report Card is a national assessment with corresponding state report cards compiled by representatives from each state. They are developed from public national data sets like the National Bridge Inventory. These datasets provide comprehensive information about the quality of the infrastructure category. A team of 52 engineers across the country analyzes the data to identify trends and determine grades based on key criteria. This allows us to answer the question, “Is our infrastructure getting better or worse from year to year?”
The 2025 Infrastructure Report Card will be the first assessment of our nation’s infrastructure systems since the federal government significantly increased its investments in them. Our last report card came out in 2021, so this is going to be the first insight into the momentum we’ve gotten from those increases.
We’re delighted to see that, for the first time, the overall report card GPA increased from a C- to C. It’s the highest grade we’ve ever gotten on the overall report card.
We’re starting to see really positive momentum from those increases in federal dollars.
Q. Can you describe how ASCE members use GIS technology and geospatial data sets in their work?
Technology like GIS and real time data feeds are really allowing engineers to track the condition and performance of our infrastructure assets. By having these tools, they’re able to do more predictive maintenance and ensure that limited public dollars are going to the projects that have the greatest need, making it less likely that we’re going to see an infrastructure failure down the line. These tools and datasets really have become an integral part of the civil engineering process and are making sure that we are making wise investments overall.
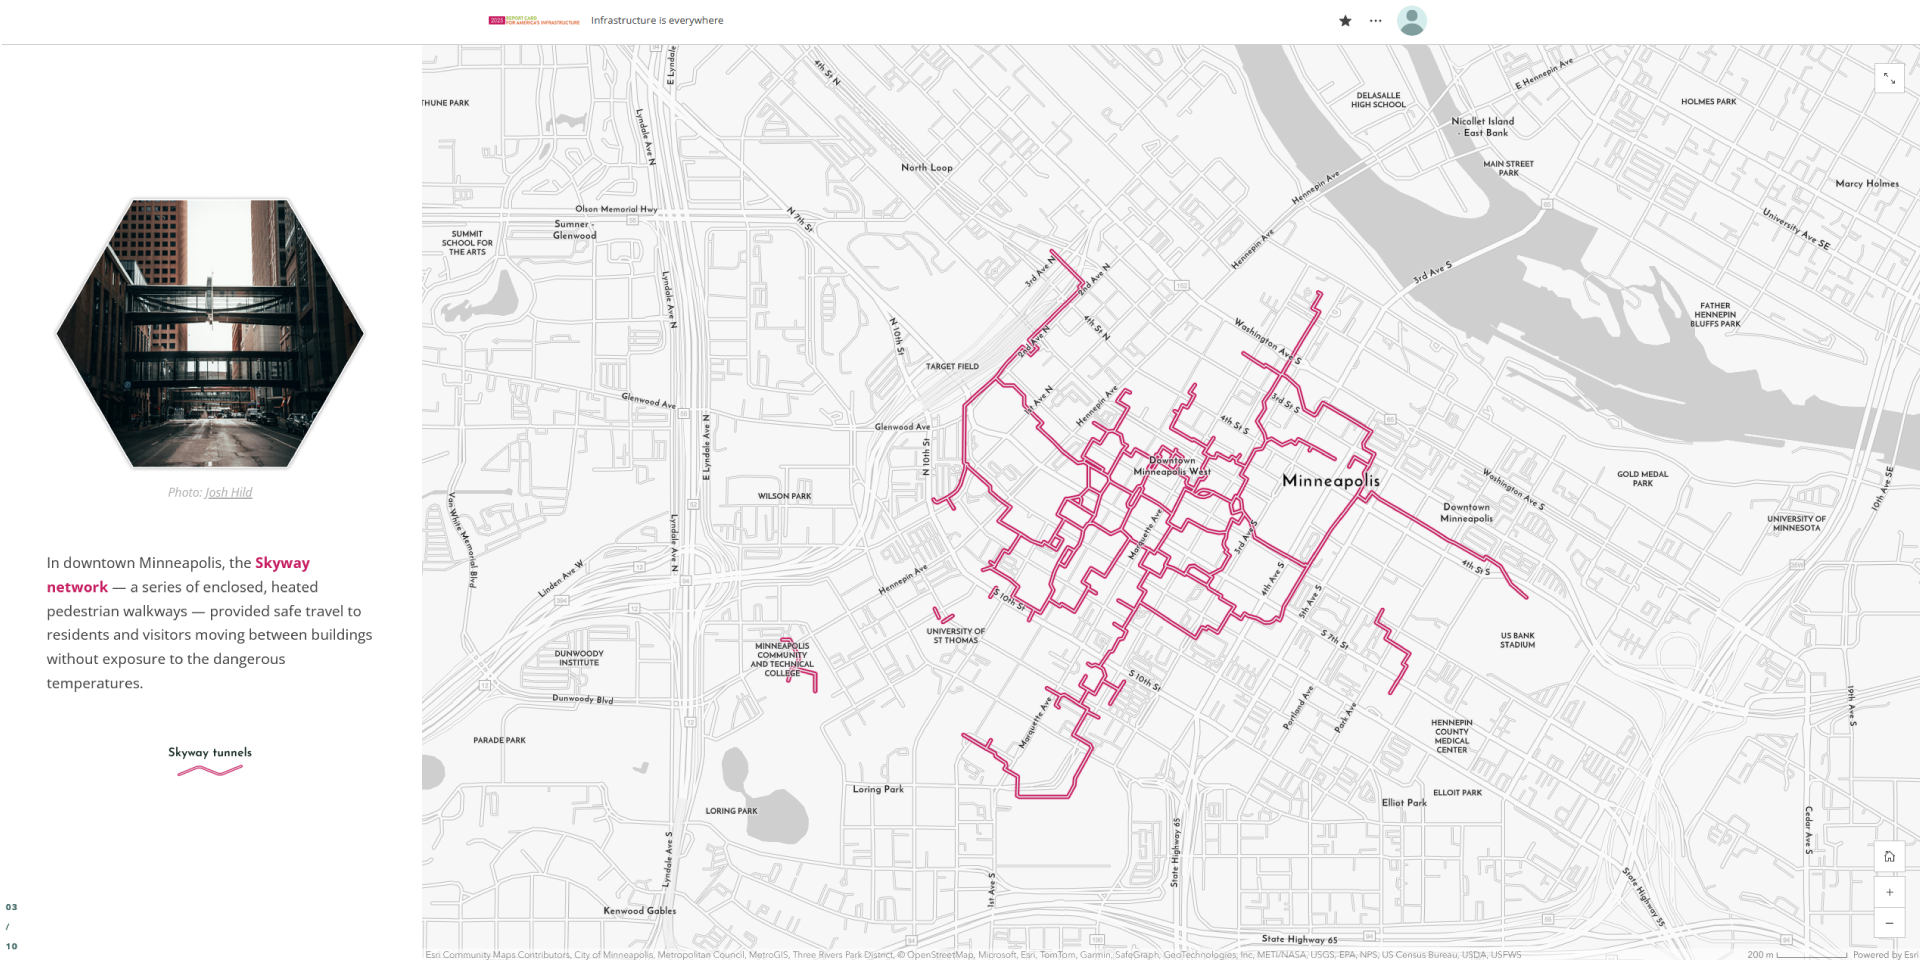
Q. This is the first year you’ve used ArcGIS StoryMaps to showcase infrastructure in America. Can you explain how maps can help tell the story of infrastructure?
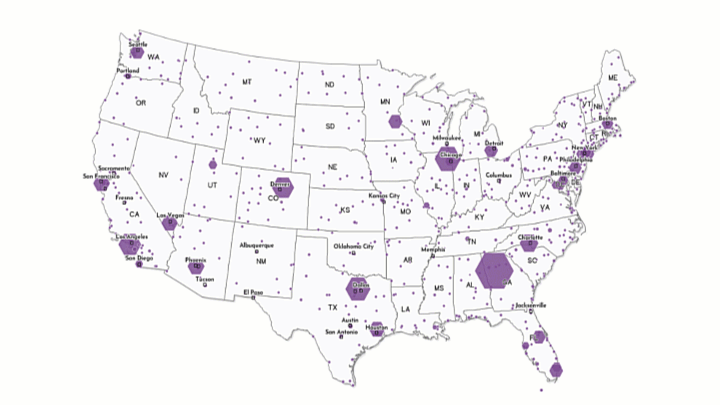
Our infrastructure is vast, and it’s hard for people to understand. When we discuss what the funding needs are and people see an overall funding gap of 3.7 trillion to address all these structures, we really need to help people visualize what we’re talking about. I think ArcGIS StoryMaps can really help us do that.
By showing people how all these infrastructure systems are actually playing a role in their daily lives and how they’re impacting their communities, we can make the case for investing in infrastructure. I also think it really helps show this overall system of systems approach to infrastructure and how it’s all interconnected. ArcGIS StoryMaps helps us visualize these issues and look at infrastructure at multiple scales.
It’s really about making people feel connected to their infrastructure systems so that when we talk about a large investment down the line, they can understand how it impacts their own community.
At ASCE, we try to make it easy for members and the general public to engage on infrastructure issues, and that’s why the National Report Card is structured in a simple A through F format – it’s really a way for the general public to understand it. If we start talking about technical bridge conditions, like decking, people won’t understand that unless they’re engineers. If we say overall, our bridges are graded as a C, people might say that’s not good enough. My child is taking a school bus over that bridge every day, and I want it to be better than a C. Being able to have people understand infrastructure in this simple format helps educate the public and policymakers.
Q. Is there anything else you would like people to know about ASCE or the Infrastructure report card?
We’re coming to a critical point with infrastructure in America. The Infrastructure Investment and Jobs Act expires in September, so Congress is starting to consider how we will invest in infrastructure going forward. We hope this Infrastructure Report Card can help detail where we are and how we’ve seen positive momentum when the federal government chooses to increase investments. However, we’ll need to sustain these investments to continue seeing progress. We must make sure, as a nation, we’re prioritizing the resilience of these systems so that when we’re building them, they will be here for the next 100-plus years to sustain future generations.
Click here to learn more about the 2025 Infrastructure report card
This featured storyteller interview was prepared as a part of the April 2025 Issue of StoryScape℠ | Making the grade.
For more interviews and articles like this one, be sure to check out StoryScape℠, a monthly digital magazine for ArcGIS StoryMaps that explores the world of place-based storytelling — with a new theme every issue.


Article Discussion: