 Summer season is a trying time for electric utilities. Electric utilities have to deal with rolling blackouts and transformer loads as the grid gets stressed. Utilities have programs to handle these load demands. There’s marketing campaigns to get customers to curb electrical usage during the peak hours of high demand. There’s incentive programs customers can sign up for to have the local utility control their high consumption electrical components.
With these programs in place, utilities still want their customers to remain cool and comfortable during the summer months. For many possible reasons, there are usually areas serviced by the utility where keeping cool is a real challenge. Health concerns during excessive heat is one of the biggest challenges. Once again, utilities along with the local regulatory agencies have a solution for this, they open up Cooling Center/Stations. These are usually libraries, fire stations, and community centers that stay open beyond normal operating hours. The ideas is that families can take shelter in these air conditioned facilities during the hottest times of the day.
Most utilities provide a list of these cooling centers for their customers on their website. For example, here is a list of centers for Naperville, IL. and the surrounding area (https://www.dupageco.org/CoolingSites/). With the power of GIS, this data can be geo-enable so that, it can be insightful and discoverable. Using ArcGIS Online, this list can be transformed into a full-fledged engaging app. Now families can quickly identify the closest cooling center and available services. Salt Lake County in Utah did just that and created a very nice cooling center app. Read the article here (http://www.esri.com/esri-news/arcwatch/0616/chilling-with-arcgis-online).
One thing the article did not share is how to create the app. Here are the few steps to set up a similar cooling center app.
The first thing you need to do is create a data schema to house all the cooling center locations. Traditionally this has been done in ArcGIS Desktop and then published up to ArcGIS Online. You’re going to do something a little different that does not require you to use ArcGIS Desktop or having to publish any service. There are organizations that have published cooling centers for their customers so you just need to clone one of their schemas. For this example, you can use Cal EOS’ State Wide Cooling Center feature service as the basis for your data schema. There’s attributes for address, contact, hours of operation, and capacity (http://caloes-msstg.esri.com/arcgis/rest/services/Active_Incident_Heat/Statewide_Cooling_Centers/FeatureServer/0).
To get started, log into your ArcGIS Online Organization account. Once logged in, go to “My Content”. In the drop down menu under “Create”, select “Feature Layer”. You will see a dialog box appear. This lets you create a new feature layer based on an existing template. Select the third tab, “From URL”. Here, copy and paste in the Cal EOS link above. Your dialog should look like the following.
Once you press “Next”, you will see a list of feature layers in this service. It should look like below.
Press “Next” and you can define the extent of the data if you wish. Press “Next” once more and it will bring you to a screen to fill out the name and description of this new feature layer. Name it “Cooling Centers”, then click “Finish”. You should see the newly created feature layer in your list of items under “My Content”.
You can now add the layer to a map and start creating the cooling center features. This article assumes you know how to create a web map, add layers to it, and add/edit data. If you need a refresher for these steps, please read the ArcGIS online help guides (https://doc.arcgis.com/en/arcgis-online/use-maps/edit-features.htm). Also note, since the list of cooling centers for Naperville and surrounding areas is in PDF, you will need to manually locate and digitize the points. You can use the search bar to help you locate the addresses.
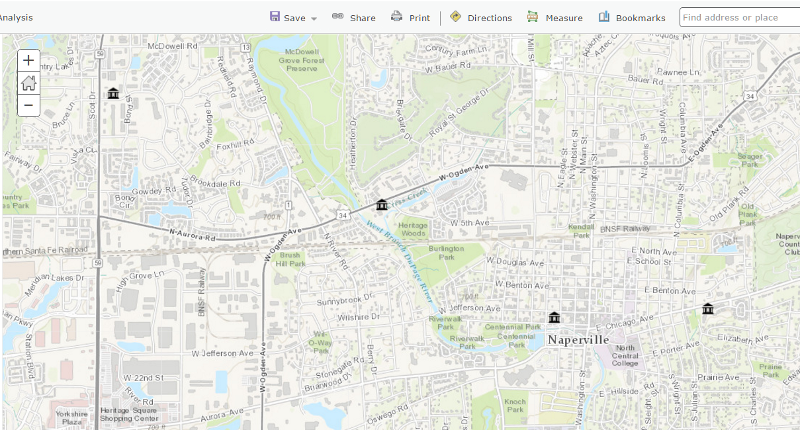
Below is a screen shot of a few of the cooling centers located on the map.
At this point, the data and map has been created. Now, you will use this map to create the actual public facing app for your customers. In the article for Salt Lake County, they used the Local Perspective template (http://www.arcgis.com/home/item.html?id=6e02b538bea841ed858ef9f52709b655) to share this information. That is a very good and focused application. But, in this case, you will use ArcGIS Web AppBuilder instead. The main reasoning for using ArcGIS Web AppBuilder is because it is widget based with new widgets added constantly. In the future, if there is a widget that would enhance the experience for the customers, you can add the widget into the existing application without any interruption to your customers.
To get started, under “My Content”, under the “Create” menu, select “App”, then “using Web AppBuilder”. When a dialog appears, give the app a name and some tags. You will now be brought to the ArcGIS Web AppBuilder configuration screen. Making an app is done in three simple steps.
First step is to define the layout. There’s 8 layouts and wide variety of colors. Choose your preference.
The second step is to pick a web map. In the top bar in the left panel, click on the “Map” tab. Click on the button “Choose Web Map” and select the cooling centers web map you previously created.
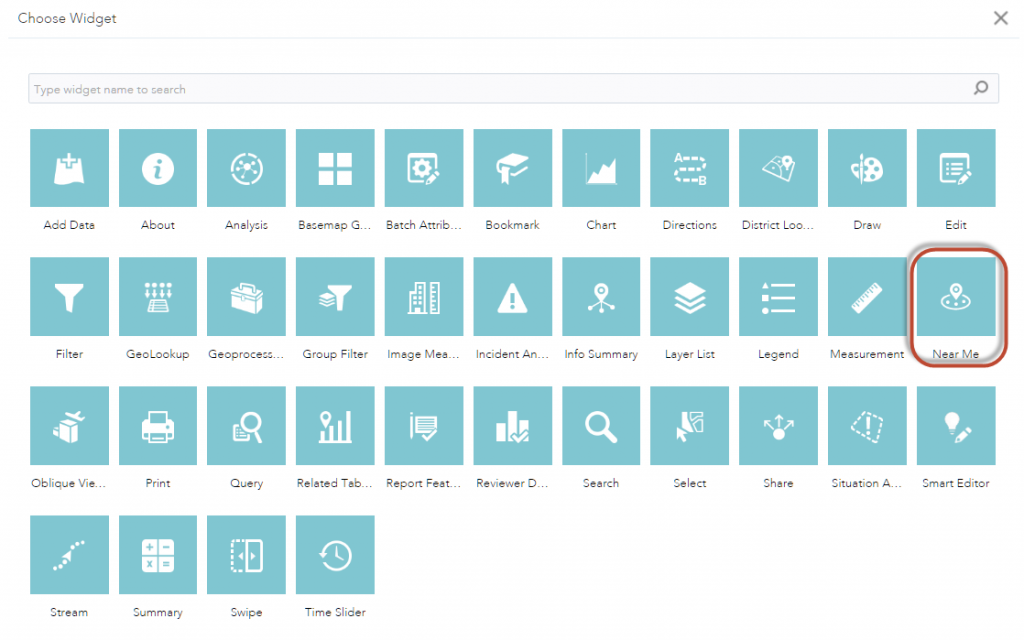
The third and final step is the most involved. Click on the “Widget” tab. Click the section where it states “Set the widgets in this controller”, then click the plus sign “+” in the resulting panel. Once you do this, you will be presented with a dialog full of widgets. The one you want to choose is the “Near Me” widget. This widget performs a similar action as the Local Perspective template. It buffers an address or a point clicked on the map and returns all the features in that buffer sorted by distance away. Read more about the widget here https://doc.arcgis.com/en/web-appbuilder/create-apps/widget-near-me.htm.
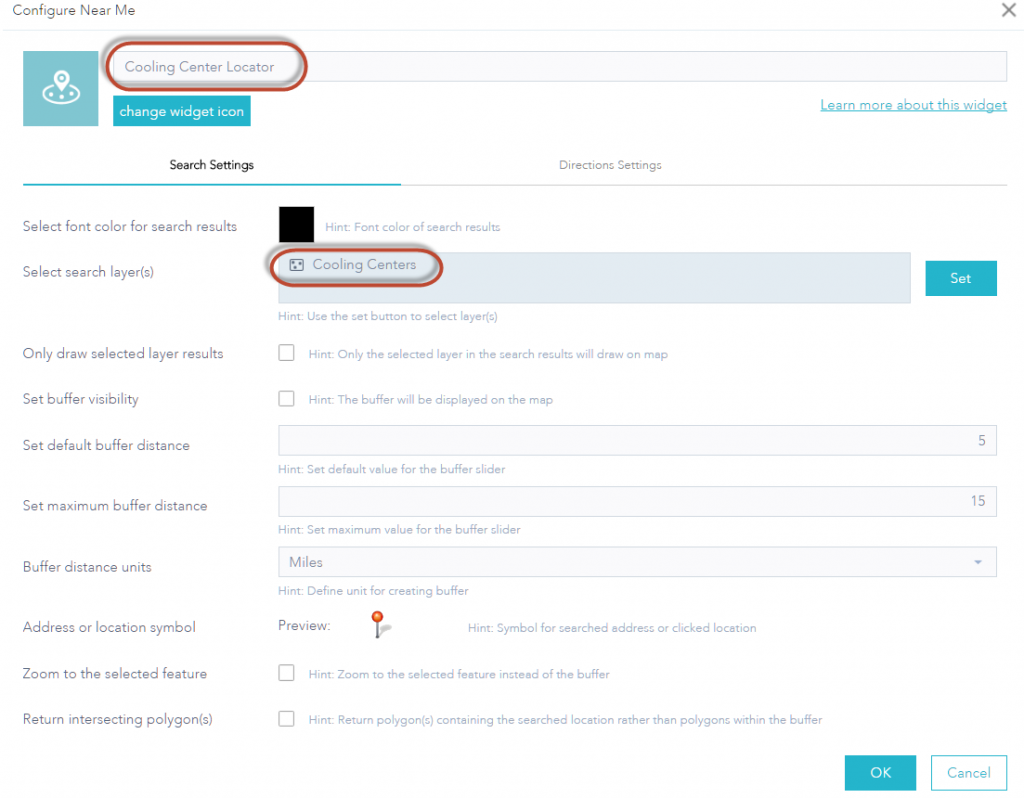
You will now be presented with the configuration panel for the Near Me widget. Most of the items can be left on the default. Change the title of the widget from “Near Me” to “Cooling Center Locator”. Next, you want to set the “Select search layer(s)” parameter. Click the “set” button and choose the cooling centers feature layer. Your configuration screen should look like the following.
Press “OK”. The last thing you want to do is to have this widget open when the application launches. This way your customers can start using the widget as soon as possible without an additional click. In left side panel, hover over the Cooling Center Locator widget. Click the small circle on the bottom left corner.
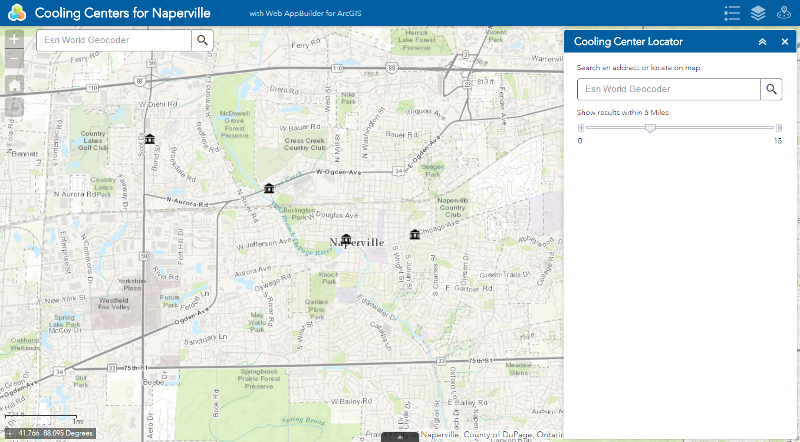
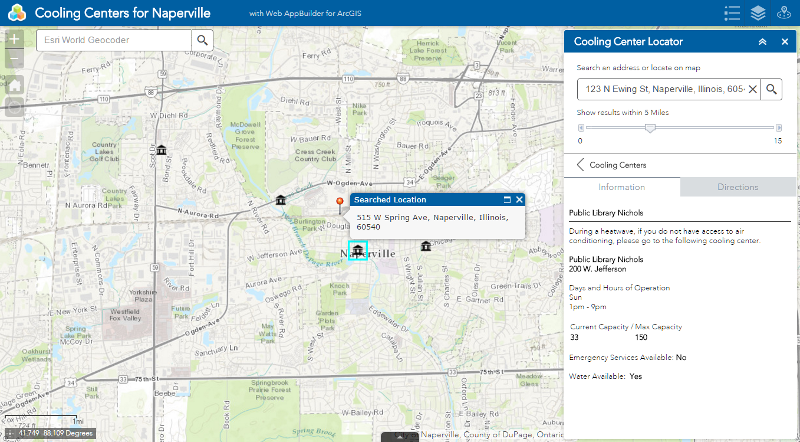
You are all set now. In the left side panel, click the “Save” link to save the application. You are now ready to launch the application. In the left side panel, click the “Launch” link. When the application launches, it should look similar to the image below.
Finally, to test that the application works, type in an address, in our sample for Naperville, use “123 N Ewing St, Naperville, Illinois, 60540” into the widget’s search bar. You should see a pin drop on the map for the address location. You should also see a list of available cooling centers in the widget’s panel. Click on the “Public Library” result. You should see more information about this cooling center.
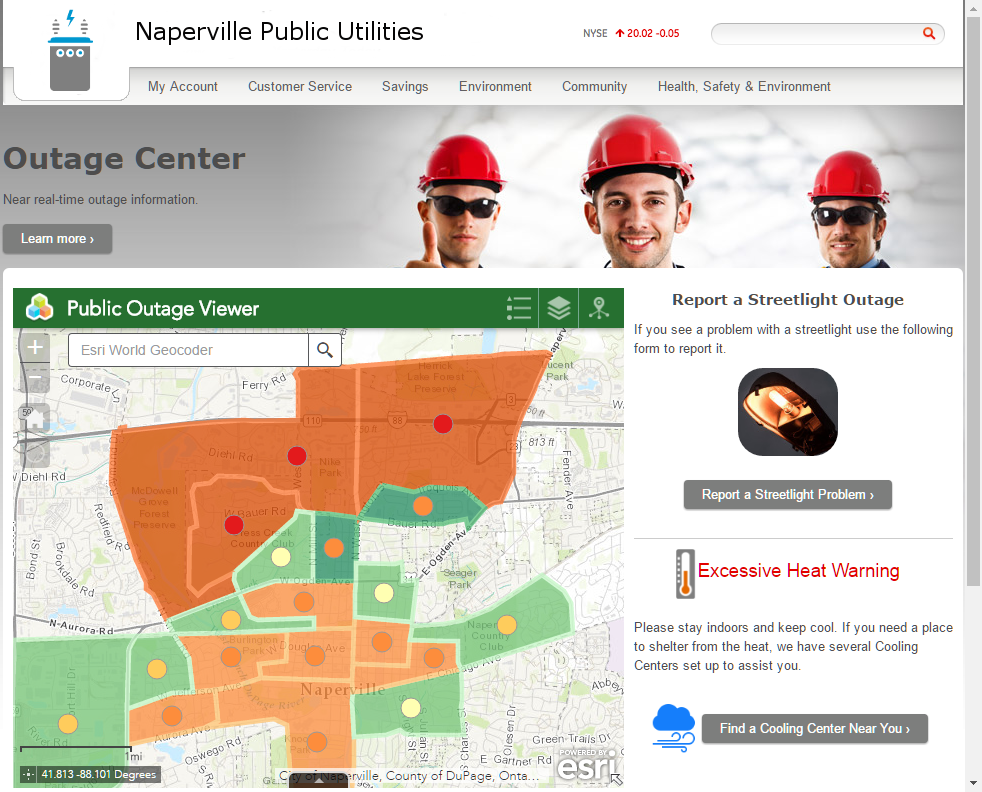
You app is ready and tested. You can now embed this application into your organization’s customer service portal or storm center page. Within minutes you have stood up an application that provides valuable information to your customers without having to write a single line of code. Paired with other customer information or perhaps an outage map, these quick deployments can bring innovation and increase customer satisfaction within your organization. You can transform your centers to look like this.
What more ideas on how ArcGIS can help empower your organization. Check out many of the solutions for Utilities as well as other industries at http://solutions.arcgis.com. Let me know what you think of this solutions in the comments below.



Article Discussion: