In the age of databases and cloud based data storage, many organizations still maintain valuable data in Microsoft Excel and comma-separated value (CSV) files. In this blog post, you will explore a workflow for importing geological data maintained by a mining company in Microsoft Excel and CSV files for use in an ArcGIS Pro project.
The data used in this blog was collected and generated by Mike Price, Entrada/San Juan, Inc. It consists of fictitious sample data, that is true to the underlying geology. Landownership information is imaginary,but reflects exploration trends around Battle Mountain, Nevada, in the early 1990s. Additional source data was derived from the Nevada Bureau of Mines and Geology County mapping series and the US Department of Energy National Uranium Resource Evaluation (NURE) program.
Download and review rock and soil sample data
1. Click Import_Excel_to_Pro and choose Download.
2. Unzip the Import_Excel_to_Pro.zip in a project area on your local machine.
3. Browse to your project area, expand the Battle_Mountain folder, then expand the XLSFiles folder.
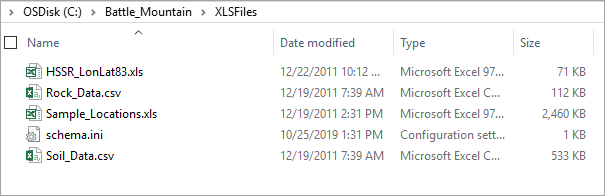
4. Locate and open Sample_Locations.xlsx in Microsoft Excel.
The Sample_Locations workbook contains two worksheets named Rock and Soil.
5. If necessary, click the Rock worksheet, to review the table content.

The Rock worksheet contains sample numbers, coordinates, and field information that will allow this data to be displayed on a map.
6. Click and review the Soil worksheet.

Similar to the Rock worksheet, the Soil worksheet also contains sample numbers, coordinates, and field information.
7. Open and review the Rock_Data.csv file in Microsoft Excel.

Notice that the SAMPLENO field in the CSV files will support a one-to-one tabular join with the same field in the Soil and Rock worksheets.
8. Open and review the Soil_Data.csv file.

Both CSV files were obtained from an assay laboratory and contain results of chemical analysis of rock and soil samples taken at locations in the Battle Mountain area. Values in the tables represent trace elements used in gold exploration and are indicator minerals used to assess the potential for finding viable gold deposits.
9. In the Soil_Data.csv file, inspect the alignment of data in table columns.

Notice that SAMPLENO, AU_PPB and SB_PPM are aligned on the left side of the column. Left alignment generally denotes that a column contain text strings and not numbers that may be used to determine values greater than a specific range.

The AG_PPM, AS_PPM, and HG_PPB columns are aligned on the right. Right alignment identifies a column as containing numeric values.
Update and prepare data in Microsoft Excel
When ArcGIS Pro reads an Excel workbook with worksheets, the first data record in the workbook or file defines the field type. Consequently, for many worksheets, some data preparation is necessary to ensure the data is correctly identified in ArcGIS Pro. The next step will be to prepare the workbook containing rock and soil worksheets and convert and update the CSV files containing assay data before using them in ArcGIS Pro.
Some best practices are as follows:
- Make sure the first row of the worksheet is properly formatted. Field names are derived from the first row in each column of the worksheet in ArcGIS Pro.
-
- Field names must start with a letter.
- Field names must contain only letters, numbers, and underscores.
- Field names must not exceed 64 characters.
-
- Cells with numeric data and dates must be consistently formatted.
-
- Ensure data intended to be numeric is categorized as such.
-
- Field type in ArcGIS is determined by the required Microsoft driver. If a field contains mixed data types, the content is identified as strings.
Before making updates to the worksheet, lets make a copy of the workbook so you can retain the original data as an archive.
1. In Excel, save the workbook to a new workbook named Sample_Locations_ Import.xlsx.
2. In Sample_Locations_Import workbook open the Soil worksheet and review the first row of data containing the column names.
The table contains 20,096 records, representing soil sample points collected in UTM North American Datum 1983 (NAD83) Zone 11 Meters. Coordinates are maintained in the Easting and Northing fields and are displayed using a precision of 0.01 meters. In addition, many samples are coded by Claim Group.

Notice that several column names contain spaces. Recall that field names must contain only letters, numbers, and underscores.
3. In the Soil worksheet, for column names, change the spaces to underscores.

4. In the Soil worksheet, change the Easting column name to UTM83Z11_E.
5. In the Soil worksheet, change the Northing column name to UTM83Z11_N.

6. In Sample_Locations_Import workbook open the Rock worksheet and inspect the data.
7. In the Rock worksheet, review the first row of data containing column names, and then update names by replacing spaces with underscores.
8. In the Rock worksheet, change the Easting column name to UTM83Z11_E and the Northing column name to UTM83Z11_N.

9. Save and close the Sample_Locations_ Import.xlsx
Next, you will edit and format the companion laboratory assay data for the Rock and Soil worksheets.
10. If necessary, open the Rock_Data.csv file in Excel.
11. Save the file as Rock_Data_Import.xlsx so you have the original CSV file and a new copy in Excel.
12. Review the table for improper field names and inappropriate data formats.

The field names appear to be correctly formatted, but a significant number of records are coded with a less than (<) symbol. These records each contain less than the minimum detectable amount of a specific element. Sometimes, a sample contains more than a maximum detectable amount and is coded with a greater than (>) symbol. The over-limit samples in this dataset have already been resolved, so only the less than values need fixing.
13. In Excel, use Find and Replace to find < 0.5 and replace all with 0.1.

14. Use Find and Replace to change all additional values below the detection limit for arsenic, gold, mercury, silver and antimony with values shown in table below.
| Element | Abbr. | Detection Limit | Change From | Change To |
| Silver | Ag | 0.5 ppm | <0.2 | 0.1 |
| Silver | Ag | 0.5 ppm | <0.5 | 0.1 |
| Antimony | Sb | 5.0 ppm | <5 | 1 |
| Arsenic | As | 5.0 ppm | <5 | 1 |
| Gold | Au | 5.0 ppm | <5 | 1 |
| Mercury | Hg | 10.0 ppm | <10 | 2 |
When done, review the table and search for the < and > characters to confirm that all the above and below limit values have been located and updated.
15. In the table, right click the AU_PPB field and select Format Cells.

The Format Cells pane displays. Notice that the field is currently categorized as General.

16. In the Format Cells pane, click Number to change the field category.
17. Change Decimal places to 0, and then click OK.

18. In the same manner, change the field category from General to Number for the AG_PPM, AS_PPM, SB_PPM, and HG_PPB
19. For the SAMPLENO field, change the field category from General to Text.
20. Save and close the Rock_Data_Import.xlsx table.
21. On your own Update Soil Data.
22. Save and close the Soil_Data_Import.xlsx table.
You have completed data preparation of the battle mountain data currently stored and maintained in Excel and CSV files. Next, you will import and use the data in ArcGIS Pro.
Use Excel files in ArcGIS Pro
Microsoft Office Excel tables may be used directly in ArcGIS Pro and you can work with them in the same way as other tabular data sources. For example, you can add them to the map, open them in the fields view, and use them as inputs to geoprocessing tools. However, to work with Excel files in the current release of ArcGIS Pro, you must download and install the ‘Microsoft Access Database Engine 2016 Redistributable’ from the Microsoft Download Center.
Please verify the Microsoft Access Database Engine 2016 is successfully installed and operational before continuing.
Review the help topic Install the Microsoft Access Database Engine driver for updated instructions.
1. Launch ArcGIS Pro.
2. For New, select Map.
3. In the Create a New Project pane, for Name, type BattleMountain.
4. For Location, browse and select your Battle_Mountain folder.
5. Click OK.

6. In the Catalog pane, click and expand Folders.
7. Right-click Folders and select Add Folder Connection.

8. In the Add Folder Connection pane, browse and add a connection to the Battle_Mountain\XLSFiles folder.
9. Click OK.

10. In the Catalog pane, under Folders, expand XLSFiles.
11. Review the folder contents.

12. Click and expand Sample_Locations_Import.xlsx.

In the expanded multi-sheet workbook, worksheets display with a dollar sign ($) at the end of the name.
13. Right-click Rock$ and select Add To Current Map.

14. In the Contents pane, under Standalone Tables, right-click Rock$ and select Display XY Data.

15. In the XY Table To Point geoprocessing tool, update the following parameters:
-
- For Input Table, select Rock$.
- For Output Feature Class, type RockSampleLocations.
- For X Field, choose UTM83Z11_E.
- For Y Field, choose UTM83Z11_N.
- For Coordinate System, specify NAD_1983_UTM_Zone_11N.

16. Click Run.
The tool creates a new feature class named RockSampleLocations in the project geodatabase and adds the feature class as a layer to the map displaying rock sample location points in the Battle Mountain Nevada region.

17. In the Contents pane, right-click RockSampleLocations and select Attribute Table.

The layer attribute table displays. Note the layer field names derived from the original column names in the excel table. You will use the Sample_Number field to join the laboratory assay data from the Rock_Data table.

18. Close the RockSampleLocations table.
19. In the Catalog pane, under Folders, expand Rock_Data_Import.xlsx.
20. Right-click Rock_Data$ and select Add To Current Map.

21. In the Contents pane, under Standalone Tables, right-click Rock_Data$ and select Open.

22. In the Rock_Data$ table, right-click the SAMPLENO field and select Fields to display a fields view of the table.

23. Review the Fields: Rock_Data$ view.
Notice the field data types, these types are the same as the categories you assigned to columns in Excel.

24. Close the Rock_Data$ table and the Fields view.
Next you will join the Rock_Data table records to the Rock Sample locations for analysis and display.
Join assay data and symbolize gold values
1. In the Contents pane, right-click RockSampleLocations and select Joins and Relates, and then choose Add Join.

2. In the Add Join geoprocessing tool, update the following parameters:
-
- For Layer Name or Table View, select RockSampleLocations.
- For Input Join Field, select Sample_Number.
- For Join Table, select Rock_Data$.
- For Output Join Field, select SAMPLENO.

3. Click Run.
4. In the Contents pane, right-click RockSampleLocations and select Attribute Table.
5. Review the RockSampleLocations attribute table. Scroll to the right to display the joined fields.

6. Close the RockSampleLocations table when done.
7. In the Contents pane, right-click RockSampleLocations and select Symbology.
8. In the Symbology pane, for Primary symbology, choose Graduated Colors.

9. In the Symbology pane, update the following:
-
- For Field, select AU_PPB.
- For Color Scheme, choose yellow to red

The map updates to display rock sample locations with graduated colors representing parts per billion of gold detected in samples.

10. Review the map and note the location of several samples displaying a high value for gold. You can confirm these locations by selecting the points and reviewing the AU_PPB field values in the layer table.

11. On your own, Display soil samples with assay information.
12. When you have completed all steps, save the project
Congratulations, you have now successfully imported several Excel tables to generate new geodatabase feature classes and joined assay data to the points for visualization.

Commenting is not enabled for this article.