Why do you make maps? There are lots of good reasons. One of them is to explore and discover. We often read maps as a form of armchair travel. Making maps can be an even deeper version of this pursuit.
Sometimes we set out on a map-making project that looks like it will be a lot of fun, only to find ourselves, several days later, still wading through massive amounts of seemingly irrelevant data. Then we give up. This blog is here to tell you not to give up!
Most of cartography is deciding what not to map. So don’t be surprised when this particular decision takes a lot of time. This is where the real exploration and discovery happens, not when you’re choosing symbology. This the part of the process where you learn about the place or topic you are mapping.
Why read this blog?
- You want a more efficient strategy for thinning all of that data you just downloaded.
- You’re about to begin a cartography project and want to start off on the right foot.
- You think ice roads and arctic diamond mines are cool. This post is the first in a series I am writing about the making of this map.
What do you need?
I use ArcGIS Pro. This workflow is relevant for ArcMap too, only the details differ.
Step 1: Where do you want to map?
Pick a place you love, a place you want to know more about, a place with a weird name. If you just want to follow along with my map for now, you can download and unzip this project, and double click IceRoad.aprx to open it in ArcGIS Pro.
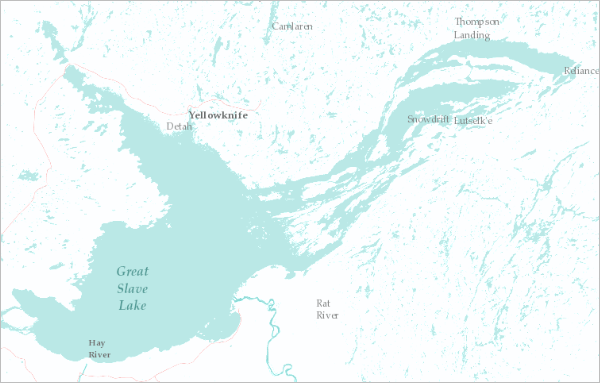
I wanted to make a map of Great Slave Lake in Canada. It has such a nice shape.
Step 2: Get some data
If you also happen to be mapping somewhere in Canada, you’re in luck, because the government (Natural Resources Canada, Earth Sciences Sector) provides this fantastic resource for finding and downloading data.
From the Themes tab, click Vector, then click one of the listed datasets, for example CanVec Series – Hydrographic features.
Then click a province or territory on the interactive map to find data in shapefile or file geodatabase format.
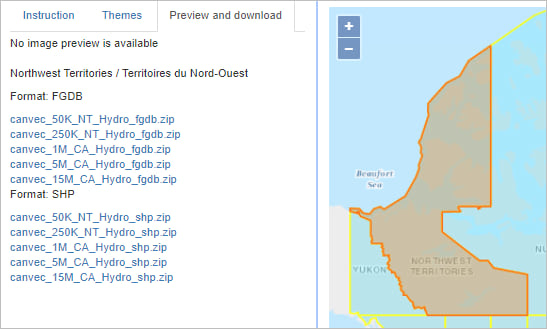
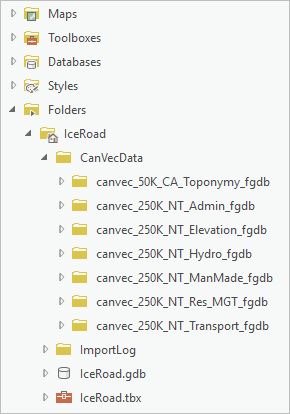
You’re still in exploratory mode, so download lots. I grabbed pretty much everything for the Northwest Territories. If you’re following along with the project I provided above you can find all of this data in the CanVecData folder in the Catalog pane.
Step 3: Explore
Add your newfound data to the map. Unfortunately, looking at so much data at once, even for such a sparsely populated area, can be completely overwhelming.
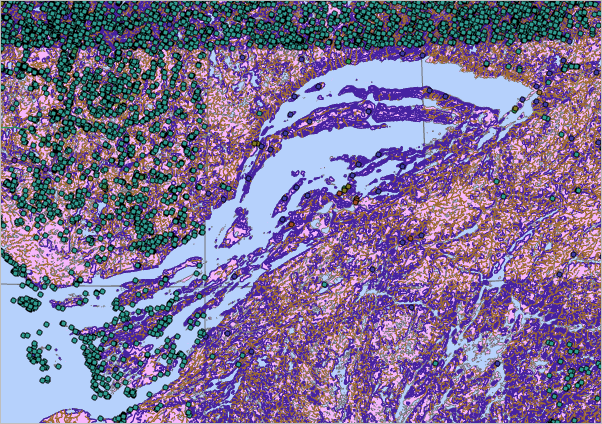
You’re going to have to spend some time sorting through these layers before you can figure out which ones are interesting, relevant, or useful.
- Only look at a few layers at a time.
- Check out the metadata that was included in the download.
- Begin discarding layers that you don’t want.
- Compare the data to various basemaps.
- Explore the numeric attributes by creating charts or by symbolizing layers with graduated colors.
All the while, keep your eyes open for interesting patterns, unusual absences, and unexpected clusters or outliers. Ask questions and search for answers.
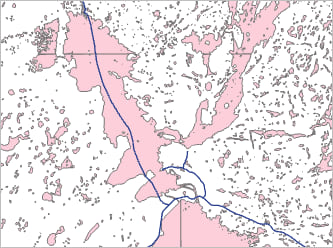
The most interesting thing I found was a road going straight through a lake!
Step 4: Choose a theme
I immediately abandoned the plan to map Great Slave Lake, and decided to instead map the Tibbitt to Contwoyto Winter Road. I didn’t know anything about it yet, but that’s part of the fun of mapping.
Step 5: Choose a projection
You can’t pick an extent until you’ve first picked a projection. You can set this in Map Properties > Coordinate Systems. If you’re following along with my provided project, the map is already set with a custom projection. Switch to the Step 5 map to see it. You can learn how to make your own custom projection with the next blog in this series.
Step 6: Choose an extent
If you don’t have a good reason to rotate a map, don’t rotate it, it will only confuse people. But this time I felt like I had a good reason. Even though this is a static map, most people will view it on a computer or phone. That means they will start at the top and scroll down. I wanted them to experience the road in the same order as its truck drivers: starting in the south.
In Pro you can use the keyboard shortcuts A and D to rotate the map. You can also set rotation on the Map Properties > General window. I settled on -155.35°.
Next, draw a rectangle around the area you want to map. You can add a rectangle quickly by using the Polygon Map Notes option on the Insert tab on the ribbon.

On the ribbon, on the Edit tab, click the Create button to launch the Create Features pane. Choose Polygon Notes and draw a new rectangle on the map.
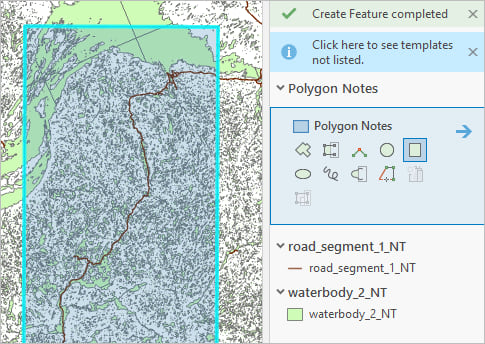
You can also turn on the mapExtent layer in the Contents pane to see the rectangle I made.
Step 7: Remove data
You’ve already removed some data, but you still have too much.
In the Contents pane, click the List by Selection tab. On the map, draw a selection rectangle that is just a bit larger than your map extent rectangle. The Contents pane will show you a count of selected features for each layer. Some layers don’t have a single feature in that area. These can be removed without any further investigation.

For all the others, ask yourself these two important questions:
- Does it make sense to show this layer at this scale?
- Is this layer absolutely necessary for your theme?
The answer is probably no. Research your theme. Then remove almost all of the layers. In the end, I only kept waterbodies, toponyms (place names), road segments, and ore. Why ore? It turns out that the main purpose of the Tibbitt to Contwoyto road is to service diamond and gold mines, and this layer corresponded with some of those sites. The locations of mines not included in the dataset were researched and located on the imagery basemap.
You can find my chosen layers in the chosenData feature dataset in the provided IceRoad.gdb.
Step 8: Do you need more data?
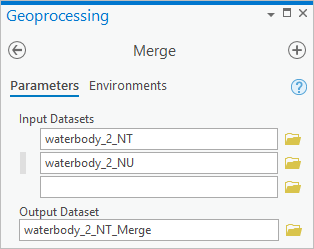
Did you notice the white space at the bottom of my map? That’s because I only downloaded data for the Northwest Territories, and the winter road extends into Nunavut as well. I had to go and download even more data. If this happens to you, use the Merge tool to combine like datasets.
Step 9: Clip data to the map extent
You still have too much data.
Use the Buffer tool to make a copy of your map extent rectangle that is a bit bigger.
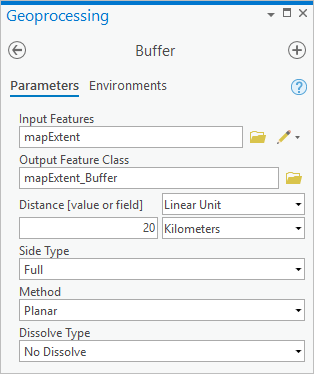
Then use the Clip tool to trim all of your remaining datasets to the new buffered rectangle. You could clip to the original rectangle instead if you want, but the buffer provides you with some wiggle room that you might want later on.
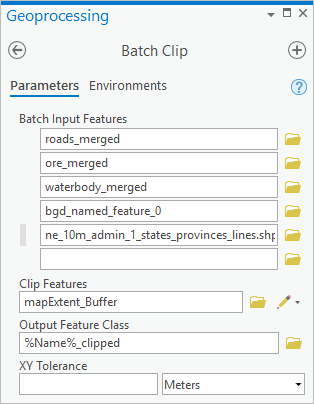
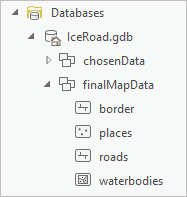
Save all of your final outputs to your project’s geodatabase and rename them so they are easy to find later. You can find mine in the finalMapData feature dataset inside IceRoad.gdb.
Step 10: Add metadata
This is an eat-your-vegetables/brush-your-teeth kind of step. It’s good for you. You’ll thank me when you’re older. Like two months from now when you need to share or reuse your map in some way and you realize you have no recollection of where the data came from or what it represents. It will also help you find final or authoritative datasets amongst a crowd of intermediate or exploratory ones that you may have neglected to delete.
Open the geodatabase on the Catalog pane. Right-click on each feature class and choose Edit Metadata.
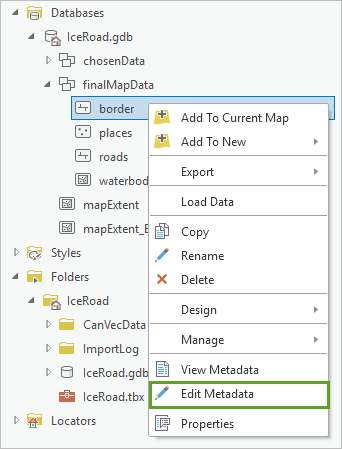
You must do this through the Catalog pane. If you right-click on the layer in the Contents pane and try to change the metadata there, it won’t stick. That metadata is for the layer, which is not the same as the data. The layer is just a view, or instance, of the data.
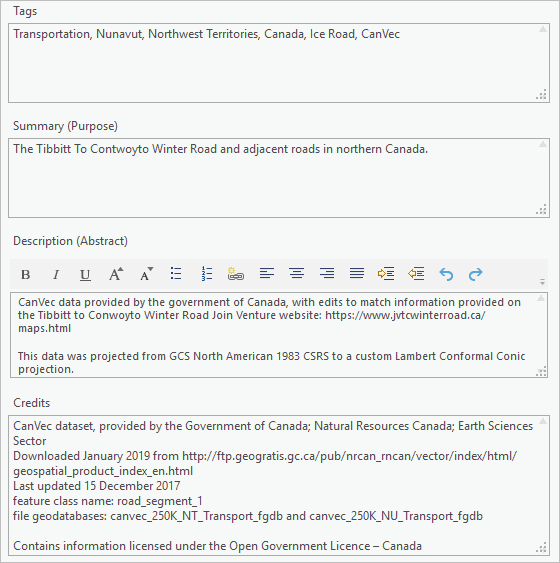
Fill out everything you know about your data.
Summary
And that’s it. Your project is prepped. You downloaded a ton of data and explored it. Along the way you discovered some interesting things, did some research, and learned about diamond mining (or whatever your topic may be.) You shaved off more and more of your data until you were left with only the stuff you really needed. You added some more data to fill gaps, and put it all in a nice safe place with neat and tidy labels. The rest of your cartography project is going to be a breeze.
Attributions: Data provided by the Government of Canada; Natural Resources Canada; Earth Sciences Sector. Contains information licensed under the Open Government Licence – Canada


Commenting is not enabled for this article.