As summer wraps up, I’ve been thinking a lot about outdoor adventures to national parks. So far this year I’ve only made it to one: Acadia National Park in Maine.
Thinking about it some more I realized I’d been to a lot more National Park Service lands this year if I expanded it to more than national parks. The Appalachian National Scenic Trail, Catoctin Mountain Park, and Assateague Island National Seashore, to name a few. And of course, the many I am surrounded by living in Washington, D.C.
I began wondering: which National Park Service (NPS) lands are the most popular?

When people think about National Park Service (NPS) lands they often think of national parks like Yellowstone and Yosemite, but the NPS also manages numerous parkways, battlefields, seashores and more.
To answer this question I needed a tool to visualize multiple variables at once, so I used the recently added “quantity by category” functionality in ArcGIS Pro 3.3.
Mappers can now combine multiple visualization techniques using unique values symbology. This feature was requested by our users on Esri Community as many missed the “quantity by category” symbology option available in ArcMap.
This functionality provides a way to visualize the same dataset in multiple ways. Maybe that is color and symbol size, color and symbol rotation, etc.
First I got data from the NPS Stats website. I used the Query Builder for Public Use Statistics to get visitation data by unit for all of 2023. Using unique values symbology, I visualized different land types by color and used size to communicate the number of visitors.
Applying the symbology
To start, I categorized my symbols by NPS land type (parks, battlefields, etc.). I used Unique Values as my primary symbology and selected different colors for different land types (orange for parkways, blue for water areas, etc.).

Next, I varied my symbology by the number of total visitors in 2023 to each park using symbol size. This allowed me to adjust the range of symbol sizes to help the most visited parks really stand out on the map.

With NPS land type categorized by color, and the number of visitors represented by symbol size, I could begin creating a layout, adding other areas of interest, and experimenting with styles.

Design inspiration
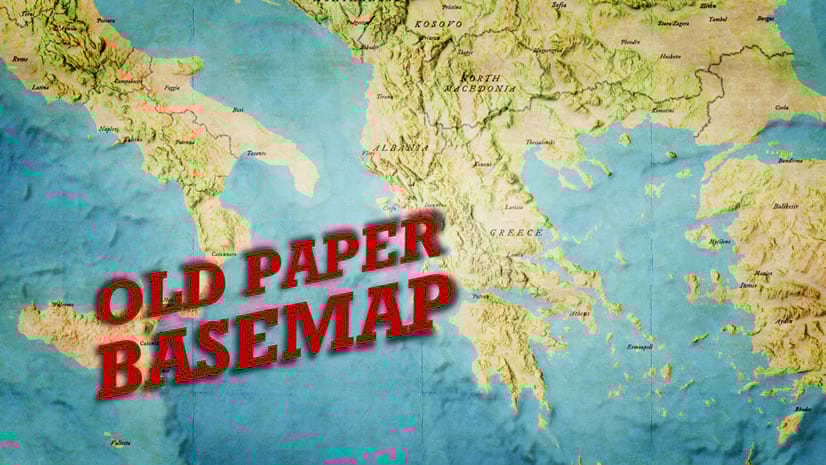
When designing a map, it can be helpful to look for inspiration in the world around you. Maybe that’s art in a museum or on social media, or maybe it’s maps from the past. For this project I looked at the David Rumsey Map Collection for design ideas. I found this Glacier National Park aeroplane map from 1910 that inspired the colors, fonts, and texture.

I used blues, oranges, tans, and greens like those on the 1910 brochure. I applied a Living Atlas texture tile suggested by John Nelson, a fellow cartographer. I also chose a font that was similar to the one used on the brochure.
Consolidating the legend
There are MANY land types managed by the National Park Service, which cartographically can mean A LOT of color decisions. To minimize the number of colors I grouped together several land types based on similarities.

I chose to visually group together things like water features, battlefields, etc. This could be divided and grouped in a variety of ways, depending on the goal or focus of the map.
Applying some layer effects
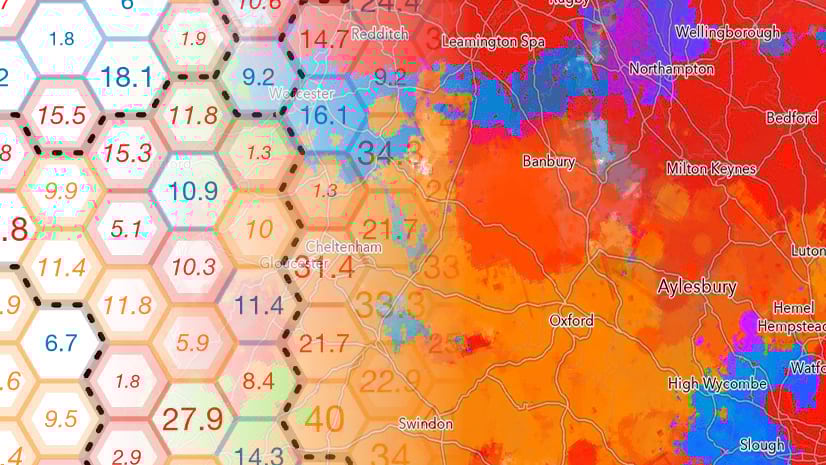
I applied an additional stroke to state boundaries and coastlines and transparency with blend modes to give a subtle ‘glow’ effect to soften some of the hard edges of the map.

I was really happy with the results I could achieve using the new “quantity by category” capability in ArcGIS Pro 3.3. Want to try the same thing in a web map? Check out “types and size” symbology in ArcGIS Map Viewer.
Below are some close-ups of the final map design. I’d love to see other examples. Please feel free to reach out and share your maps on X or LinkedIn!
Meanwhile I’ll be making my list of NPS lands to visit this fall!


Article Discussion: