Earlier this fall, as part of my birthday weekend celebration, I dragged a group of friends (and our dogs) to Duffield, Virginia to hike to the Devil’s Bathtub. While the hike wasn’t particularly challenging, the actual bathtub was a spectacular natural feature. It truly did seem like someone in desperate need of a relaxing bath had carved it out of the ground – and that someone could very well have been the Devil for all we knew.
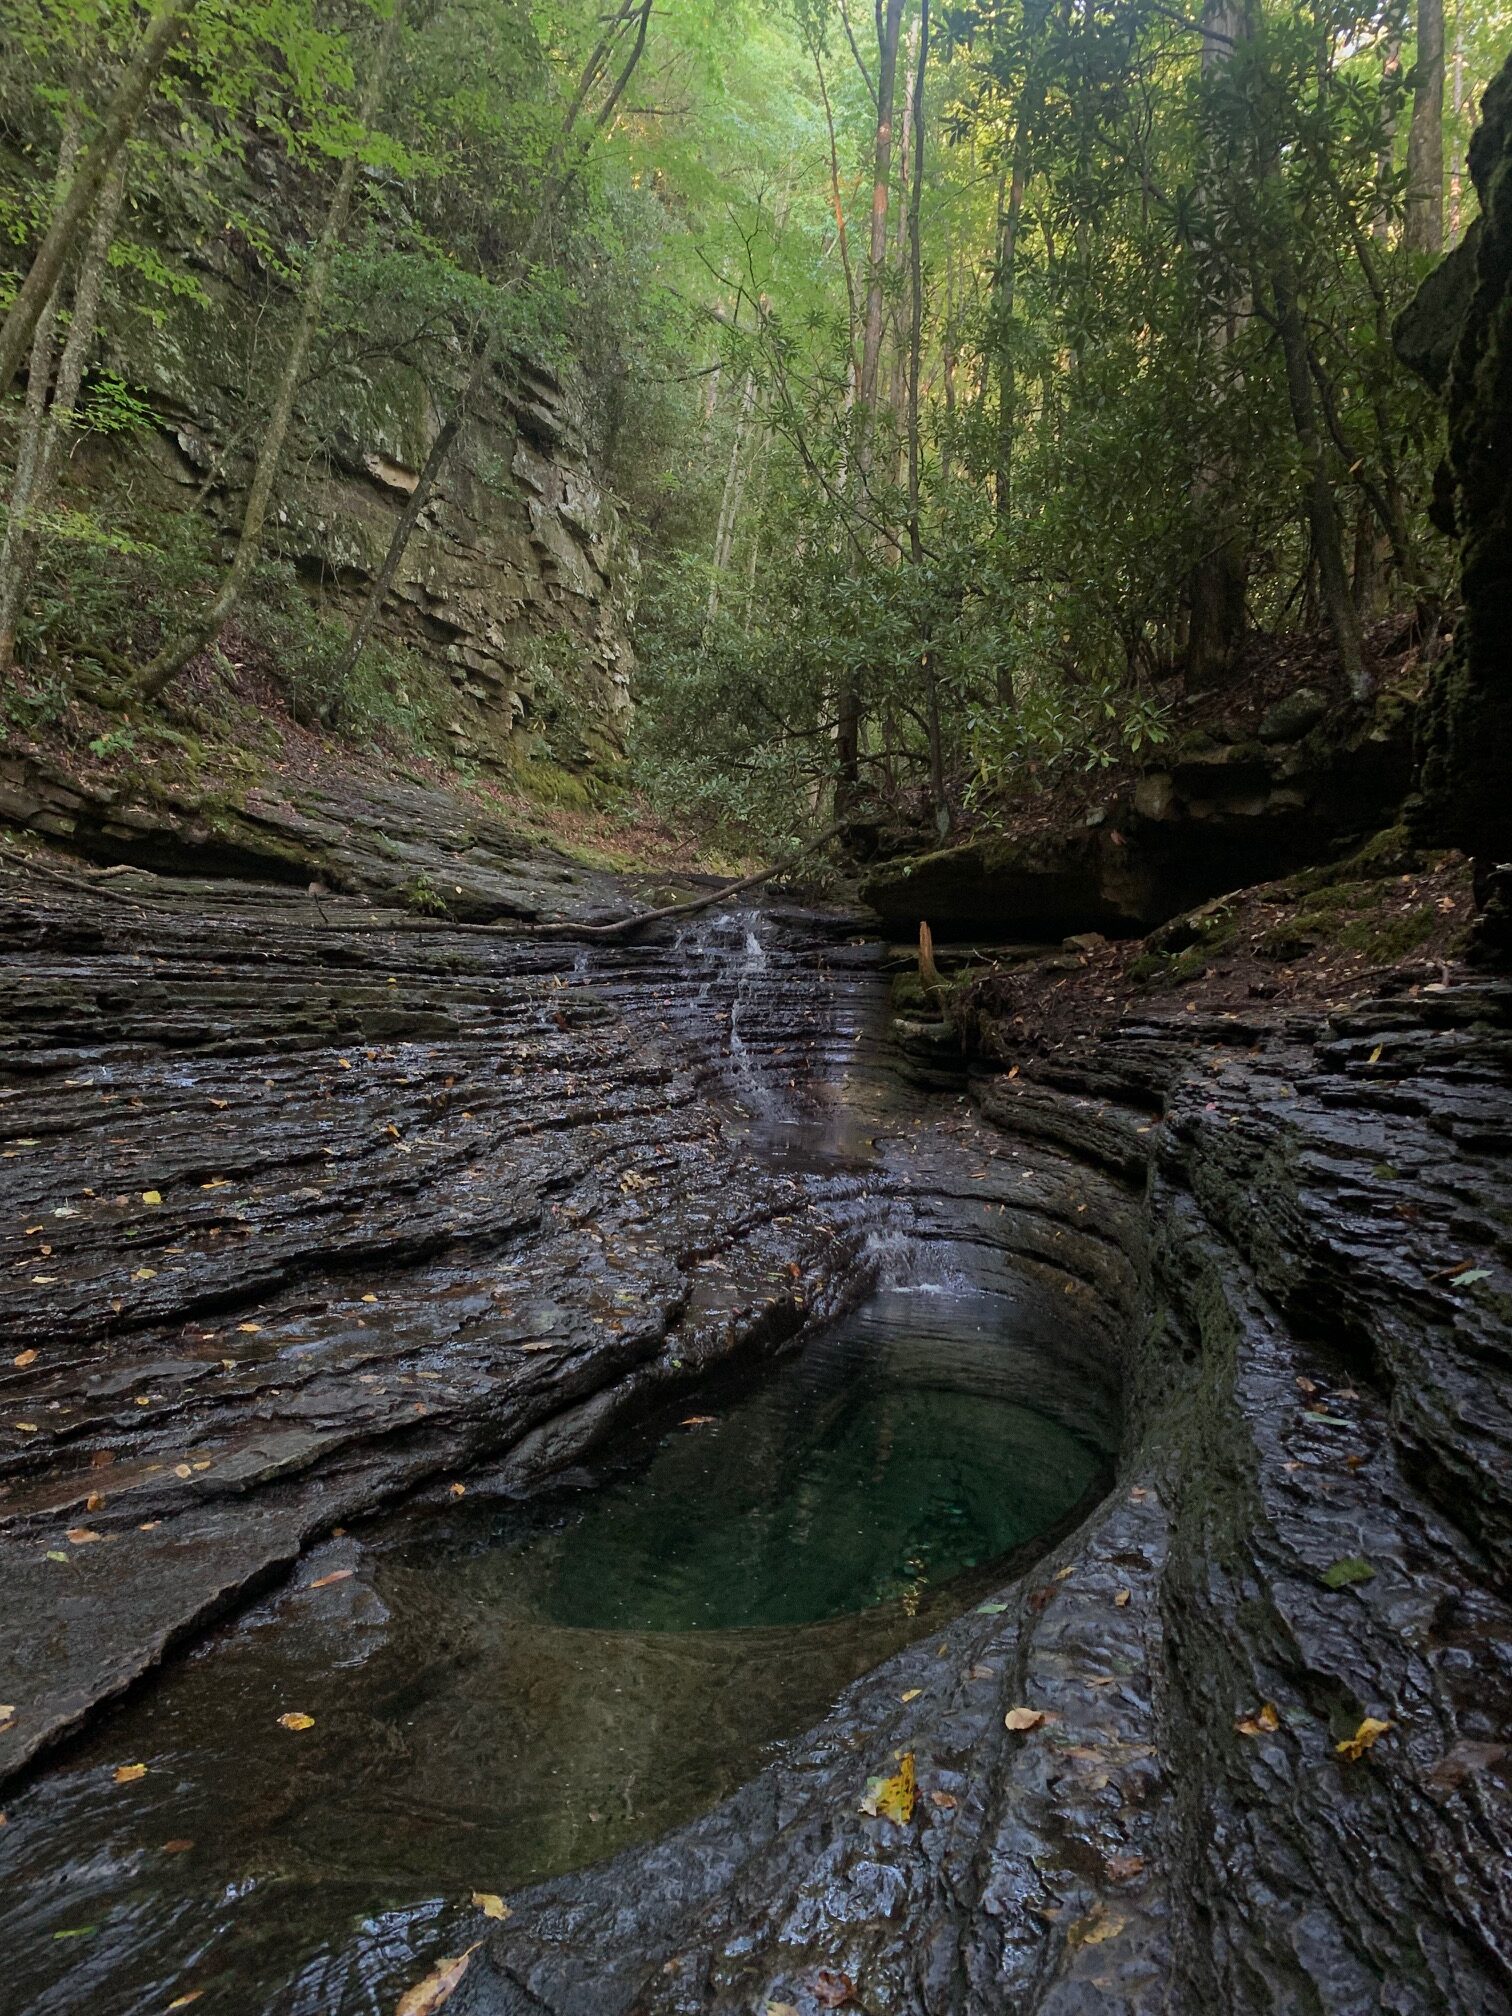
By the time I got back home and recovered internet access, I couldn’t stop thinking about how many other amazing spots like the one we had just seen were out there. A cursory search confirmed that this “bathtub” wasn’t an outlier; geographic oddities like this one are commonly attributed as belonging to the Devil.
We often hear about location, location, location when it comes to investing in real estate. But what about the gorgeous spots in the middle of nowhere? The ones that are hard to believe exist without some form of human or supernatural intervention? And so, with that in mind, I set out to map the Devil’s real estate portfolio.
Collecting Data Points
To perhaps nobody’s surprise, I couldn’t find an existing dataset with the locations of all places called “Devil’s ______” so instead I set out to build my own. A query in the USGS’s Geographic Names Information System returned 1356 locations and while I would have loved to map all of them, I opted for what I’ll call my top 50 spots.
The list grew organically from places I had heard about in the past from friends or places that otherwise caught my eye while doing research for this map. I tried to group them into themes as much as I could but inevitably ended up with an “others” category.
Calculate Color Theorem Field
As I started envisioning my Layout, it quickly became apparent that I would need a way for the viewer to connect the legend item to the map itself. I was hesitant to use a different color for each of the 50 points or, for that matter, the 48 states of the continental U.S. Instead, I opted to use the Calculate Color Theorem Field tool. This is a new tool in the Cartographic Refinement toolset available with ArcGIS Pro 3.4 which populates a field that can be used to symbolize polygons so that no two adjacent polygons are the same color using a small number of colors.
The tool asks for only 2-parameters: Input Features and Field Name (which can be an existing field or a new one to be created). We can then use this field to inform our Unique Values primary symbology.
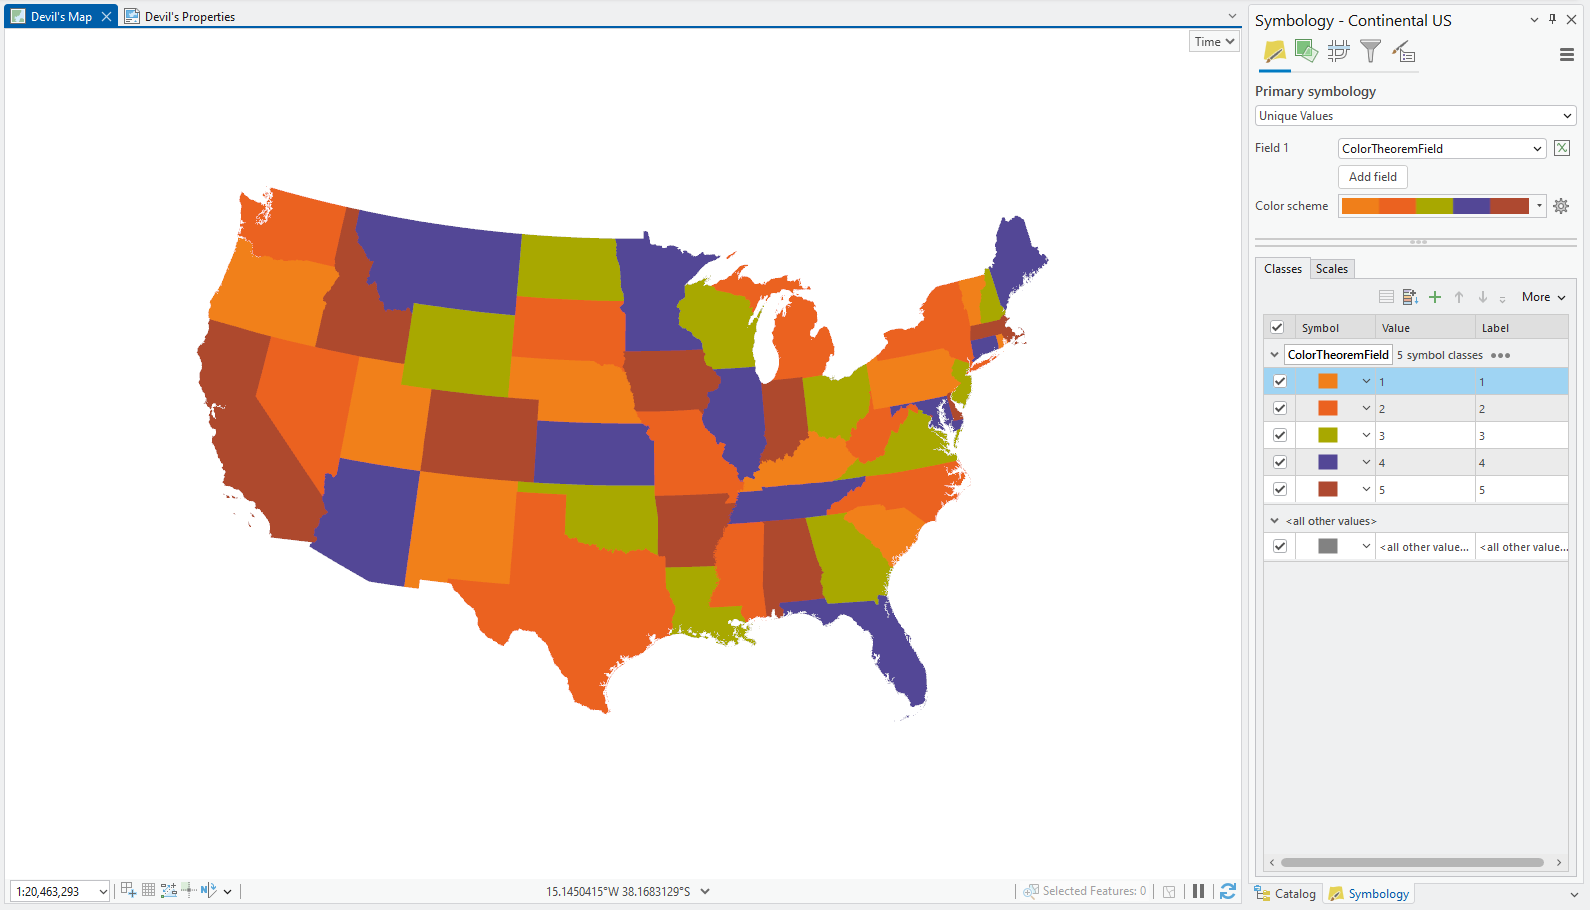
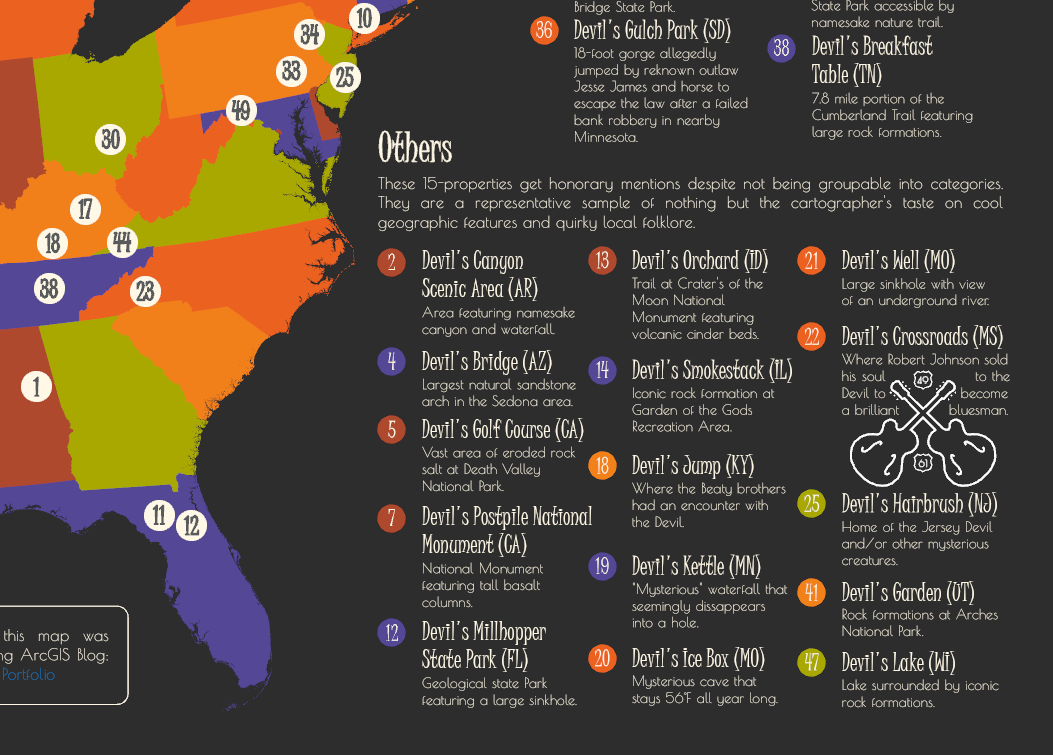
As I built my legend, I went on to match the color of the marker to the color of the corresponding state (i.e. maroon for #2 and Arkansas, purple for #4 and Arizona, etc). This makes it easier to identify where the point is located as it narrows down what the viewer is looking for to only 5 colors.
Spooky Color Scheme
One of the first things I like to do when I’m working on a new map is define my color scheme. I wanted to give this map a Halloweeny feel without falling into the traditional black and orange we see everywhere. That being said, I did start with a pumpkin orange tone (# EB6123) and went up to a maroon (# AE4832) and down to a lighter tangerine (# EF7E1E). I wanted the remaining two colors to pop and so I went for a bright green (# A8A800) and purple (#534696) that reminded me of a witch costume I wore as a kid one year.
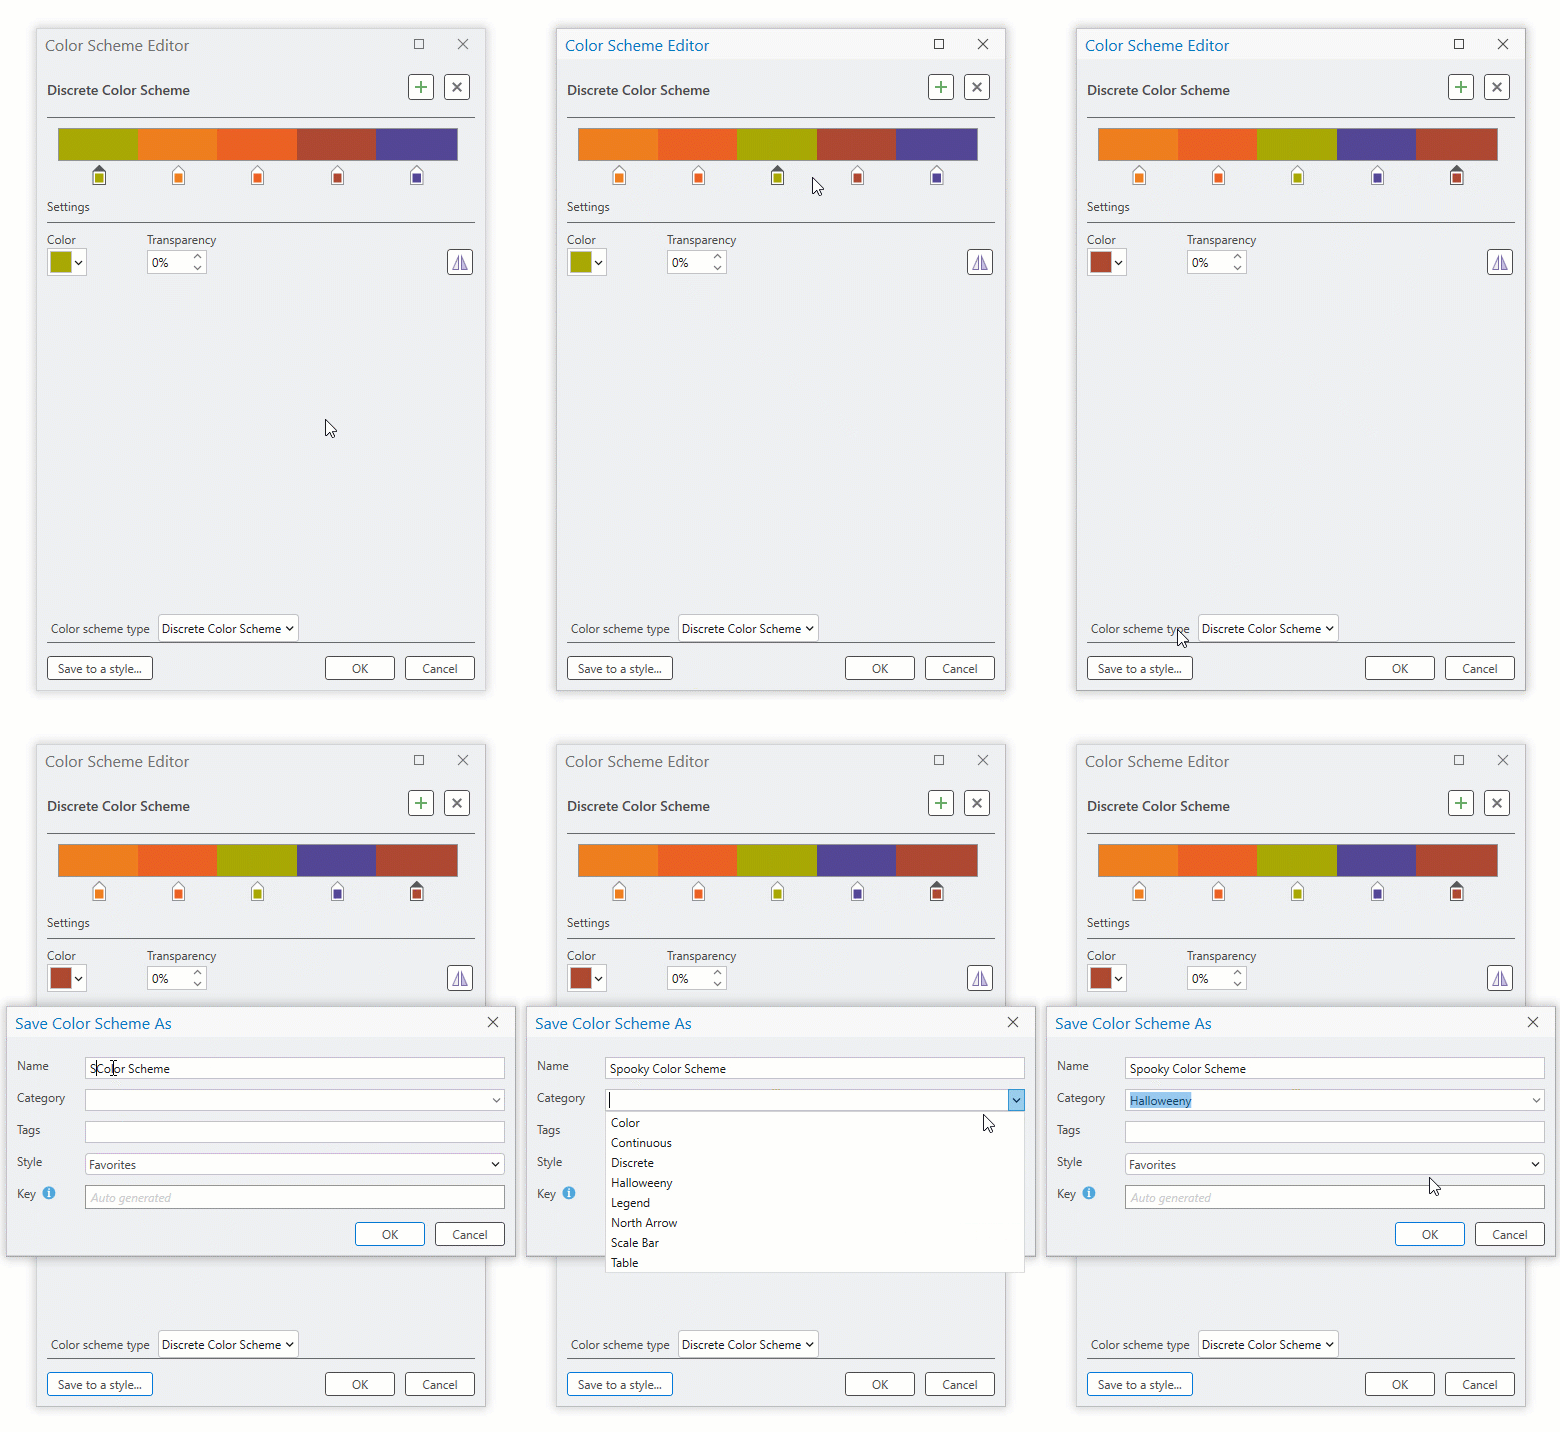
Once I had chosen my colors, I used the Color Scheme Editor to look at the different ways my map would look depending on what color corresponded to each Color Theorem Field value.
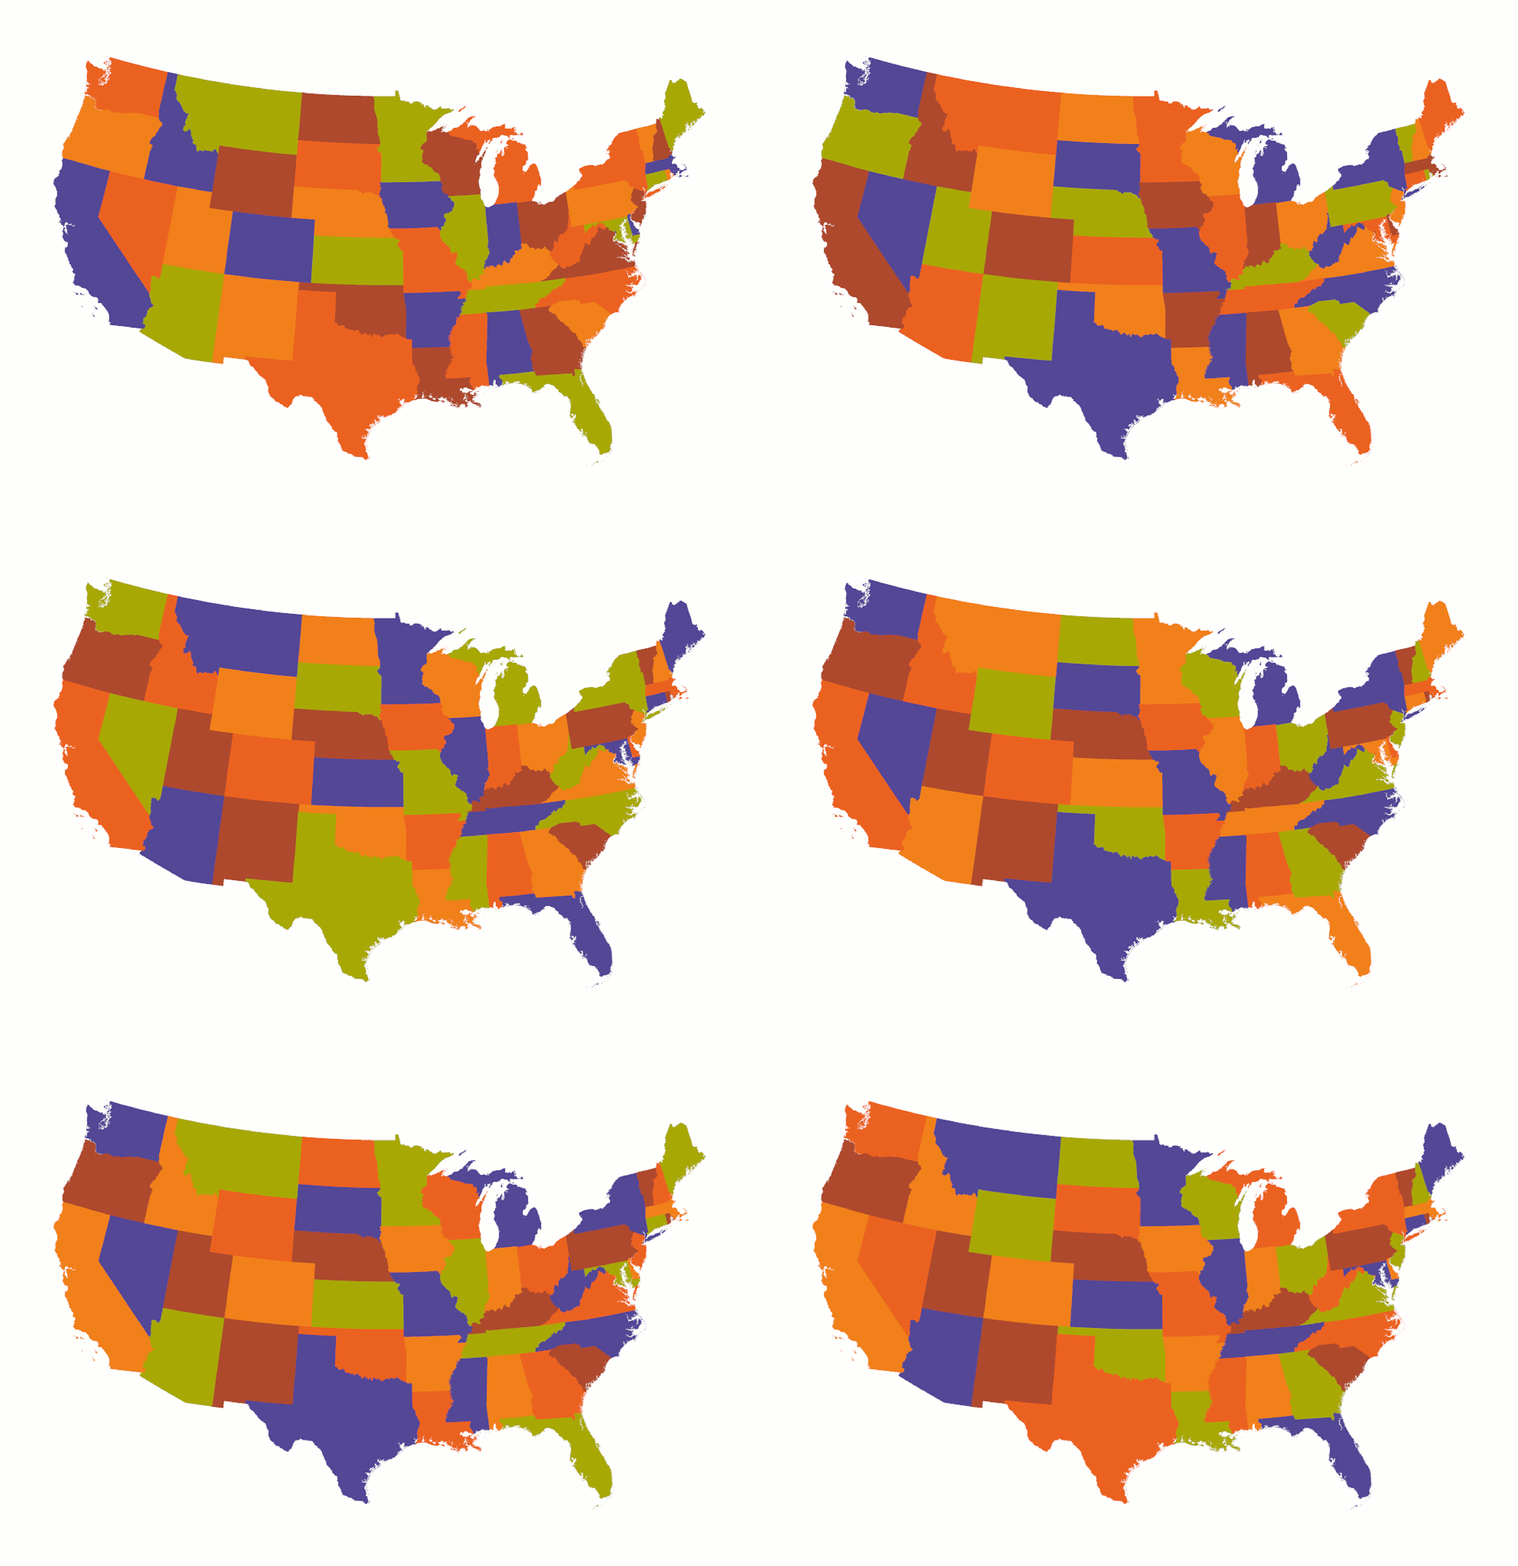
The Color Scheme Editor allows you to easily shuffle around the different blocks in a discrete color scheme. Once you’re done changing things up, you can save your color scheme to a style. This allows you to easily share the color scheme and/or reuse it in another map.
Final Map
This is what the map ended up looking like.

For my text, I paired Juice ITC (serif) with Poiret One (sans serif). I tend to use serif fonts for titles and labels – anything that I want to have a bit of a fancier look – and sans serif fonts for descriptions as they’re a bit easier to read. I felt these two fonts paired well together as Juice ITC is long and thin, while Poiret One is shorter and wider.

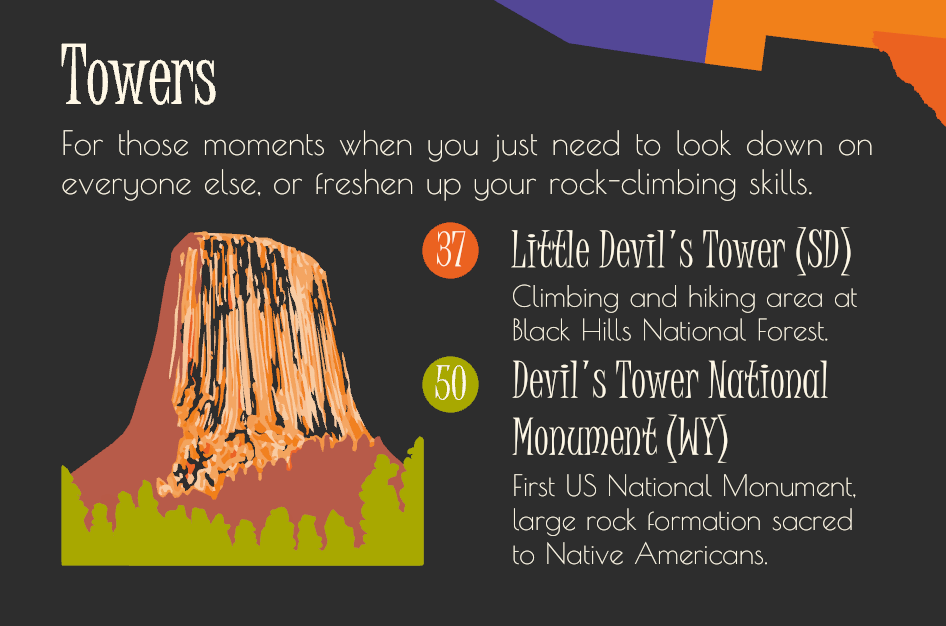
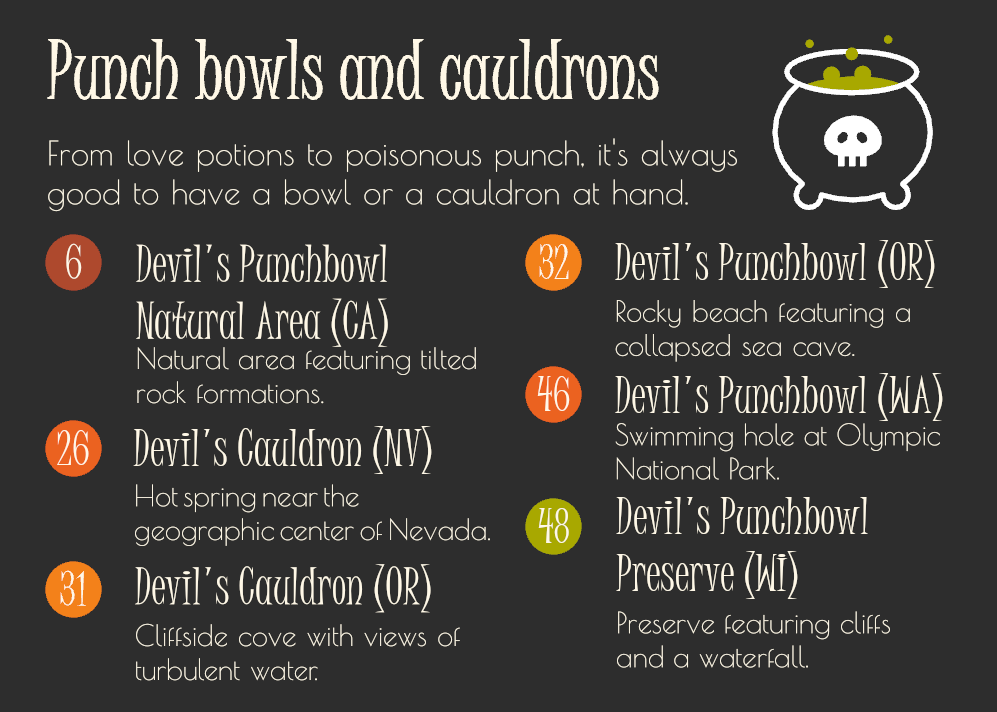
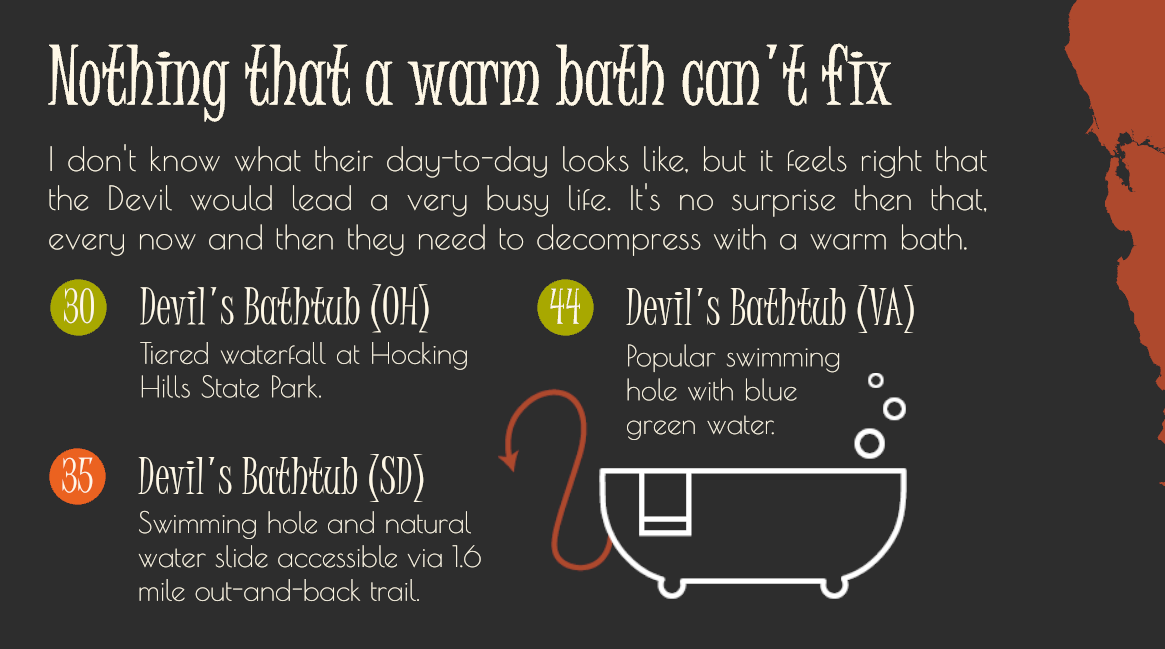
I decorated the layout with some simple illustrations I made in Adobe Illustrator to fill in some of the empty space. I kept them mainly made up of white lines but used the same colors as in my map and legend for color accents.
My Top 3 Favorite Spots
While doing research for this map, I got to learn about some awesome spots around the continental US and the folklore that give them their names. Here are my top 3 favorite ones:
-
Devil’s Hole (NV)
Detached unit of Death Valley National Park, home to the only naturally occurring population of Devils Hole pupfish (cyprinodon diabolis). When I first learned about this, I was mind blown. There is an entire species of fish that only exists in the upper 80 feet of this cavern… that’s it! Although still endangered, the Devils Hole pupfish population saw a 25-year high earlier this year and I’m waiting with bated breath to know if the trend continues with this fall’s pupfish count.
-
Devil’s Sinkhole State Natural Area (TX)
Vertical cavern housing (literal) millions of bats… what?! But that’s not all, the 3-million bats emerge in a swirling mass in search of food on warm nights. Needless to say, this is high up on my bucket list and I can only imagine what seeing that many bats emerge from a cavern at sunset must feel like, but it is definitely an experience worth having.
-
Devil’s Kettle (MN)
“Mysterious” waterfall that seemingly disappears into a hole. Locals allegedly would throw all sorts of items into the kettle to see if they would resurface downstream but were never seen again. In 2017, a dye tracing experiment was set to be conducted to prove the Minnesota department of natural resources’ theory on what happens to the water, but from what I could find, the experiment was never actually conducted. In my books, this is still a mystery worth investigating in person.
Thanks so much for reading. Let me know in the comments if I missed any of your favorite devilish spots and be sure to give this workflow a try once ArcGIS Pro 3.4 is available early November.

Devil’s Slide is a little better known in Utah, but my favorite nearby diabolic feature is Devil’s Kitchen https://maps.app.goo.gl/t1TJrWXX7RBKfiyD8 which is a nice stop on the Mt Nebo Scenic Byway.