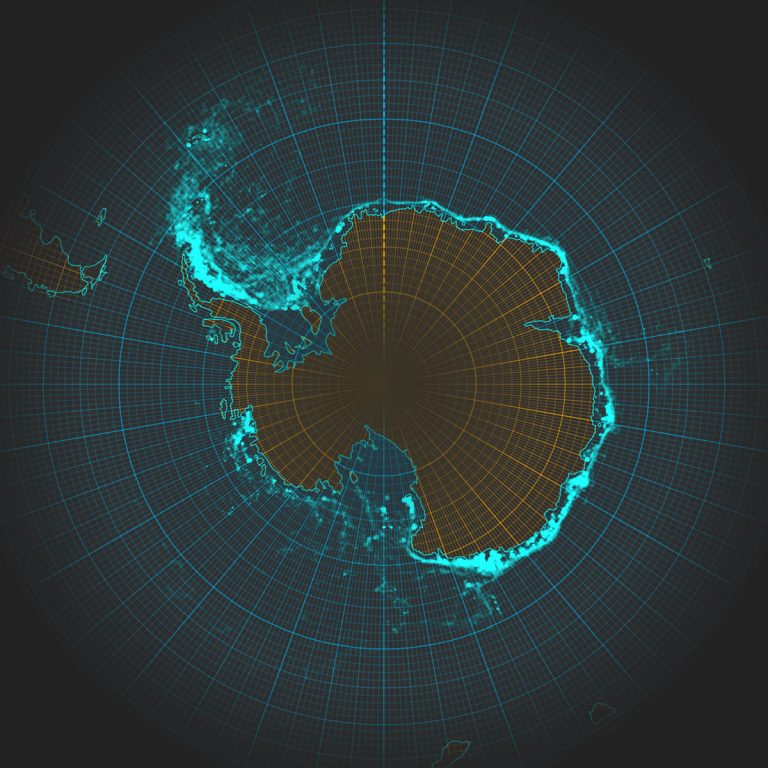
Here is a map showing over 300 thousand historic iceberg locations. The source data comes from “The Antarctic Iceberg Tracking Database,” an amazing collection of tracked iceberg locations and attributes. Here is that data merged into a single feature layer.

If you would like to observe an impeccably professional, superbly narrated, how-to video then I can’t help you. If you’re willing to settle for much less, then perhaps you wouldn’t mind whiling away six minutes of your allotted time on this earth with this…
…You’re still here? In that case, if you’d like to try this out for yourself, or just play with the data and methods, here is a bevy of resources…
- Firefly graticule (and just a bunch of Firefly content in the Living Atlas)
- Simple global land polygons (generalized)
- Global background hack layer
- Firefly style resource for ArcGIS Pro
- More on using gradients in Pro maps
- Natural Mapping in UI design (not necessarily “geographic” mapping)
- I made a nod to a great podcast called “99% Invisible“
Also, at 2:50 mark I DID mean to say “International Dateline,” or at least the 180 degree line of longitude. Whew, accidentally sort of right.
Anyway, here are some of the things covered in this video, in case you have to explain to your boss why you are watching YouTube…
- Defaults v active design
- Choosing an appropriate projection
- Accessing data via the Living Atlas
- Basemap as context
- Map/background color harmony
- Leveraging gradients in strokes and fills
- Feature-level transparency
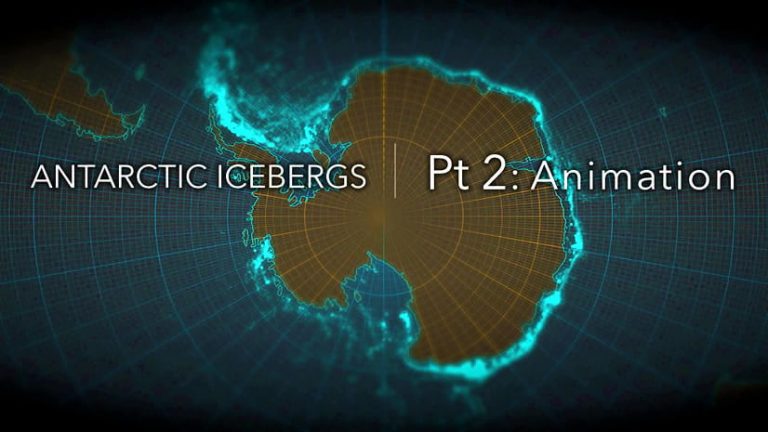
Part 2 walks through how to animate these icebergs through time! Get ready to live.

Happy Mapping! John Nelson

Commenting is not enabled for this article.