Ask questions, derive answers. Chapter 5 of The ArcGIS Book shows you how.
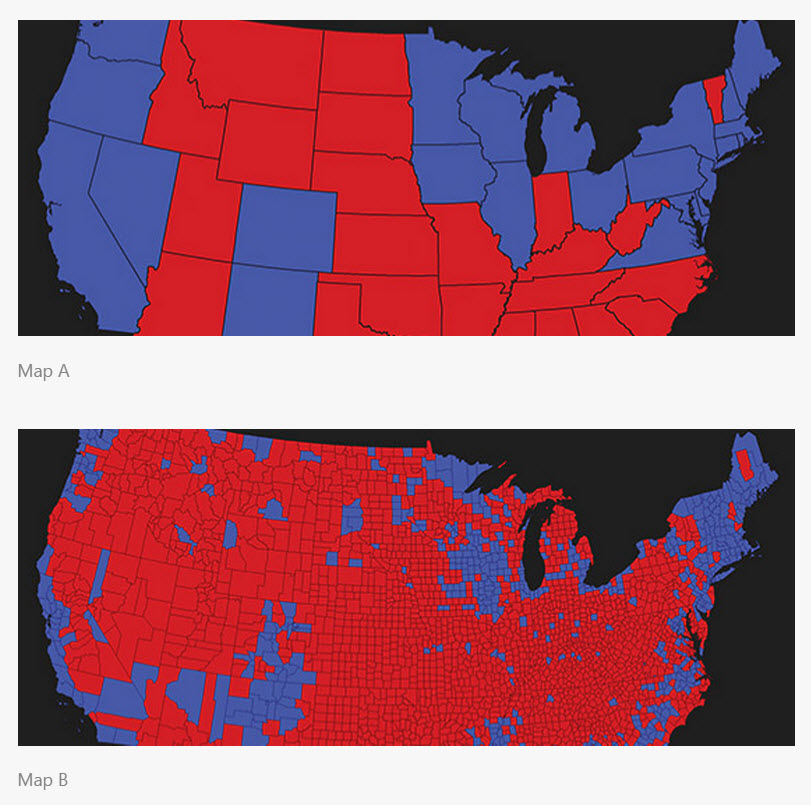
After a brief introduction and a few examples, chapter 5 of The ArcGIS Book quickly gets to the essentials of spatial problem solving. You will begin by learning about the importance of scale; style; attributes; and classification scheme when visualizing your data, and understand how your choices affect the information your map presents and the story it tells.

You will next learn about methods to explore what your data can tell you, including descriptive statistics, queries, spatial relationships, and spatial patterns that reveal what is happening where.
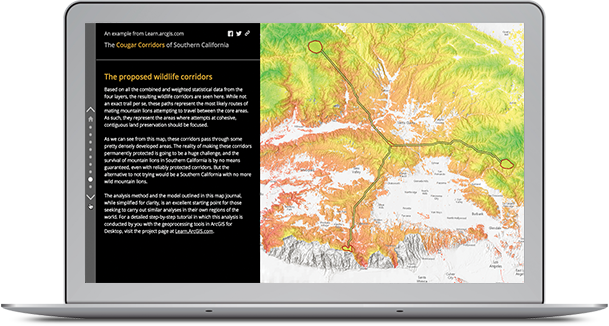
Modeling your data can help you quantify relationships and formally test hypotheses when the problems you are trying to solve go beyond visualizing and exploring data. This chapter will teach you about modeling processes, interpolating values, and modeling spatial interaction.
The thought leader featured in this chapter is Dr. Linda Beale, a member of Esri’s ArcGIS analysis and geoprocessing software development team. She is a geoanalyst and expert in spatial epidemiology—the examination of disease and its geographic variations. As a Research Fellow in Health and GIS at the Imperial College London, she led the effort to publish The Environment and Health Atlas for England and Wales.
“Spatial analysis helps us meet the challenge of making complex data understandable,” says Beale. When performing spatial analysis to develop hazard mapping and predictions for risk assessment, “you can use models to evaluate response strategies, and maps to illustrate preventative strategies and for risk communication and negotiation,” she said.

The Quickstart in chapter 5 provides resources to orient you with the spatial analysis tools available across the ArcGIS platform—in ArcGIS Online, ArcMap, ArcGIS Pro, and the ArcGIS Spatial Analyst extension. You will also learn about the Going Places with Spatial Analysis MOOC (Massive Open Online Course), which has been so well received that Esri is now holding it multiple times a year (Dr. Beale is the main author and presenter of this MOOC).

The Learn ArcGIS lesson takes you to Portland, Oregon to look for suitably zoned areas where young adults are known to live and where renting is common. You’ll also look for areas that provide easy access to the city’s light-rail system. The objective of this lesson is to help you build skills in the following areas:
- Enriching layers with on-demand attributes
- Filtering layers with logical queries
- Adding and calculating table fields
- Deriving new locations through analysis
- Creating time-based accessibility zones
Article Discussion: