In ArcGIS Pro 3.3 we added new tools and enhancements, designed to improve your spatial analysis workflows and deliver more powerful insights. Here’s an overview of the new tools and features.
Time Series Cross Correlation
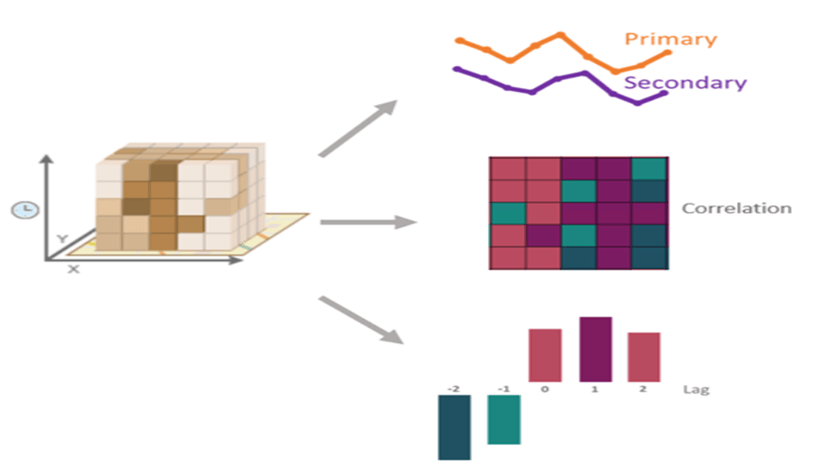
The Time Series Cross Correlation tool helps you analyze the relationship between two time series within a space-time cube. By calculating a Pearson correlation coefficient at each time step and evaluating correlations for various time lags, this tool identifies delayed effects between the primary and secondary analysis variables. This is particularly useful for applications like comparing hourly temperatures to electricity usage, estimating the delay between rainfall and reservoir levels, and understanding the timing of marketing campaign impacts on sales. Additionally, it can incorporate neighboring locations to capture spatial interactions, ensuring more spatial and reliable insights.
Dive deeper into the world of Time Series Cross Correlation with examples and illustrations in this blog post.

Calculate Rates
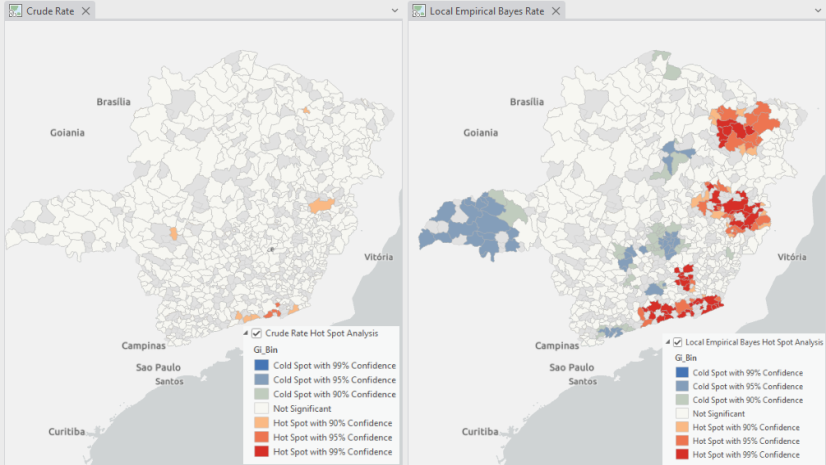
ArcGIS Pro 3.3 introduces the Empirical Bayes Rates (EBR) method in the new Calculate Rates tool, addressing low denominator problems often encountered in traditional rate calculations. EBR smooths out fluctuations by borrowing strength from the overall distribution of rates, providing more reliable and stable estimates. This method is ideal for calculating rates in areas with small populations or event counts, such as rare disease rates, crime rates in sparsely populated areas.
Explore and learn some of these use cases in this blog post and hands-on ArcGIS Lab.
Create Spatial Sampling Locations
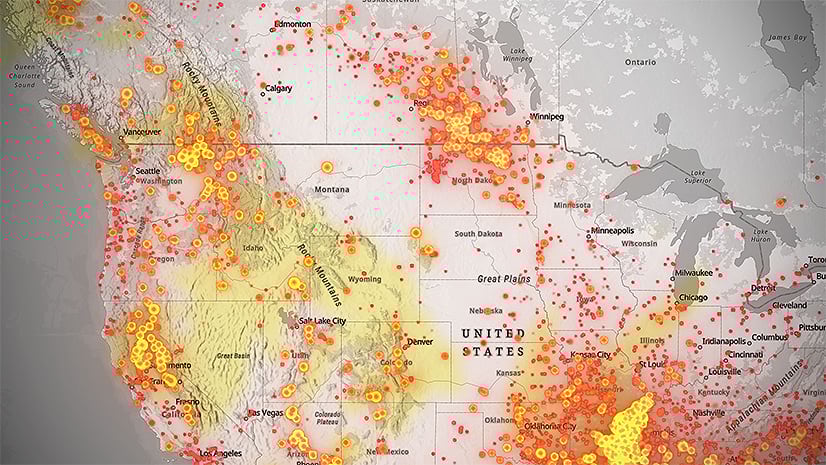
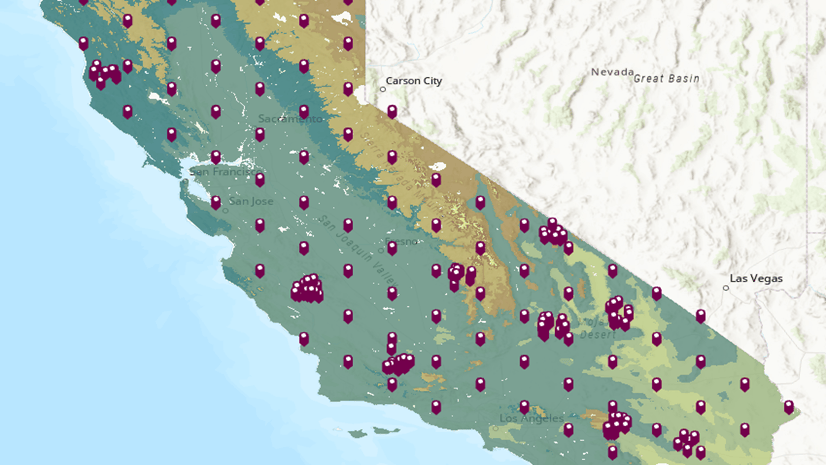
The new Create Spatial Sampling Locations tool in the Data Management toolbox (Sampling toolset), simplifies the process of designing sampling strategies. Collecting data at specific locations is fundamental to GIS, but it previously required multiple tools and custom coding. This tool encapsulates many sampling workflows into one, making it easier to plan data collection or thin large datasets from high-resolution rasters. Key use cases include creating a plan for collecting spatial data when no data is currently available and developing a sampling approach for thinning large datasets. You can generate sampling locations using simple random sampling, stratified random sampling, systematic sampling, or cluster sampling, ensuring your strategy is both cost-effective and aligned with your study’s goals.
Learn more about these methods with examples in this detailed blog post.

Enhancements to Forest-Based and Boosted Classification and Regression
In ArcGIS Pro 3.3, the Forest-based and Boosted Classification and Regression tool now includes probabilities. Alongside predicted categories, these algorithms provide probabilities for each predicted category, offering deeper insights into the likelihood and confidence of your predictions. This enhancement allows for more nuanced and informed decision-making in your projects.
Learn more about the enhancement in this blog post with examples.
Bonus: Calculate Composite Index Now Available in ArcGIS Online!
The Calculate Composite Index tool, previously available in ArcGIS Pro 3.1, is now available in ArcGIS Online. This tool is essential for creating composite indices, which are widely used in social research, epidemiology, and government programs to measure complex phenomena using a single indicator. Learn more about it in this blog post.
We hope these new tools and enhancements in ArcGIS Pro 3.3 will support your spatial analyses and help you achieve more accurate and insightful results. We look forward to seeing how you use them. Happy mapping!

Article Discussion: