We are very excited to share some of our newest Spatial Statistics resources. Every year we produce technical workshops for our favorite GIS conference – the Esri User Conference. Whether you joined us in person and want to relive the magic or will be seeing them for the first time, we have released new technical workshops from our team on the Esri Events YouTube channel. The workshops range from introductory to advanced and cover topics including describing spatial patterns, data visualization techniques, machine learning and integrating the Esri platform with R through the R-ArcGIS Bridge. One of the best parts is that the presentations are given by our team members, so you can get to know some of the faces behind the tools.
And you can always find the latest resources from the Spatial Statistics team on the Spatial Statistics Resources Page (http://esriurl.com/spatialstats)
Workshop List:
1. From Means to Medians to Machine Learning: Spatial Statistics Basics and Innovations
2. Beyond Where: Modeling Spatial Relationships and Making Predictions
3. Data Visualization for Spatial Analysis
5. Integrating R and ArcGIS for Advanced Analysis
From Means and Medians to Machine Learning: Spatial Statistics Basics and Innovations
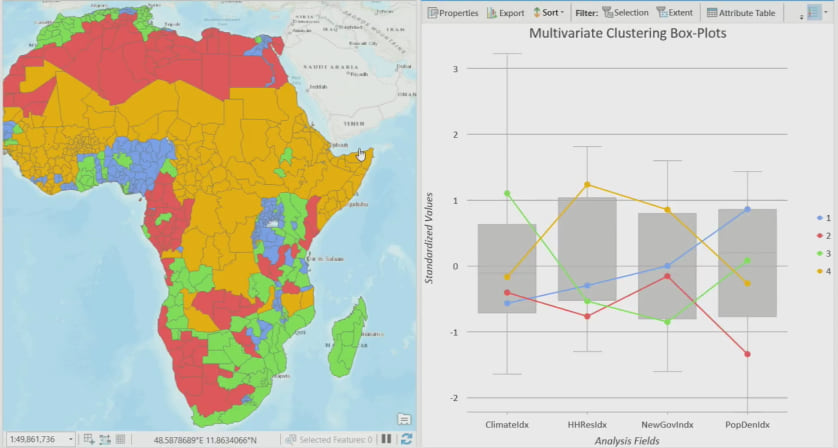
Join Lauren, Flora and Ryan on this introductory journey to Spatial Statistics, we cover a lot of great information and some advanced topics. Starting with a discussion on the differences between data and information we consider some of the tools focused on descriptive spatial statistics, including Mean Center, Median Center and Standard Deviation Ellipse. The Similarity Search tool lets you use attribute values to find similar locations, and is used to create a powerful model predicting areas of high risk for Dengue Fever in Kenya. The final part of the workshop takes a look at clustering. Density based clustering is an unsupervised machine learning technique which creates clusters based solely on spatial location. The Multivariate Clustering and the Spatially Constrained Multivariate Clustering tools take a different approach and can create clusters based on attribute values, and can even be given constraints like the maximum number of features in a cluster.
Beyond Where: Modeling Spatial Relationships and Making Predictions
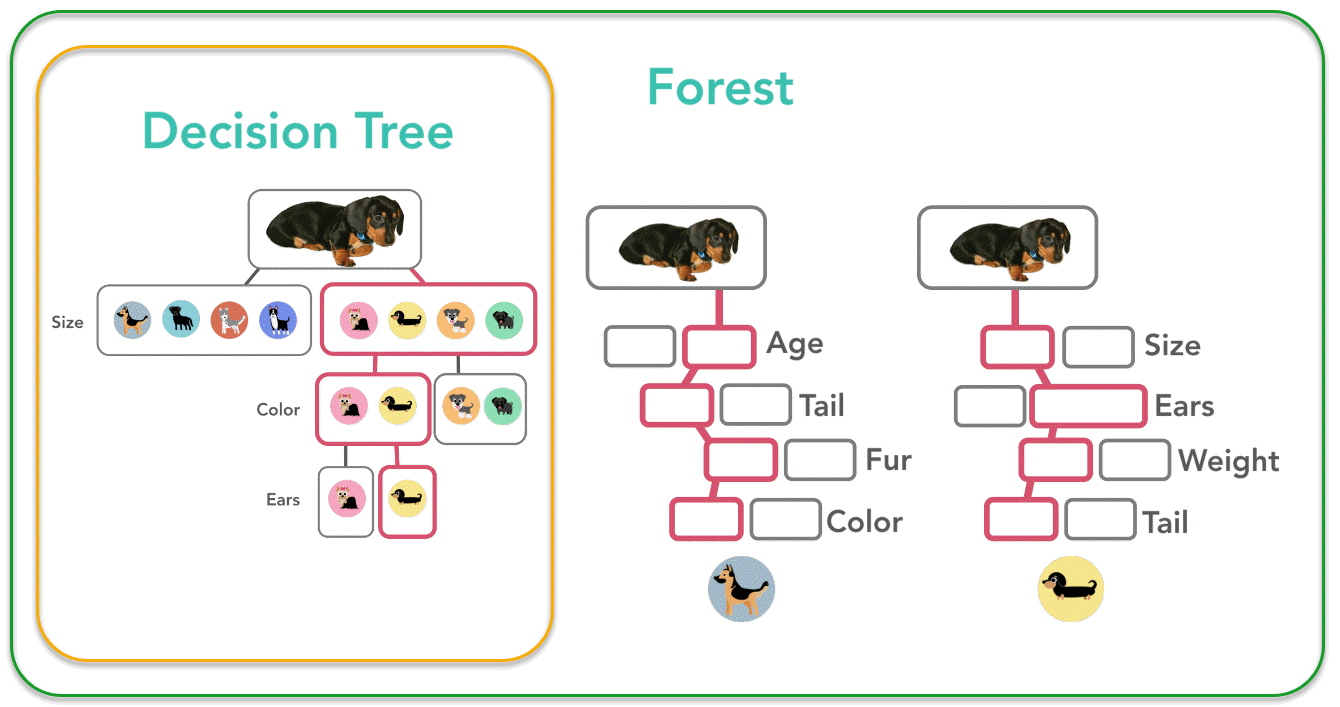
If you are looking to explain and model spatial phenomenon this workshop is a great place to get started. Whether regression is your favorite dinner party topic or it makes you sweat, Lauren and Jenora strive to break these methods down and share applicable workflows that don’t need a PhD to follow. Ordinary Least Squares Regression and Geographically Weighted Regression are used to create predictive models and can help you discover key driving factors in your phenomenon. This is also our first workshop showcasing the Forest-based Classification and Regression tool. Flora explains the key concepts behind the tool and Lauren builds a forest-based classification model to predict Dengue fever risk in Kenya, as well as a forest-based regression model to predict asthma rates. This tool is powered by a very popular machine learning algorithm called random forest and allows you to combine data in new ways, bringing together feature classes, distance features and rasters in the same analysis.
Data Visualization for Spatial Analysis
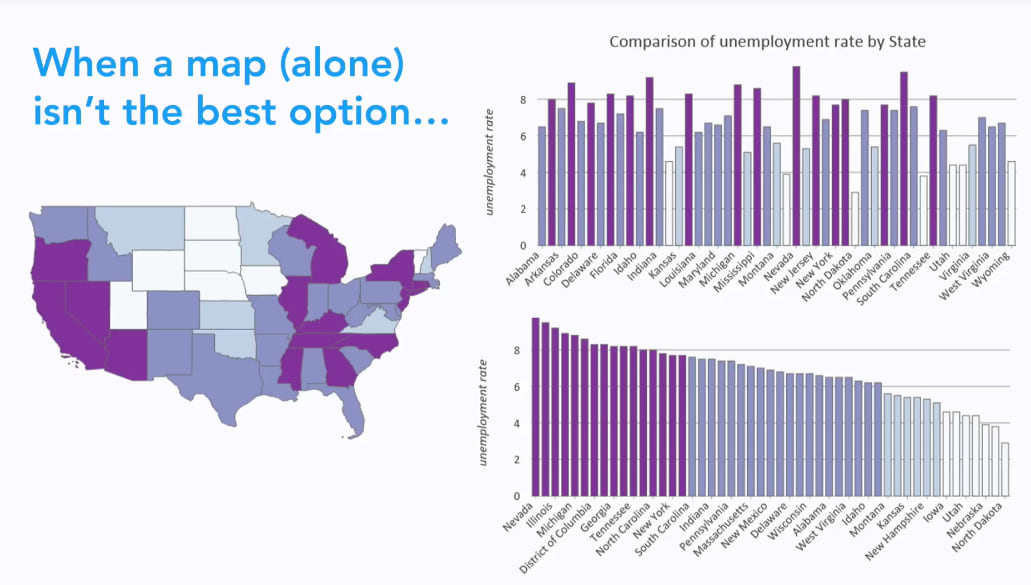
This workshop focuses on how to present and share your analysis, Lauren and Flora explore the powerful visualization capabilities of the Esri platform. Creating great models to explain phenomenon is the first step, but you also need to be able to effectively communicate results to stakeholders. Flora explores a collection of charts and plots to contrast some of the many ways to make, and break a visualization. Then take a tour through ArcGIS Pro’s powerful charting engine which allows you to create a wide variety of graphs which can use your geographic features as data sources and directly link to your map. Our charting engine and mapping capabilities are not restricted to 2D maps either, we will also explore powerful 3D visualization techniques using a 3D Scene in ArcGIS Pro.
Machine Learning in ArcGIS
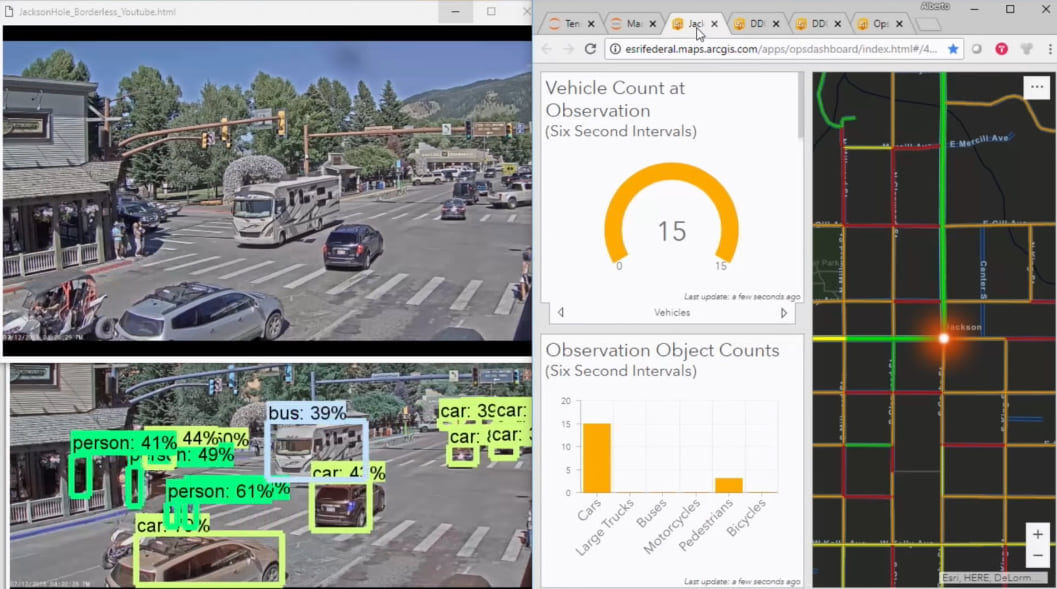
Lauren, Alberto and Orhun explore some of the many tools integrating machine learning into the ArcGIS Platform. This tech session starts by making sure everyone is on the same page with an overview of key machine learning concepts and definitions. This session is packed with examples of machine learning to solve spatial problems. The density based clustering tool is used with traffic accident data to target problem locations and identify key zones for improving public safety. Spatially Constrained Multivariate Tool can create global clusters of ocean regions using temperature and salinity data. Time Series Clustering and solar production data are used to delineate different regimes of solar production. The Support Vector Machine Classifier is a powerful tool to with applications in imagery classification. The Forest-based Classification and Regression tool is used to create a global model predicting the habitat of seagrass, a key organism in controlling carbon dioxide levels in our atmosphere. Machine learning in the ArcGIS Platform can also be integrated with other software and models. The ArcGIS Python API combined with TensorFlow is demonstrated detecting people, cars and buses from a live webcam feed and added into a map in a dashboard.
Integrating R and ArcGIS for Advanced Analysis
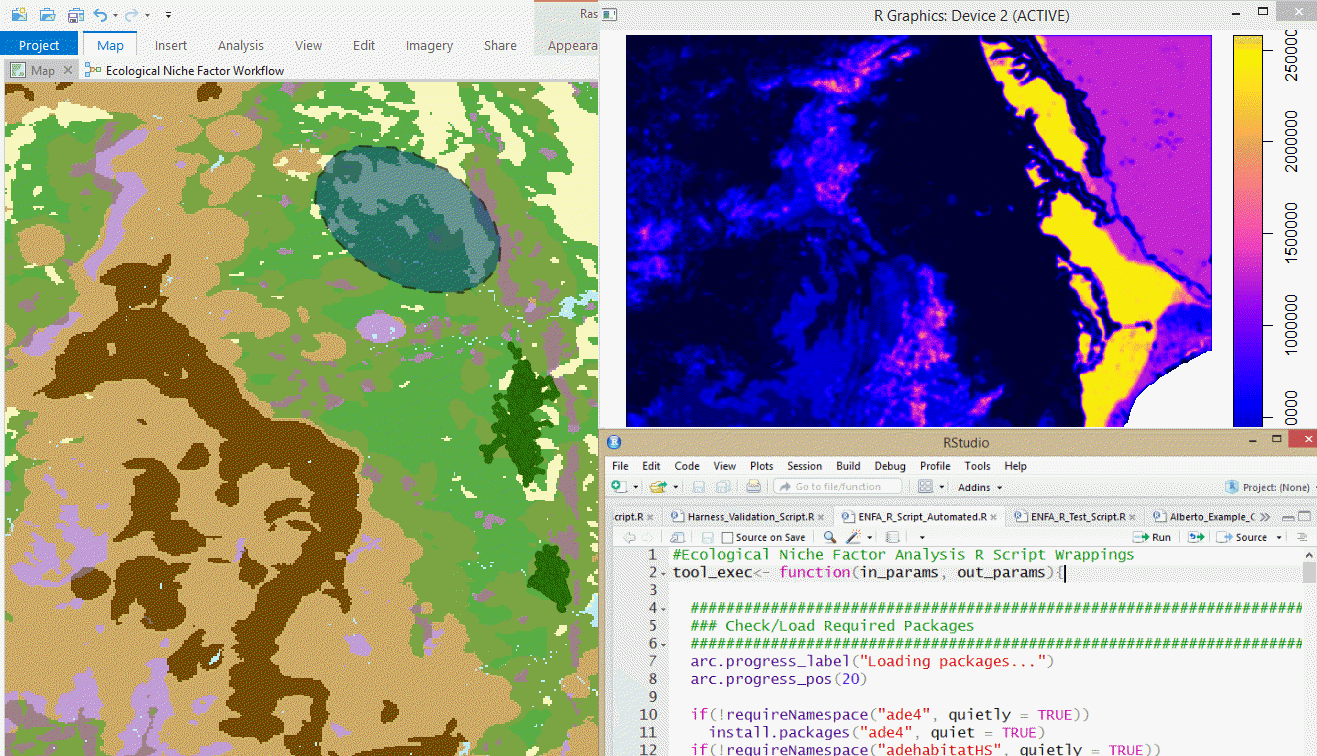
Marjean and Orhun are both Product Engineers who have worked extensively with R and are active in the development of the R-ArcGIS Bridge. Whether you already use R or are interested in how it can be integrated with ArcGIS this workshop is for you. The key features and technical aspects of the R Bridge are outlined including key spatial packages in R so you are ready to get started. Working through an analysis of African Buffalo in South Africa, Marjean shares how you can seamlessly set up an analysis in ArcGIS Pro, analyze the data in R, and plot it back to your map without skipping a beat. A big fan of model builder? R scripts can be used in a model to simplify complicated analysis and make batch processes easy. Orhun then explores the Microsoft R Open framework, which opens up the possibility of doing big data analytics using the R-Bridge.
We hope that you enjoy these workshops and get to know our team more while watching them. Sharing them with you on the Esri Events channel is very exciting for us and we hope they are another resource you use to help tackle your next analysis.


Commenting is not enabled for this article.