When you’re calculating rates, especially in areas with small populations or rare events, you’ve probably encountered this challenge: the smaller the population, the more extreme (and often misleading) your calculated rates can become. Whether you’re analyzing rare disease outbreaks, crime rates in sparsely populated areas, or pollution levels, the fluctuations can obscure the true underlying risk, making your analysis more of a guessing game than a reliable decision-making tool.
To tackle this, we have introduced the Empirical Bayes Rates (EBR) method along with other rates smoothing techniques in the new Calculate Rates tool, available in ArcGIS Pro 3.3. Empirical Bayes method helps smooth out those extreme fluctuations by “borrowing strength” from the overall distribution of rates, allowing you to capture more accurate and stable estimates—particularly in those tricky situations where small numbers throw off the analysis.
Let’s walk through an example of rate smoothing can be useful for uncovering underlying risks and in downstream analysis.
Example: Calculating Infant Mortality Rates in the State of Minas Gerais, Brazil
Let’s say we’re tasked with calculating the infant mortality rate for the State of Minas Gerais in Brazil. Identifying infant mortality risk is key to improving prenatal and maternity care in the region. But how do we make sure we’re getting the clearest picture?
Step 1: Crude (or Raw) Rates
We start by calculating the crude rate-simply dividing the total number of infant deaths by live births in each area. On the map, the dark brown locations represent regions where infant mortality rates are significantly higher than the state average.
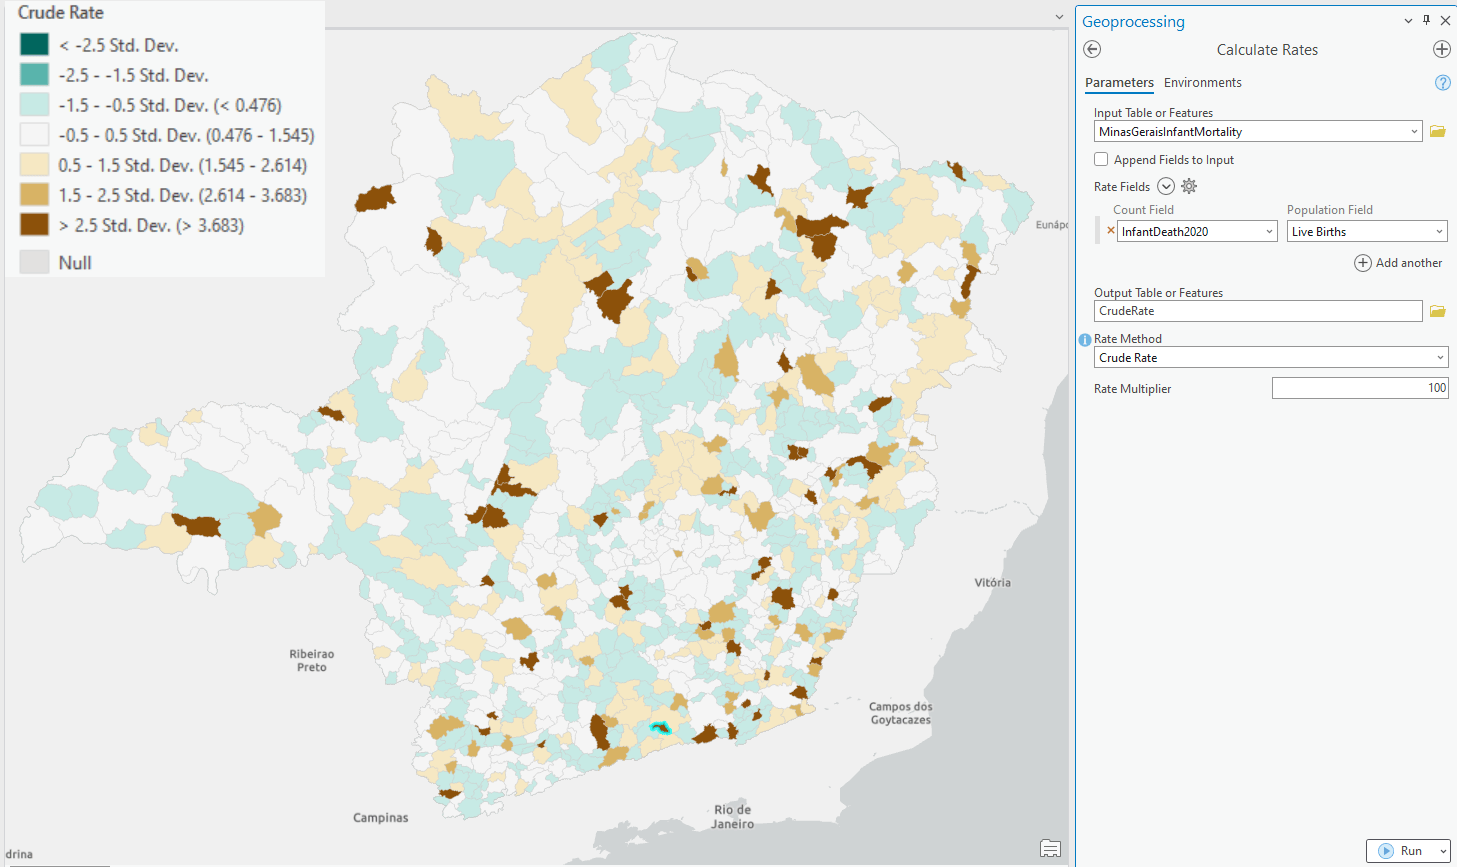
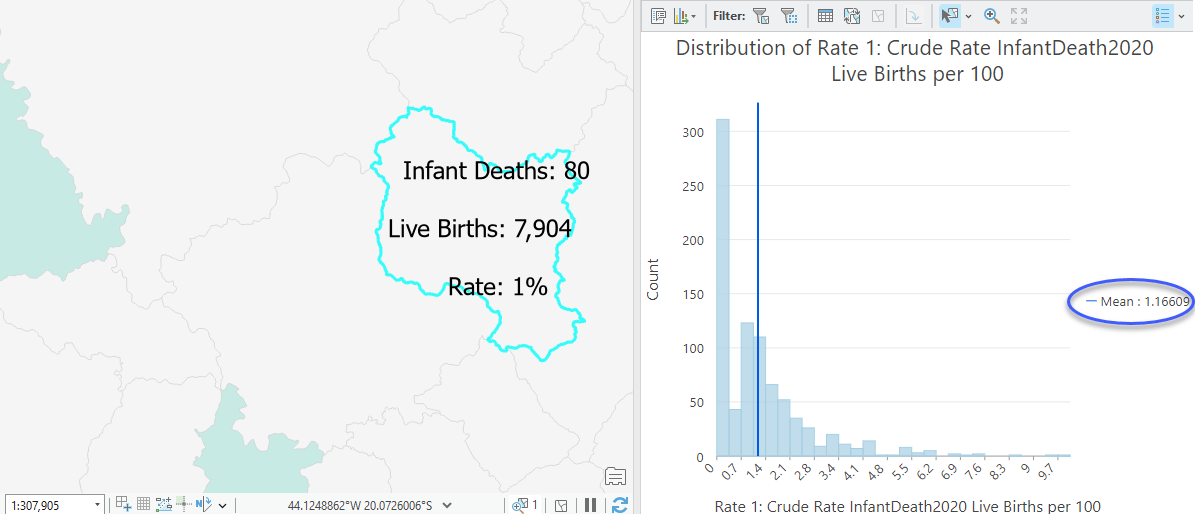
Looking at a histogram of the data, we can see that the average risk hovers around 1%. For instance, an area with 80 deaths out of 7,900 births would have a 1% infant mortality rate.
But what’s alarming is that in some locations, the risk spikes to as high as 10% (right most values in the histogram). This means one out of every 10 live births results in an infant death, a heartbreaking statistic. Even a single infant death is devastating, so this figure can be truly alarming to communities. However, it’s important to understand that this 10% doesn’t necessarily reflect the actual risk and is disproportionately high compared to other areas. The culprit? Small denominator (or number of births in this example)!
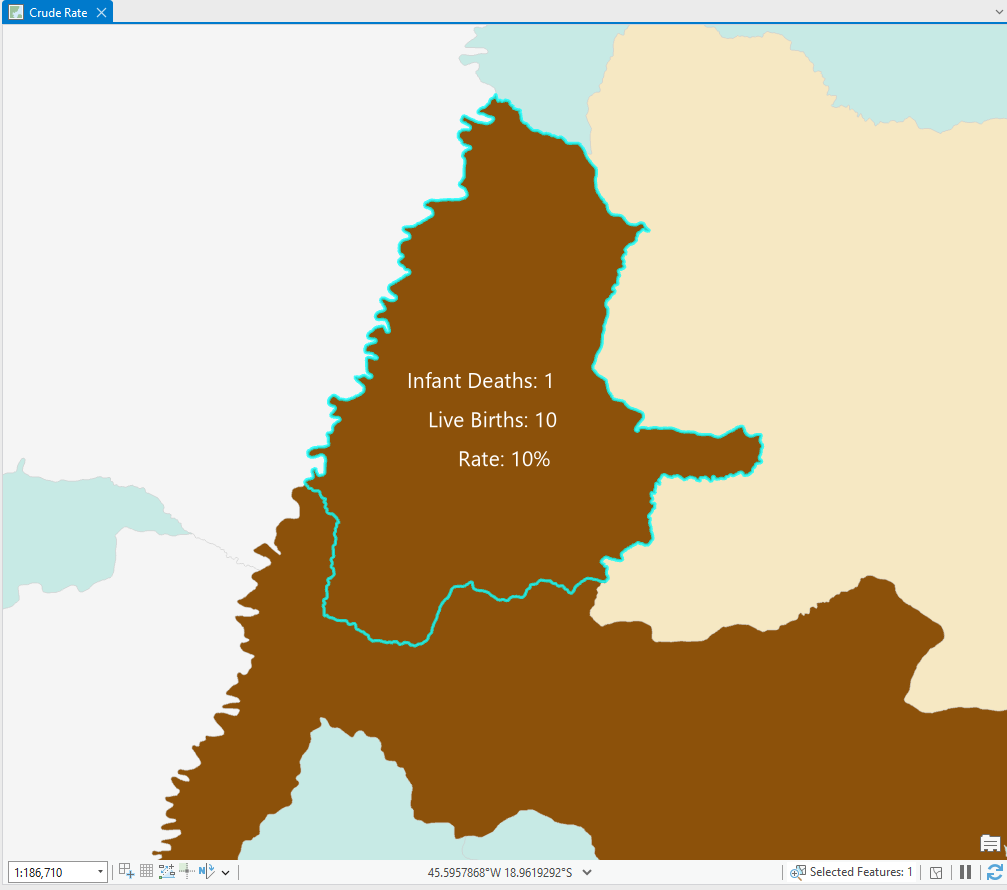
These outliers skew our analysis, potentially masking the real trends we’re trying to uncover.
Step 2: Smoothing with Empirical Bayes Rates
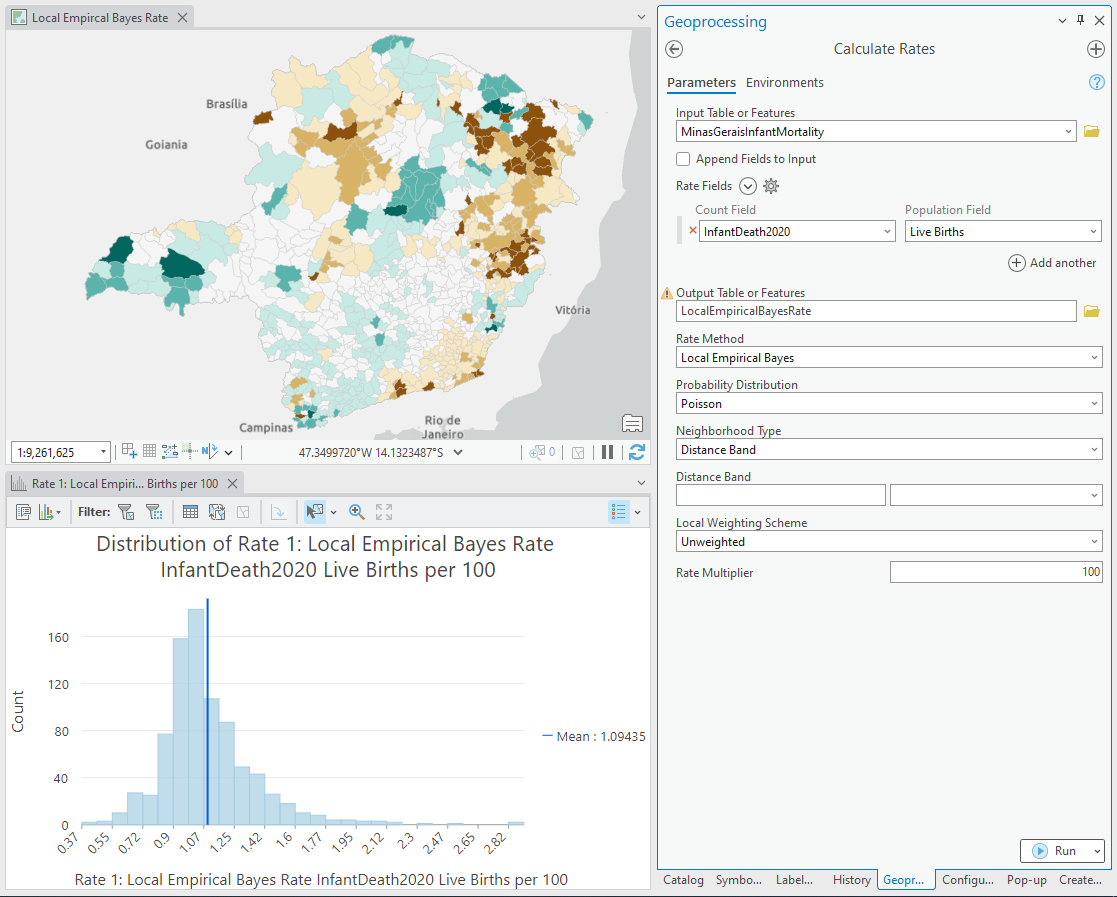
Here’s where the EBR method steps in. By applying local empirical bayes smoothing, we can mitigate the impact of these outliers. This method takes data from neighboring areas to smooth out those extreme values caused by low birth counts. Learn more about how empirical bayes rates are calculated in the tool documentation.
After applying the smoothing, the rates are recalculated, and we immediately see a difference. The spurious high risks that were inflating the crude rates are now gone. The histogram has a cleaner distribution and spatial patterns begin to emerge. Clusters of high-risk areas are more apparent now that the rates have been smoothed over.
Step 3: Hot spot Analysis for Deeper Insights
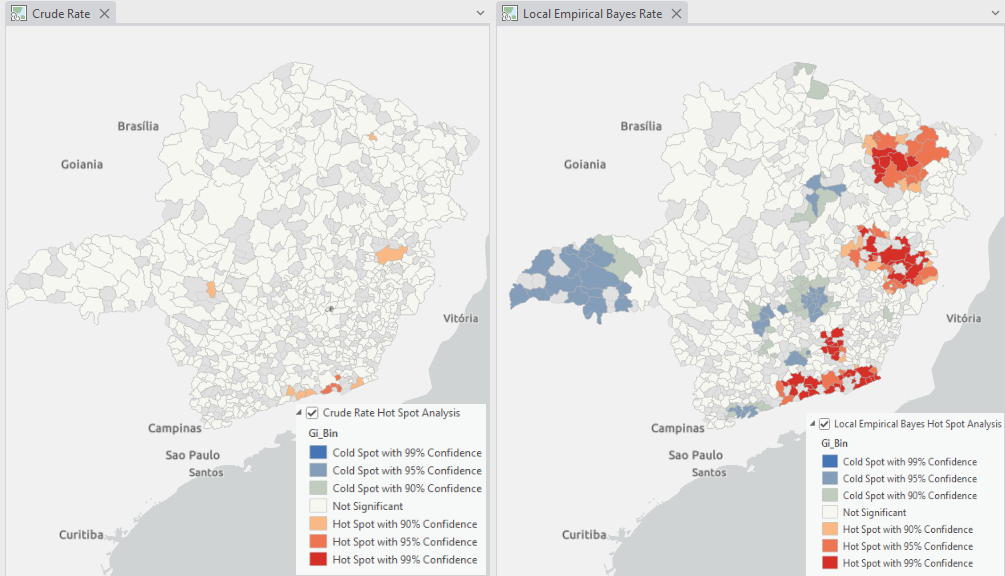
To find statistical clusters of high and low rates, we can run a hot spot analysis on the data. With crude rates, the high outlier values often diluted our results, making patterns less visible and statistically insignificant. But with the smoothed rates, spatial patterns become clearer, allowing us to identify areas of high- and low-risk with much more confidence.
For instance, in Minas Gerais, the hotspot analysis on local empirical Bayes rate highlights an affluent region as a cold spot—an area with better access to healthcare. This matches what we would expect from a healthcare based analysis.
About the data
The data used in the blog post is for demonstrating the new Calculate Rates tool in ArcGIS Pro and was downloaded from the Brazilian official website for health vital statistics called DATASUS (DATA SUS-Sistema Unico de Saude, meaning Unique System for Health Data). The number of children born in each year per municipality in the Minas Gerais state for 2020 is obtained from here. The number of infant deaths in each year per municipality in the Minas Gerais state is obtained from here. The data clean up and engineering steps were performed in ArcGIS Pro.
Why it matters?
Rates are critical for communicating underlying risks, and they play a huge role in subsequent analysis. Whether you’re making public health decisions or tackling environmental issues, having reliable, accurate rate calculations ensures your insights are grounded in reality. Without fixing the rates, downstream analyses (like the hot spot example above) could produce misleading results. Poorly calculated rates might highlight areas as high-risk due to outliers rather than actual patterns, steering resources and attention away from the communities that truly need them.
The Empirical Bayes Rates method provides an invaluable tool for smoothing out unreliable data, enabling you to focus on the true patterns and risks present in your study area. We’re excited to offer this feature in ArcGIS Pro 3.3 and encourage you to explore how it can enhance your own rate calculations.

Article Discussion: