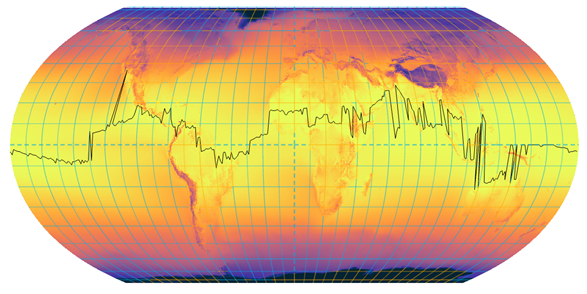
When we think of the equator, we typically picture the line splitting the Earth into northern and southern hemispheres. But there’s at least one other equator—the thermal equator. The Glossary of Meteorology (AMS) defines it as “the line that circumscribes the Earth and connects all points of highest mean annual temperature for their longitudes.” It’s a dynamic boundary shaped by Earth’s complex climate patterns.
In a recent Bulletin of the American Meteorological Society article, McKay and Cintron created a map of the thermal equator for Earth and, remarkably, Mars. Inspired by their work, I wondered, “How could I replicate that using ArcGIS?” This blog outlines the process of creating a similar map. The thermal equator is important for ecosystem delineation, helpful in comparing climate models, and aiding our understanding of global temperature patterns.

The thermal equator is far from a smooth, continuous line; instead, it exhibits a jagged, meandering path that reflects the complexity of Earth’s temperature patterns. It shifts dramatically across longitudes, with a notable leap northward to Death Valley in the Western U.S. Sharp deviations in Africa and South America may be due to the interplay between topography and climate. Conversely, the smoother stretches over oceans show the relative thermal stability of water compared to land.
Things you can try:
- This blog delineates the thermal equator at one-degree longitude intervals. For a more refined equator, repeat this workflow using one-half or one-quarter intervals.
- Delineate the thermal equator using other datasets (including climate projections) to see how they compare.
- What about precipitation? Is there a precipitation (pluvial) equator?
Workflow to Delineate the Thermal Equator Using ArcGIS
- Convert Longitude Lines to Raster
Tool: Feature to Raster
Purpose: Convert longitude lines to raster. This raster will be used to extract temperature values along longitude lines in the next step.
Key Parameters:- Input features: longitude_lines— Available here.
- Field: VALUE
- Output raster: Feature_long1
- Output cell size: CHLSEA_bio1_1981-2010_V.2.1.tif
- Extract Maximum Temperatures Along Longitude Lines
Tool: Zonal Statistics
Purpose: Identify the maximum annual temperature for each 1-degree line of longitude.
Key Parameters:- Input Raster or Feature Zone Data: Feature_long1
- Zone field: Value
- Input Value Raster: CHELSA_bio1_1981-2010_V.2.1.tif — Available here. (Click on the Version 2.1 button, then browse this directory structure (Climatologies | 1981-2010 | bio)
- Output raster: ZonalSt_long1
- Statistics type: MAXIMUM
- Identify Cells Matching Maximum Temperature
Tool: Equal To
Purpose: Highlight raster cells that match the maximum temperature along each line of longitude.
Key Parameters:- Input raster 1: CHELSA_bio1_1981-2010_V.2.1.tif
- Input raster 2: ZonalSt_long1
- Output raster: EqualTo_CHEL1
- Select Only those Cells Matching Maximum Temperature
Tool: Select Layer By Attribute
Purpose: The Equal To tool creates a raster containing a value of 1 if a cell is equal to the maximum temperature. Otherwise, the raster contains a zero. Select only those locations where the maximum temperature occurred.
Key Parameters:- Input Rows: EqualTo_CHEL1
- Expression: Where Value is equal to 1
- Convert Maximum Temperature Cells to Points
Tool: Raster to Point
Purpose: Create point features from raster cells representing the maximum temperature.
Key Parameters:- Input raster: EqualTo_CHEL1
- Output feature class: hottest_points
- Calculate Geometry Attributes
Tool: Calculate Geometry Attributes
Purpose: Add latitude and longitude attributes to the points.
Key Parameters:- Input features: hottest_points
- Geometry Attributes (field, property)
latitude Point y-coordinate
longitude Point x-coordinate
- Calculate Distance from Equator (absolute latitude)
Tool: Calculate Field
Purpose: The maximum temperature value may occur along each longitude at multiple locations. If so, we must choose only one point to draw the thermal equator. We will select the point closest to the equator (a form of smoothing).
Key Parameters:- Input Table: hottest_points
- Field Name: abs_latitude
- Expression Type: Arcade
- Expression: Abs($feature.latitude)
- Sort Points by Distance from the Equator and Longitude
Tool: Sort
Purpose: Places the points in ascending order by longitude and, within each longitude, in ascending order by distance from the equator. This prepares the feature class for summarization in the next step.
Key Parameters:- Input Dataset: hottest_points
- Output Dataset: hottest_points_Sort
- Fields (Sort Field, Sort Method): longitude Ascending; abs_latitude Ascending
- Summarize Locations where maximum temperature occurs more than once along a single longitude
Tool: Summary Statistics
Purpose: When the maximum temperature occurs more than once along the same line of longitude, find the latitude closest to the equator.
Key Parameters:- Input table: hottest_points_Sort
- Output table: hottest_points_Statistics
- Statistics: longitude First; latitude First; abs_latitude First
- Case field: longitude
- Create Points from the Summary Table
Tool: XY Table To Point
Purpose: Convert the summarized latitude and longitude values back to points for subsequent conversion to a line.
Key Parameters:- Input Table: hottest_points_Statistics
- Output Feature Class: thermal_equator_points
- X Field: FIRST_longitude
- Y Field: FIRST_latitude
- Convert Points to a Line
Tool: Points to Line
Purpose: Connect the points along longitudes with the highest mean annual maximum temperature to create the thermal equator.
Key Parameters:- Input features: thermal_equator_points
- Output feature class: thermal_equator
- Sort field: longitude
- Karger, D.N., Conrad, O., Böhner, J., Kawohl, T., Kreft, H., Soria-Auza, R.W., Zimmermann, N.E., Linder, P., Kessler, M. (2017). Climatologies at high resolution for the Earth land surface areas. Scientific Data. 4 170122. https://doi.org/10.1038/sdata.2017.122
- Karger D.N., Conrad, O., Böhner, J., Kawohl, T., Kreft, H., Soria-Auza, R.W., Zimmermann, N.E,, Linder, H.P., Kessler, M.. Data from: Climatologies at high resolution for the Earth’s land surface areas. Dryad Digital Repository.http://dx.doi.org/doi:10.5061/dryad.kd1d4
- McKay, C. P., & Cintron, M. N. (2024). The Thermal Equator on Earth and Mars. Bulletin of the American Meteorological Society, 105(6), E1015-E1021.

Article Discussion: