Wakes are water disturbances produced by high-speed water traffic. These disturbances can increase shoreline erosion and result in loss of property and critical habitat. Areas that are most at risk of erosion can be identified by analyzing water traffic data.
The GeoAnalytics Desktop Toolbox allows you to analyze trends, patterns, and anomalies in large datasets. In Bethany’s plenary demo (shown below), she uses GeoAnalytics in ArcGIS Pro to process and analyze one month of ocean traffic vessel data to identify problematic and potentially harmful nearshore traffic patterns. She then identifies coastal areas that may be at risk for shoreline erosion due to wakes caused by ocean vessels.
Bethany starts by downloading one month of vessel traffic data from Marine Cadastre. This dataset includes 31 files that each contain over 6 million records of ocean vessels. Each record contains a point location, timestamp, and vessel ID.
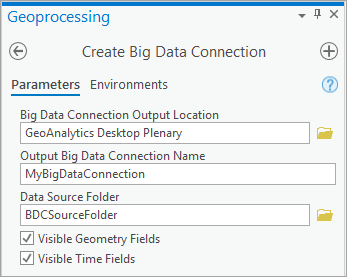
She uses the Create Big Data Connection geoprocessing tool to create a connection to her dataset in ArcGIS Pro. A big data connection can represent multiple files as a single dataset, in this case, 31 CSV files. The Create Big Data Connection tool automatically detects time and location fields within the dataset, so Bethany can connect her data and enable location and time on her layer—all in one step.

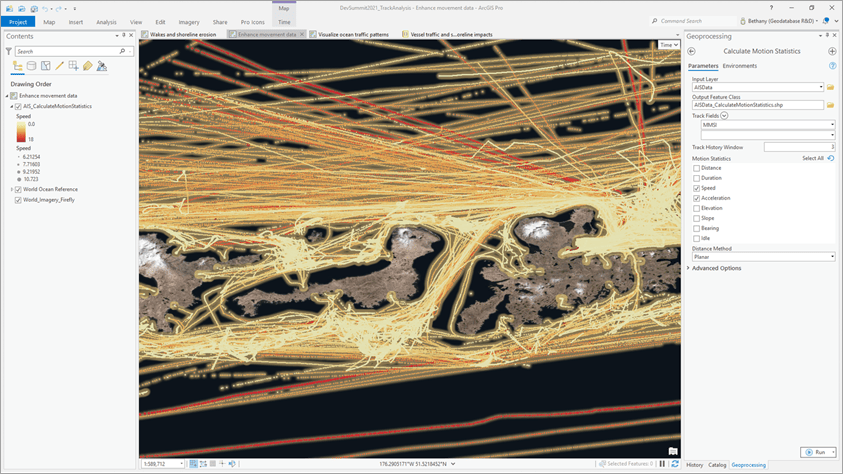
The first step in Bethany’s analysis is enhancing her data with movement statistics. She uses the Calculate Motion Statistics tool to calculate statistics for the speed and acceleration of the ocean vessels.

She then uses these statistics in the Reconstruct Tracks tool to calculate change in vessel movement over time. The Reconstruct Tracks tool ties together time-enabled features using a common identifier, like a vessel ID. This concept is demonstrated in the diagram below.

Bethany splits the tracks using Arcade expressions. She splits the tracks at locations where the change in track speed from the previous point (TrackSpeedAt(-1)) to the current point (TrackCurrentSpeed()) is greater than two nautical miles per hour. She uses the following arcade expression to calculate this:
(TrackCurrentSpeed() – TrackSpeedAt(-1)) > 2
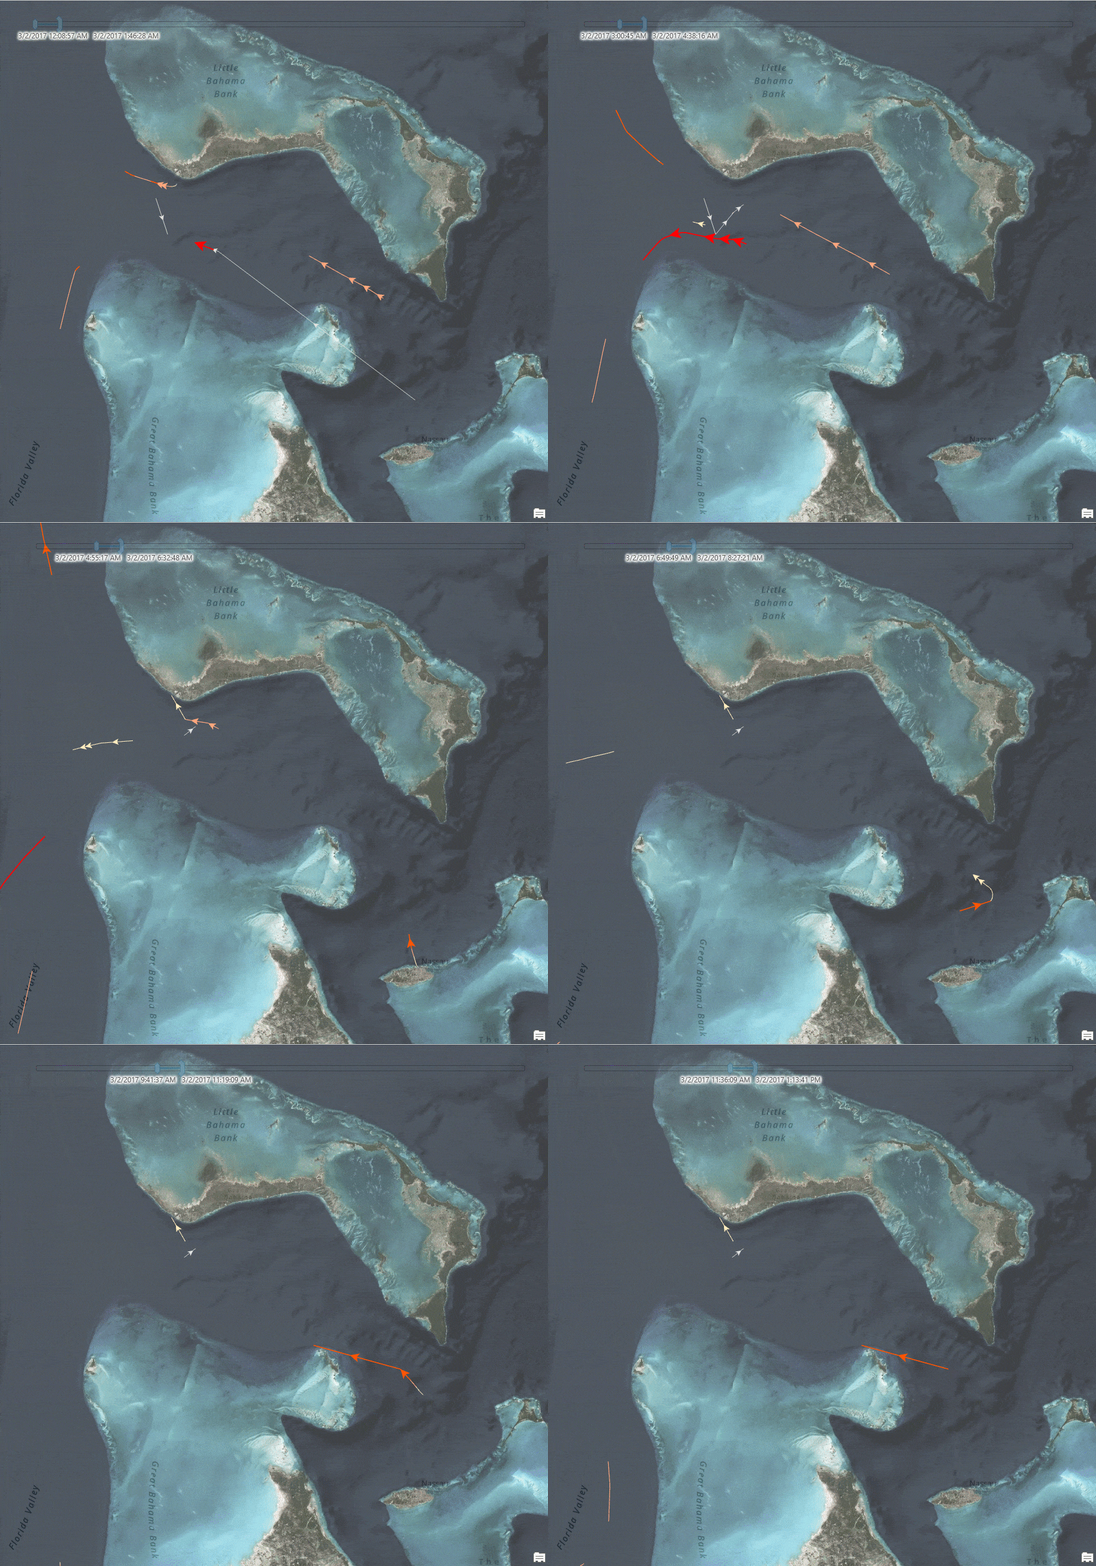
Her resulting tracks are symbolized and displayed with the time slider to visualize vessels approaching and exceeding a speed of 8 nautical miles per hour.

Using this visualization, Bethany can identify problematic nearshore traffic patterns. In this example, she identifies these patterns around Florida and the Bahamas. This insight can be used to monitor vessel movement and implement speed limits to reduce the negative impact of wakes.
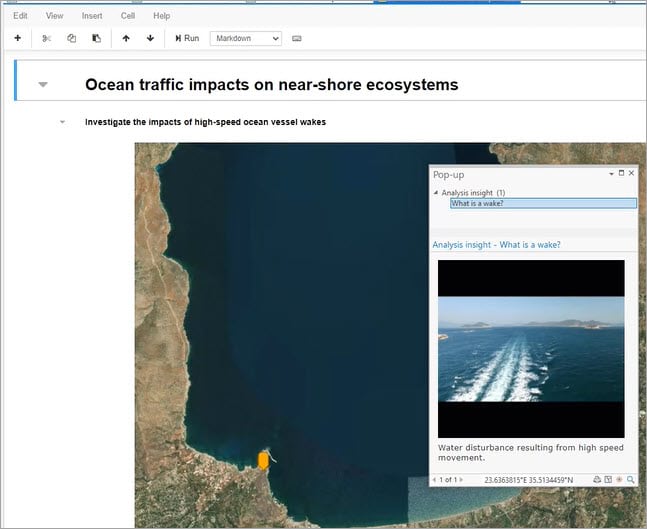
Bethany also demonstrates how this workflow can be automated using Notebooks in ArcGIS Pro. She uses ArcPy and embedded images to easily share her analysis story. The notebook is publicly available, so you can download it and try it out for yourself: Analyze potential impacts of ocean vessel wakes on shorelines.

This is just one example of how GeoAnalytics can accelerate your data preparation and analysis workflows. This large analysis was accomplished using GeoAnalytics Desktop tools and parallel processing on a laptop with 16GB and 4 cores. You can also complete this workflow in a distributed environment using ArcGIS Enterprise with GeoAnalytics Server.
Learn more
Check out the following resources to learn more about GeoAnalytics:


Commenting is not enabled for this article.