Transit data has arrived in ArcGIS! Transit systems play an important role in economic and community development, improving equity, revitalizing neighborhoods and reconnecting communities. In many parts of the world, public transport is the preferred method of commuting and transit accessibility is a powerful tool for climate action.
ArcGIS users have long asked for better access to transit data in support of their work. We listened! As of June 2024, the Community Maps program accepts transit data submissions. Once in the program, your transit data will be available across ArcGIS.
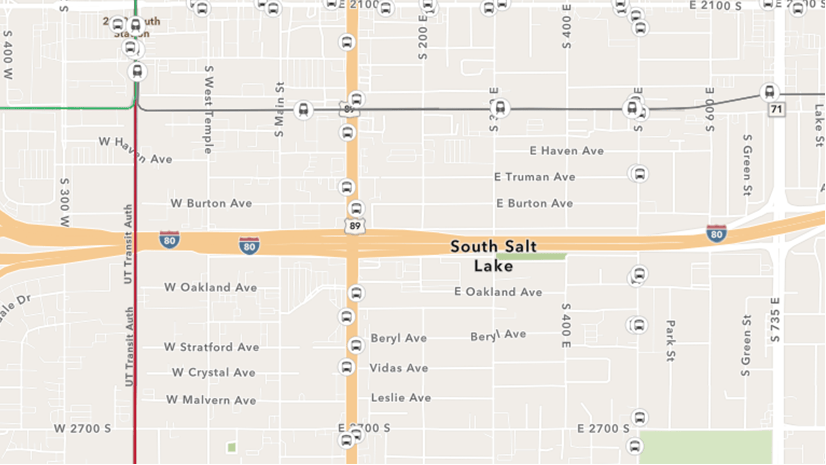
Transit GTFS data in Community Maps
GTFS (General Transit Specification Feed) is the industry standard for transit data, and while ArcGIS Pro has powerful tools for processing and mapping with this file format, collaborating across organizations and analyzing GTFS data has not been easy. Many organizations want to see transit data on ArcGIS basemaps and perform analysis without having to download and process files from open source libraries or manage licensing issues.
Enter the Community Maps program. It now accepts GTFS files directly, and when contributed, Esri converts them into feature services for both transit stops and routes. No user processing and no credit costs to host either. Once the feature services are created, any organization can access the data and benefit from feature services that merge multiple providers together, globally, and allow a myriad of opportunities to visualize and analyze the data in ArcGIS Pro and ArcGIS Online. Check out our instant app to view the layers in action! We will be continuing to build out these transit datasets over time.
Specific requirements can be found on the Community Maps Accepted Layers and Service page but read on to learn about this global initiative to open up GTFS to the entire ArcGIS user base.
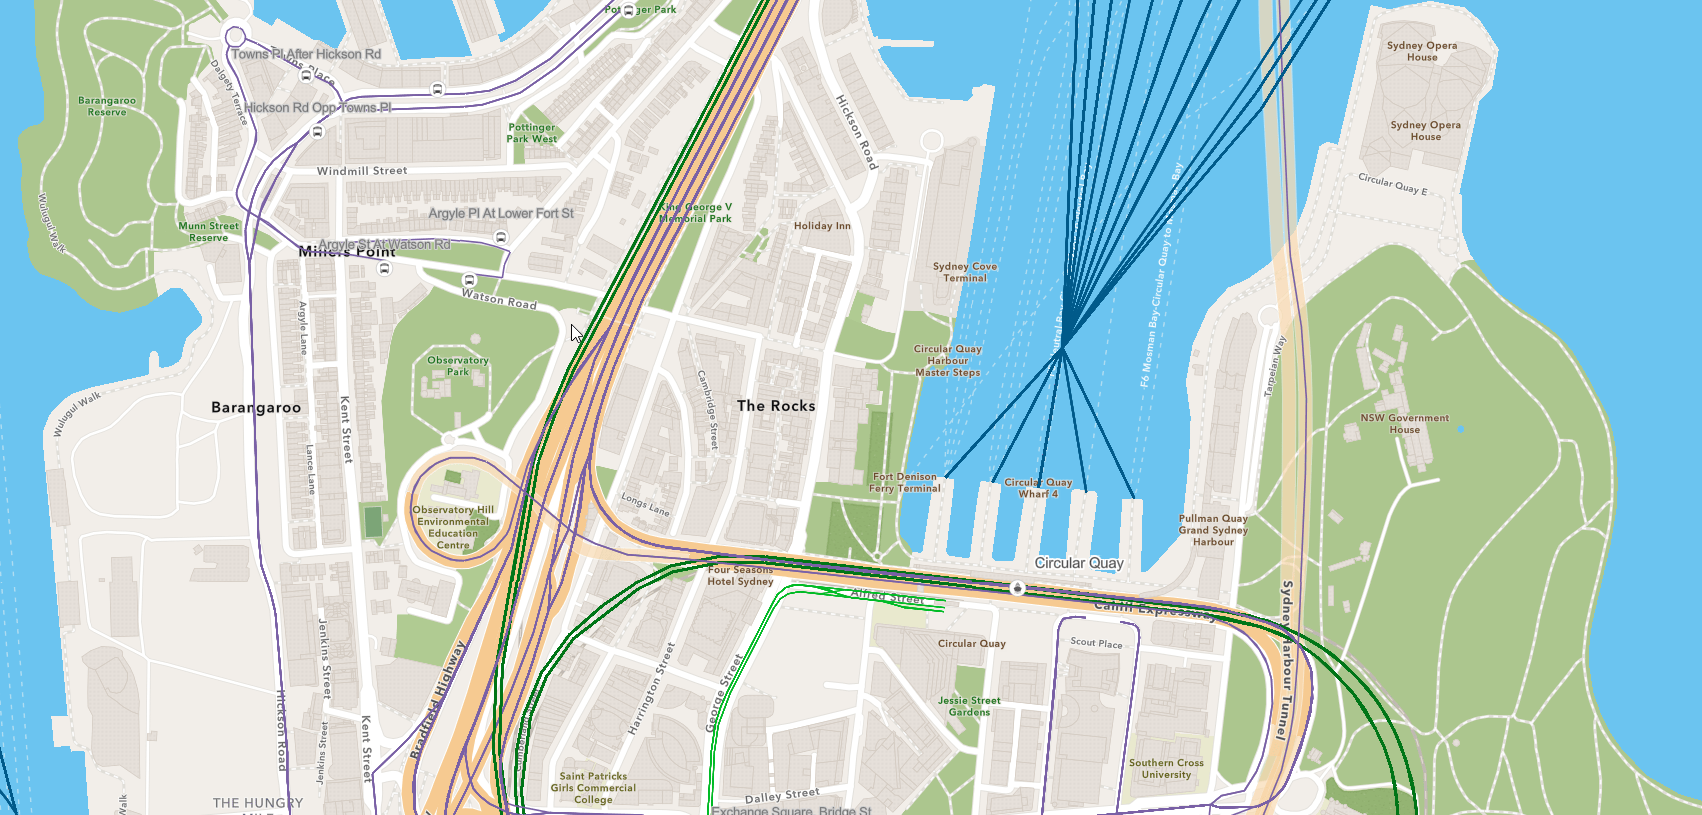
Why is this important?
Transit systems address a range of environmental, social and equity issues. They are central to dealing with traffic congestion and climate adaptation. Thousands of organizations have transit data but it’s often locked in specific consumers apps, dedicated transit tools and not easily accessible to a broader audience of GIS professionals, planners, governments, real estate developers and more.
ArcGIS has supported transit operations, safety, equity analysis, and management of station assets with local data for over two decades, but a coordinated atlas of transit data has not been created. While the ArcGIS Pro Public Transit Toolbox enables transit agencies to transform and manage their own GTFS assets, we know that there is a much bigger audience for this data.
How does this initiative work?
If your transit organization is interested in contributing data to the ArcGIS platform, the first thing is to register to become a contributor through Esri Community Maps. If your organization is already a contributor, then you can simply add Transit: GTFS to your layer list.

Once you are a registered contributor, then the next step is to package up all your GTFS files in a single zip file and upload it directly through the Contributor App. The specific GTFS tables required are detailed in our Transit GTFS Requirements.

From there, the Esri transit team will do the work of converting your GTFS data into ready to use feature service layers and maps.
Why should my organization contribute data?
This is a question that we hear a lot. What are the benefit to my transit organization? Why contribute when we have our own open data portal and/or hosted layers?
Here are a few answers:
- Esri will create stops and routes feature services and host in ArcGIS Online, where they can be discovered easily by millions of users, with all the benefits of the ArcGIS system.
- Your data will sit alongside other contributors in a consistent, global format, available as ‘ready-to-use’ layers with no hosting costs to you.
- Your organization’s data will be part of a standardized set of services and data schemas that build on the GTFS specification, which means consistency for all users accessing it. Organizations can build apps and users perform analysis confident that transit data is available in a common format worldwide.
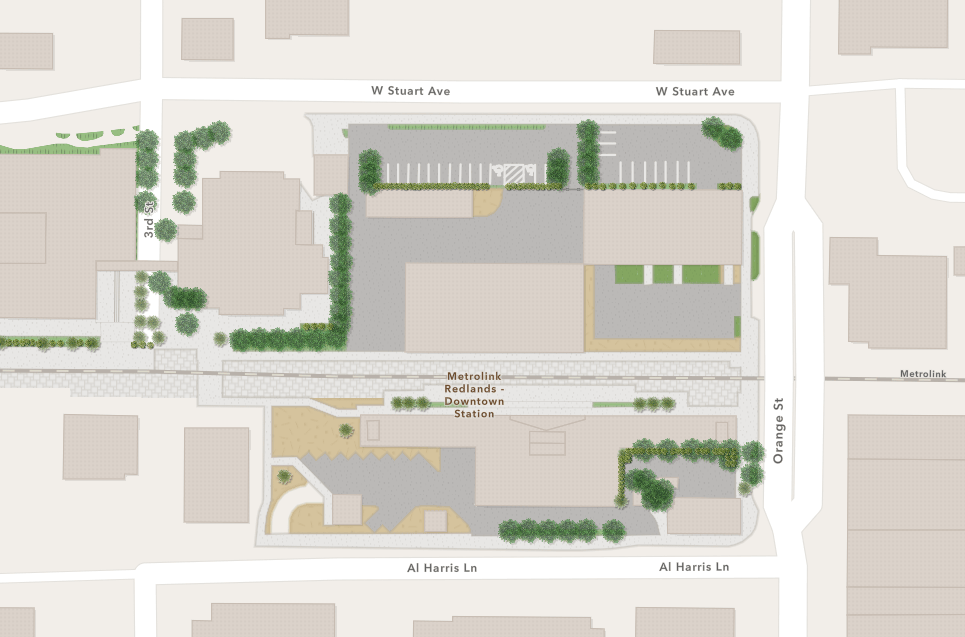
- Users can bring your transit stations to life by adding station detail through the Community Maps editor. In the example below, platform and landscape features have been added to the new Metrolink station in downtown Redlands, CA near Esri headquarters. These details become available in all the Esri basemaps once accepted.
Of course, your organization also gains visibility as a contributor to the basemap program every time your data is shown in ArcGIS.
What can users do with the data?
Transit layers available through the ArcGIS platform can be utilized in many ways, from simple visualizations to building proximity analyses, creating dashboards, and more.
Are you a real estate developer needing data to prioritize transit oriented development? A planning agency looking to improve livability, community vitality, and connectedness? Are you an environmental or AEC company working on infrastructure? Transit data from the Community Maps Initiative will add both rich locational context and a new set of analysis opportunities.

For ArcGIS users and contributing transit organizations alike, there is additional benefit in the ability to integrate transit feature services with other ArcGIS platform products like ArcGIS Survey 123 or ArcGIS Business Analyst.
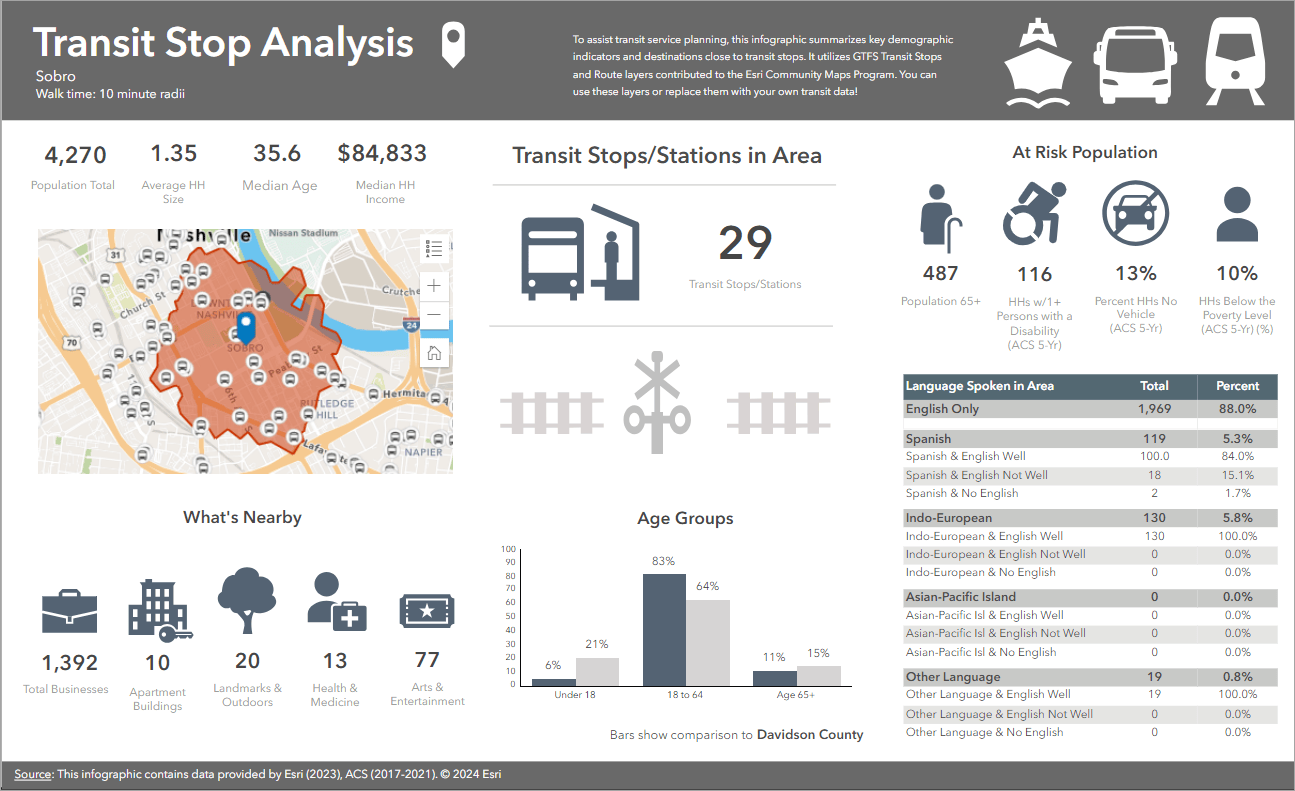
For example, if you have an ArcGIS Business Analyst license, you can build compelling infographics using the transit data coupled with Esri Demographics and Points of Interest data. Do you need to know how many businesses are within a quarter mile of a transit stop? Or the population of senior citizens in close proximity to one of your stations? Business Analyst has ready to use infographics and analysis tools to help you understand what’s around a stop or station. After creating a walk time, or creating a set of target transit stops, you can perform suitability or void analysis, create accessibility scores and much more.
More advance analysis and visualizations
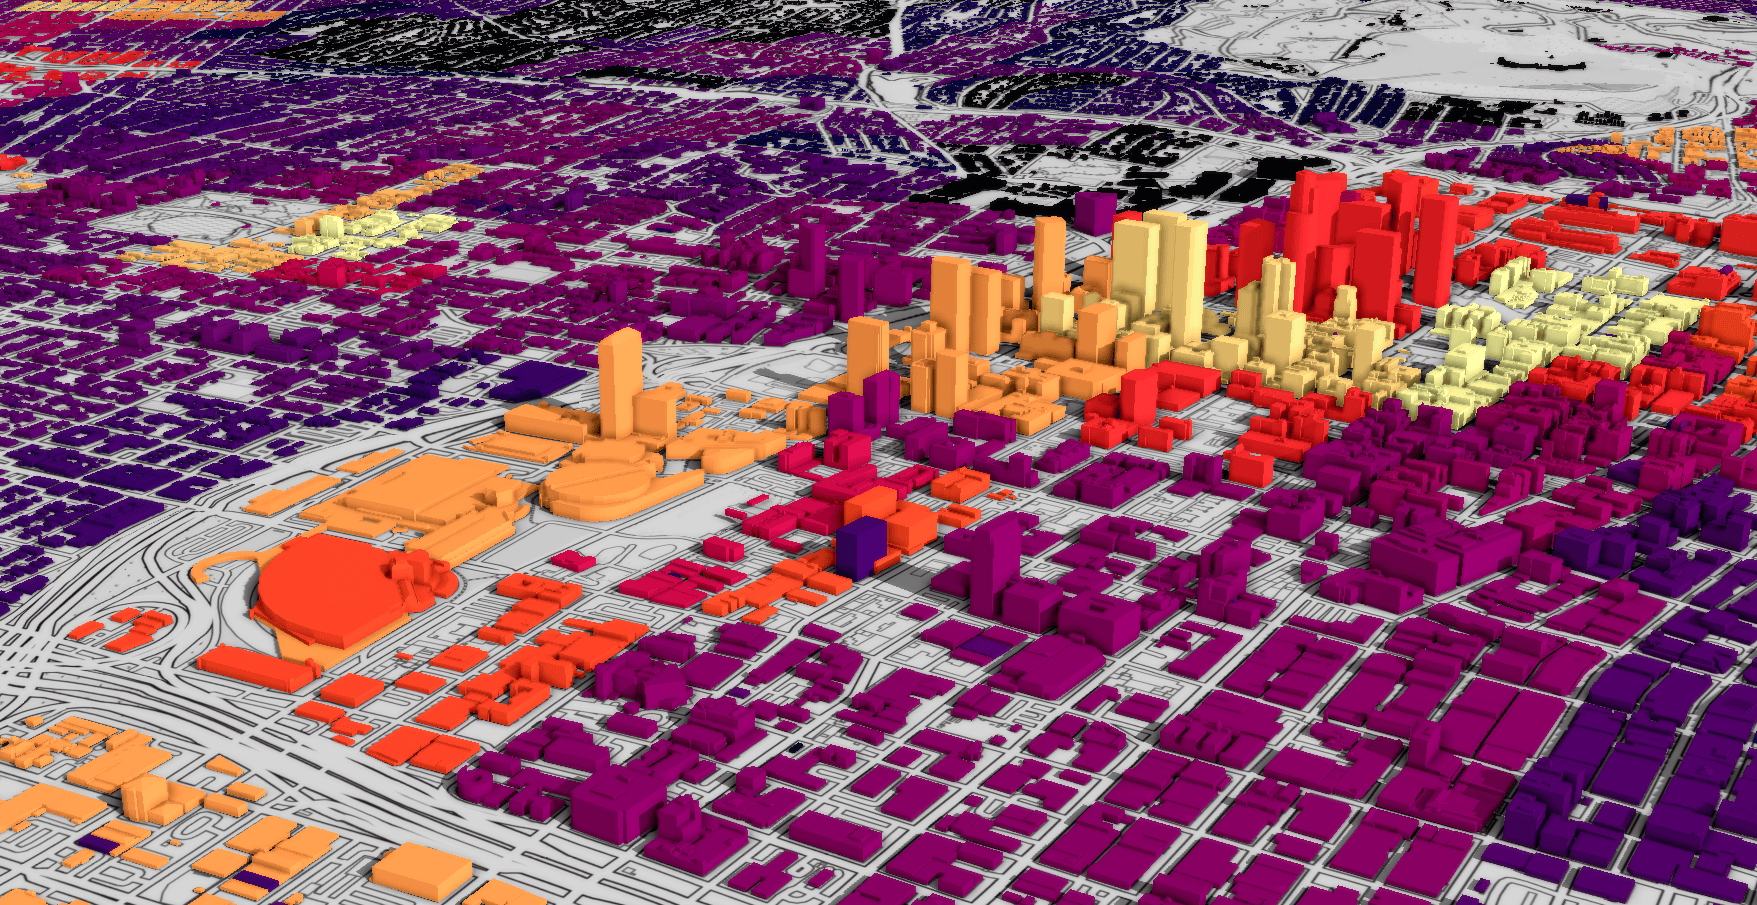
Once transit data is available, users can perform more advanced analysis and produce stunning visualizations. In the example below, transit accessibility has been modeled for and applied to more than 27 million buildings in Los Angeles, California. The brighter the color, the more accessible the building is. Neighborhoods and communities can be compared using this accessibility score, policies developed to improve them and organizations can benefit from government incentives to improve transit.
Summing it up
We are excited to get this new program underway, and hope that many organizations around the world will contribute and help us make the program successful. We know how important transit data in the ArcGIS platform is to many of our users and can’t wait to see how you make use of this new resource.
A special thank you to our initial transit contributors, especially to our pilot program testers who helped us get here: Los Angeles Metro, Nashville WeGo, and Utah Transit Authority.
Finally, this initiative would not be possible without the partnership of the Esri Community Maps program and Living Atlas team, Esri solution engineer and transit expert Cory Whittaker, project technical lead Joel McCune, and the rest of the Esri Transit team. A sincere thanks to everyone who made this happen!


Article Discussion: