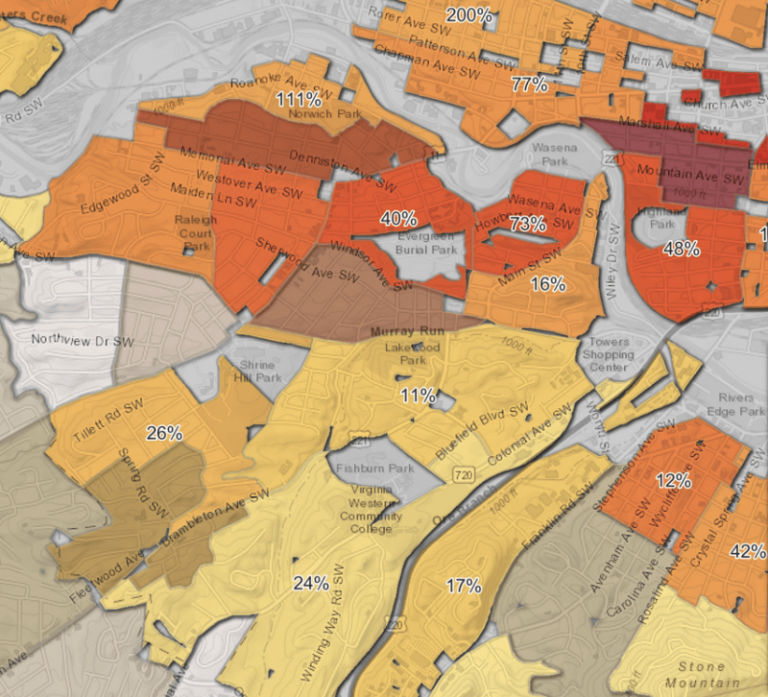
The November 2022 Map Viewer release introduces support for several capabilities which our web mapping community has long requested: viewing related records, defining symbology for values not yet present in the data, and an enhanced Add From File experience. Alongside these popular requests, Map Viewer advances the Arcade Editor to include a variety of modern expression writing tools to increase quality and speed. And among the Map Viewer team’s favorite updates: maturing the feature aggregation options by adding support for data binning, clustering with pie and donut charts, and improved heat map visualizations.
Quick Links
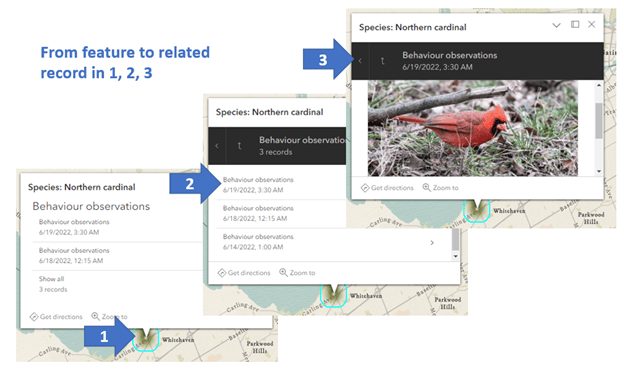
Accessing Related Records
So many workflows rely on examining a feature and its related information, from asset inventories and inspection records to historical tracking of demographic data. Map Viewer now offers out-of-the-box access to view and explore related records in popups.
For some users, this will open doors to brand new workflows and for others it may mean saving time by no longer managing Arcade expressions to achieve the same effect.
Read more about accessing related records in this blog: Rolling Out Related Records in Map Viewer
Symbology Updates
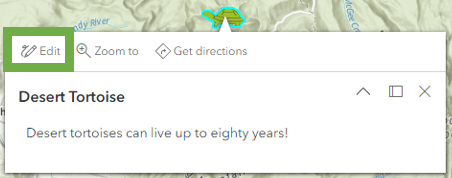
Fulfilling a long-standing request, you can now define symbology for values which do not yet appear in your hosted feature service. For example, if you are creating a map showcasing specific animal species but don’t yet have any data for Desert Tortoise – Gopherus agassizii, you can still author its symbology so it will appear in the legend.
Hatching now offers additional nuance for differentiating multiple values in your polygon data—you’ll find new controls to adjust both the separation between hatch fill elements and their offset relative to the feature itself.
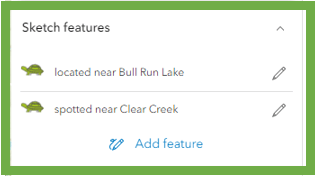
And with sketch features, you now have the option to add a title to individual features and you can now initiate sketch feature editing directly from the popup.
Arcade Updates
Map Viewer introduces a new Arcade Editor in November 2022, rebuilt to meet all expectations of a modern expression-writing interface:
• Auto-populated code suggestions based on data in the current map
• Search capability for functionals and constants
• Flags for unassigned variables
Read more about the new Arcade Editor here: Introducing the new Arcade editor in ArcGIS Online blog
In addition to the overall editor, you’ll find new Arcade capabilities in Forms, which now support FeatureSet, a collection of features which can be used as input to your expressions, allowing you to reference data from other map layers. For example, you can write an expression which auto-populates the “road name” attribute of a vehicle collision based on the “road name” attribute of the street centerline feature with which the point intersects
For more info, check out this blog: Catch more waves using Arcade FeatureSet expressions in Forms
Feature Aggregation
Visualizing large amounts of data (tens or hundreds of thousands of records) can present a challenge—you know there are trends in your data, a story to be told, but how can you style such dense data in a simple way which stakeholders can immediately understand?
The answer is feature aggregation—for a quick peek into aggregation capabilities, read on. And for a deeper dive, visit the blog Aggregation-o-rama! Binning, Clustering, and Clustered Pies now in Map Viewer
Clustering
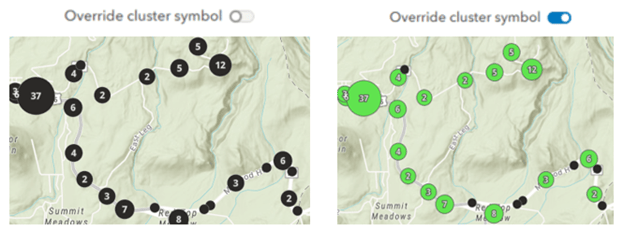
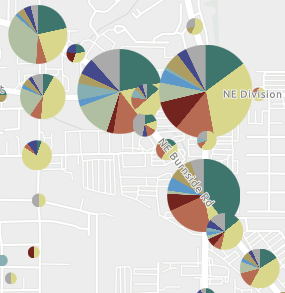
Some additions to clustering include: the ability to style non-clustered features separately, to visually differentiate them from clustered features; a new Clustering (chart) style to showcase the proportion of individual values within each cluster; and the ability to use clustering with different projections beyond WGS 84 and Web Mercator.
Heat Maps
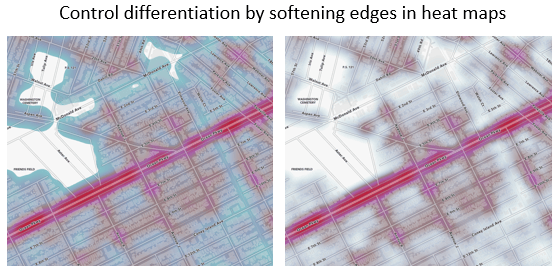
You can now control more of the story with heat maps, softening the edges between data values to reflect higher degrees of separation or sharpening the edges to show greater confluence.
Binning
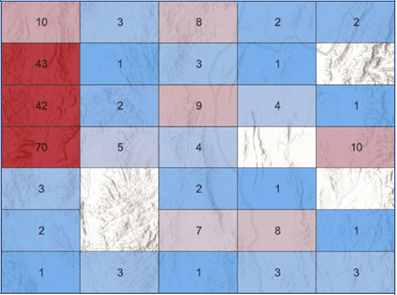
And the newest addition to the feature aggregation capabilities in Map Viewer is binning. This feature uses polygons of equal area and size to represent your data’s distribution continuously across your map area.
Adding a layer from file
And last but not least, a new and improved “add from file” experience directly in the map interface. Adding a layer to your map from a flat file is a smooth, consistent experience across multiple file types: CSV, Microsoft Excel, service definition, file geodatabase, GeoJSON, shapefile, KML, and GeoPackage.
This feature offers options between publishing as a hosted feature layer or uploading an item and referencing that item through its URL. In the latter workflow, subsequent updates to the item file will be reflected in the map—no need to recreate anything.
And whichever workflow you choose, you’ll find Smart mapping, filtering, styling, and all other layer capabilities are available for use; there are no feature limitations or special rules to remember for different formats.

Please keep the feedback coming; let us know how these enhancements and innovations have influenced your workflows and supported your stakeholders. Please be sure to post your ideas and pose your questions to the ArcGIS Online community pages.

Article Discussion: