The June 2024 Map Viewer update offers significant enhancements to the attribute table and data management, such as a brand-new field calculation experience and the ability to view related records in the table. Explore the improvements made with the table editing experience and learn how to manage your fields without leaving Map Viewer.
Additionally, take our new smart mapping theme, Reference size, for a spin! This new theme allows you to easily compare relative sizes across a dataset by introducing a fixed-sized outer ring. Not only does it allow you to visualize gridded and binned features in a new way, but it also has a very sleek look.
If you have any questions or comments, feel free to leave them on this blog, share on the ArcGIS Ideas site, or ask a question in Esri Community. We hope you enjoy these new features and as always, we’d love to hear how you are using these enhancements in your work!

Quick links
- Attribute table
- Data and field management
- Smart mapping and styling
- Imagery
- Catalog layer
- Analysis
- Filter
- Performance improvements
- Sketch updates
- Charts
- Other enhancements

Attribute table
This release includes quite a few updates to the attribute table for your feature layers as well as standalone tables. Read on to learn more.
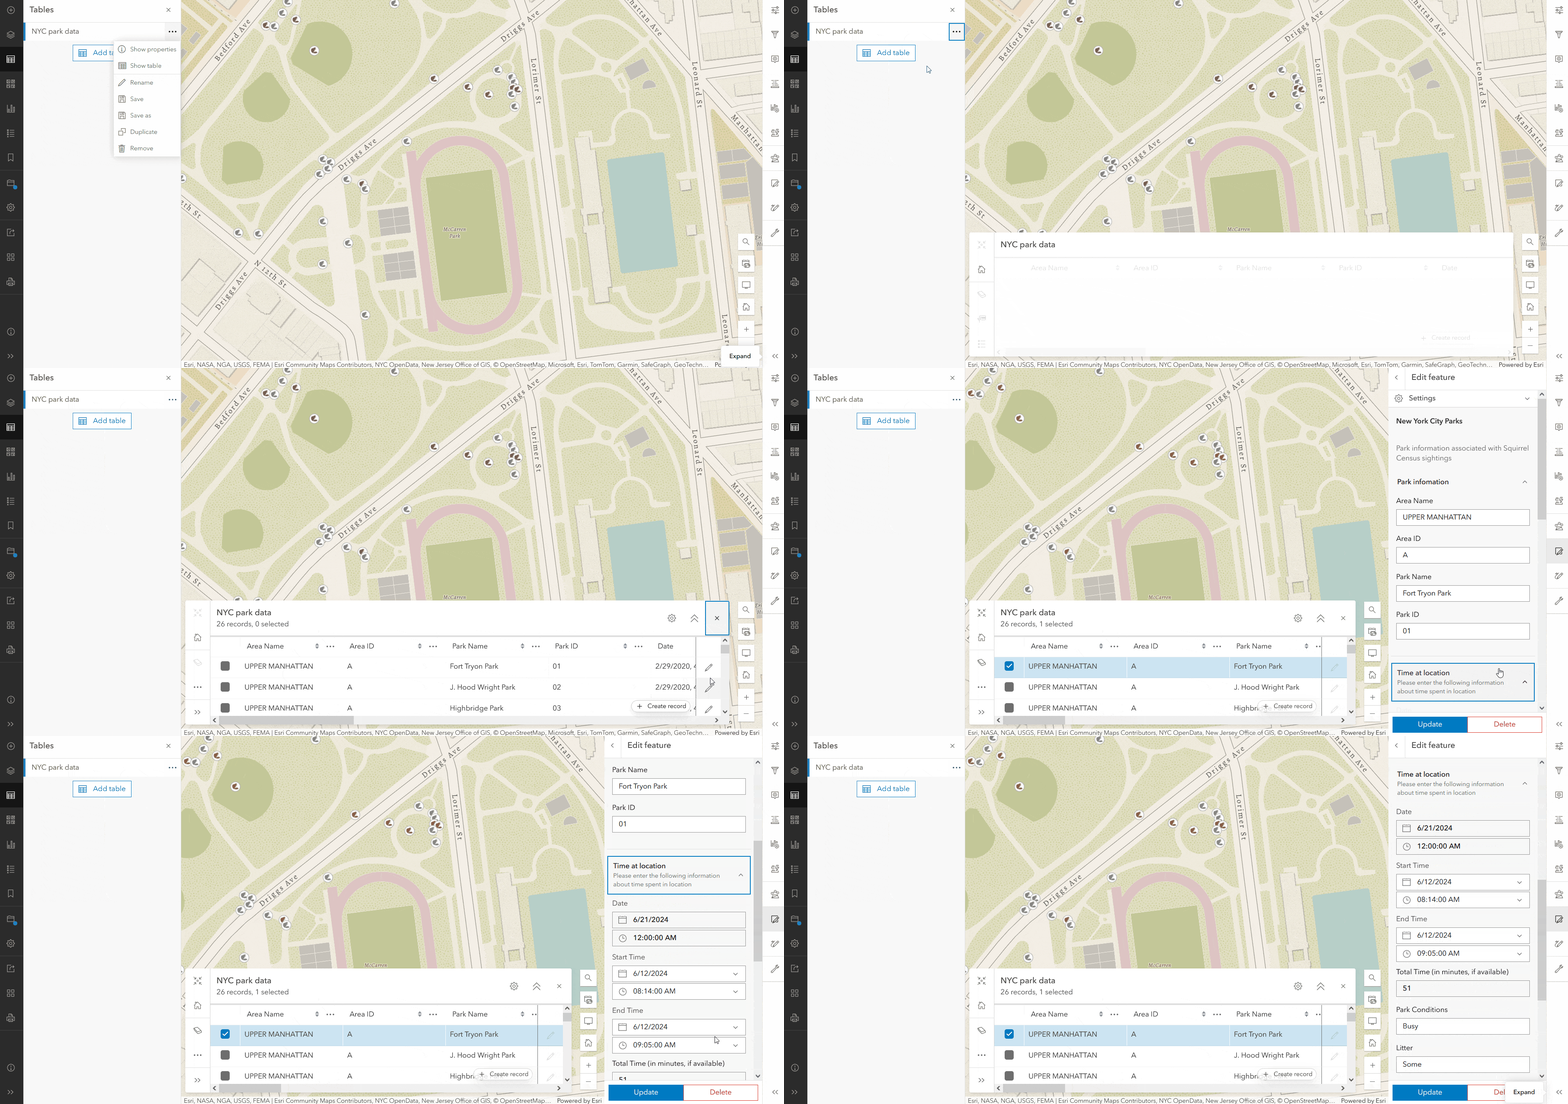
Editing in the table
The Editor pane can now be launched directly from the attribute table by either clicking the Edit  button for a desired feature or the Create button. The Edit button and Create button are available for both feature layers and non-spatial tables, meaning you can create, edit, and delete records in Map Viewer.

If multiple feature templates are defined for a layer, you will see a filtered list of available features to create. From here, you can begin drawing the feature geometry and filling out the attributes in the form.
To read more, check out the following blog article: Table for Two, Please.
Author forms on table layers
In addition to the enhanced editing capabilities for table records, you are now able to author forms for table layers in Map Viewer. Tabular data can to leverage all that forms has to offer in the Editor pane, including calculated expressions, conditional visibility, form inputs, and more.
Viewing related records
You can now view related records in the attribute table! When working with feature layers and map image layers that contain related data, you can see and explore relationships through the table. Simply scroll to the relationship field, then click on the link to view a filtered table of your related features or records. The table header also displays “breadcrumb” guides to navigate your way back to previously viewed relationships and tables.
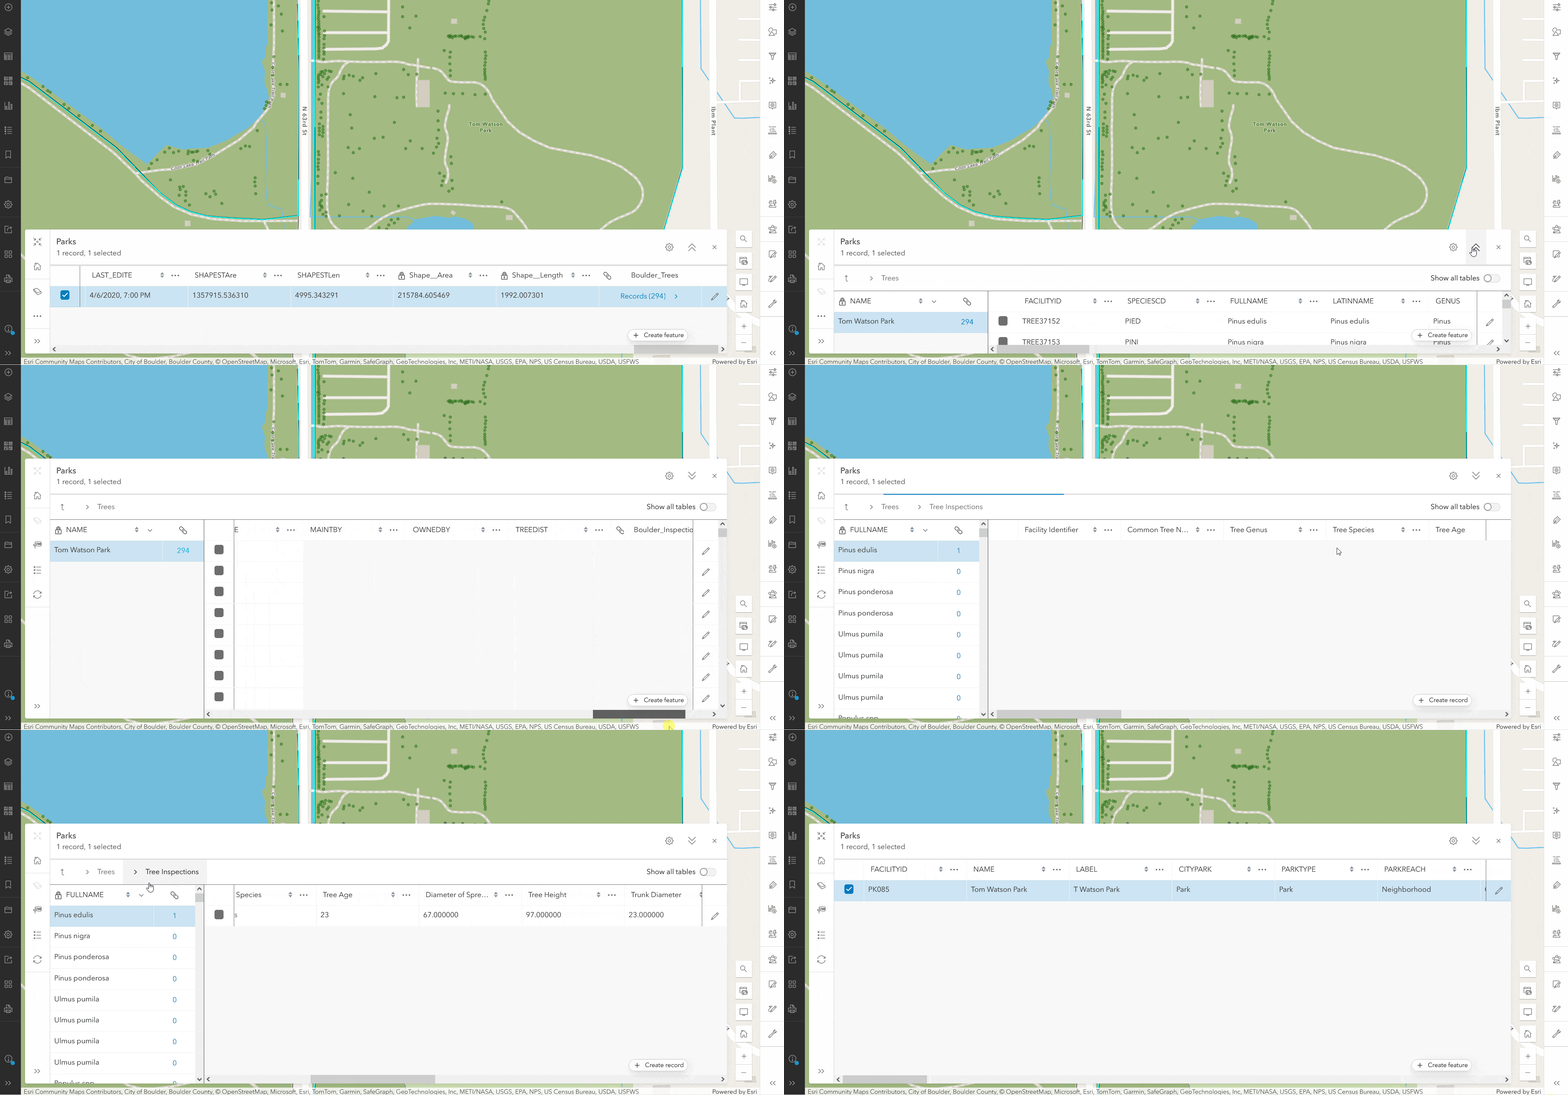
To learn more, see Introducing Related Records to the Table
Open the table from pop-up
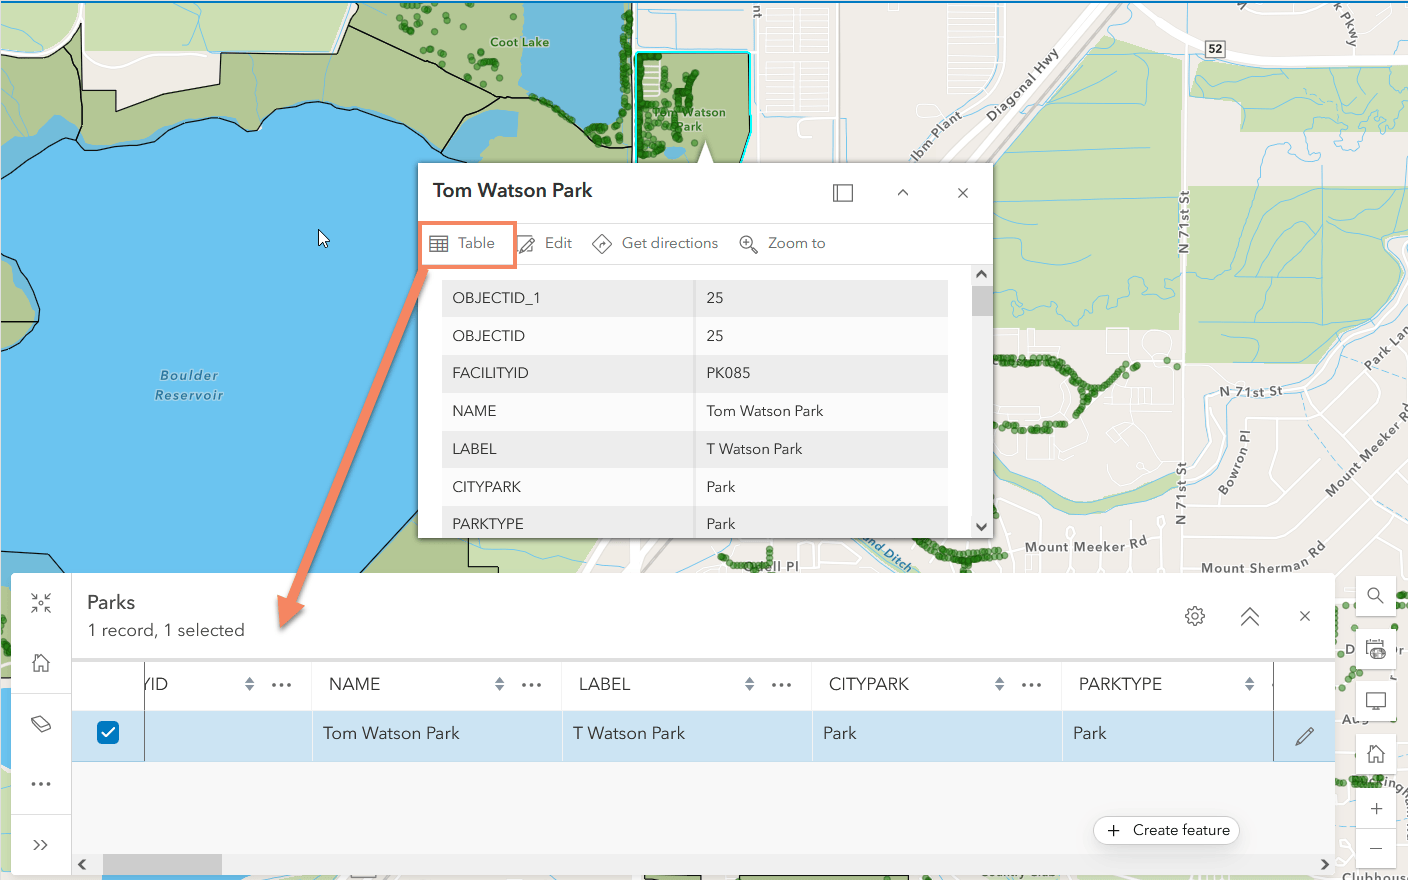
In addition, you can now open the attribute table for a selected feature directly from the pop-up. Rather than scrolling through the table or defining a filter on the layer, simply click and go. If the feature contains related records, they will be available when you open the attribute table.

Data and field management
The Map Viewer team is excited to announce support for field management and field calculation. The sections below cover each in more detail.
Add and delete fields
Previously, any field management for a feature layer was only available from the item page and in Map Viewer Classic. Now with the June 2024 update you can manage, add, and delete fields from the Fields pane in Map Viewer.
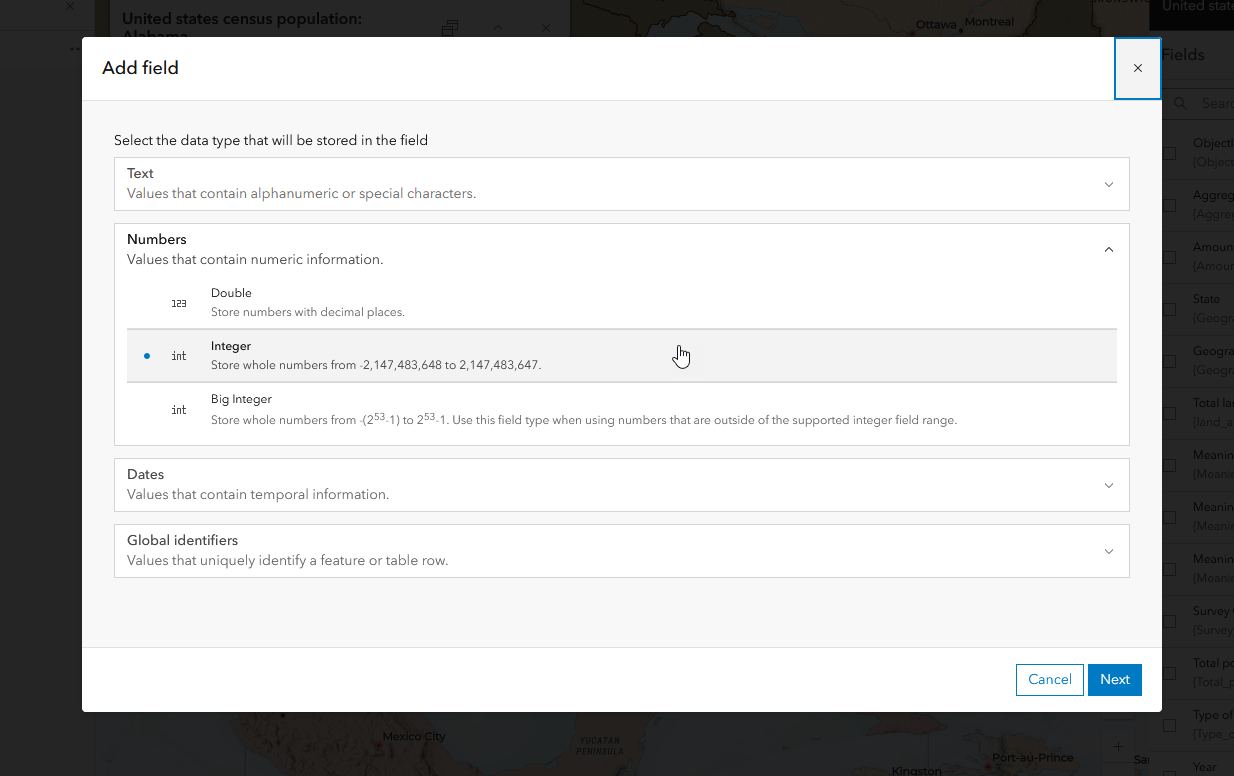
Check out Adding and deleting field in Map Viewer to learn more.
Field calculation
The Map Viewer team is excited to introduce the ability to calculate values for fields in your hosted layers and tables. While field calculation was available in Map Viewer Classic and from the Data tab previously, the June 2024 update introduces a new immersive calculation experience to manage your data with confidence. Easily filter data, visualize impacted features on the map, run test calculations, and download your field calculation script all without leaving Map Viewer.
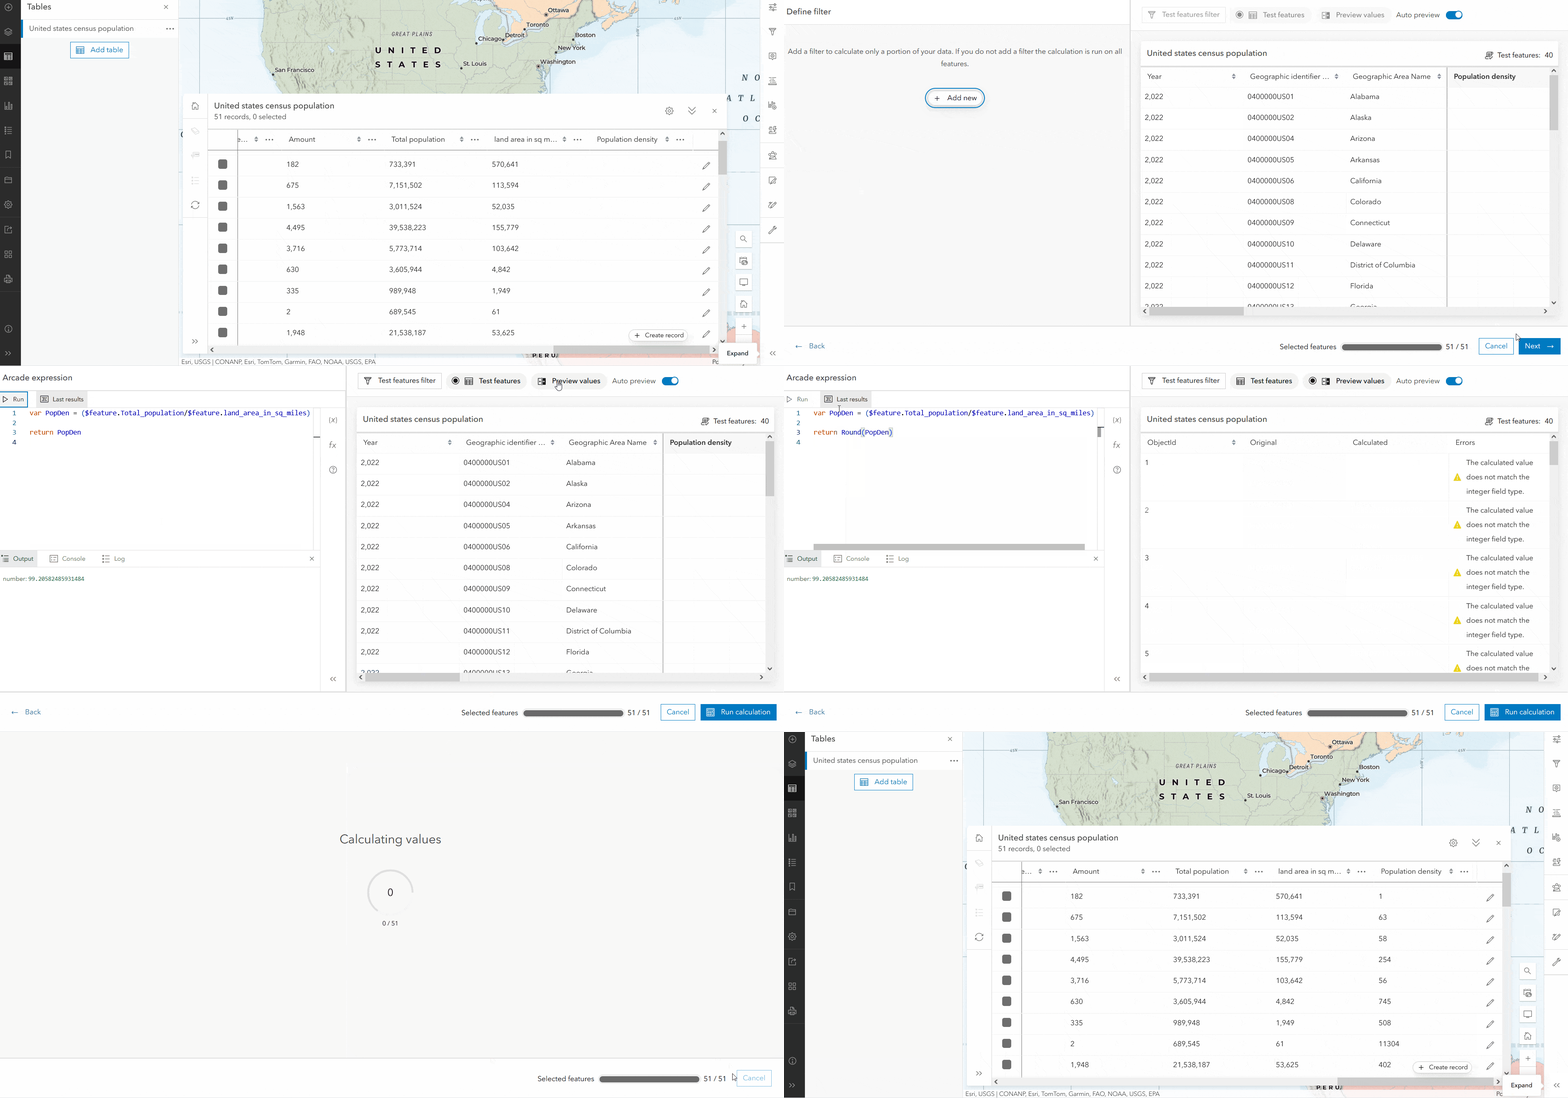
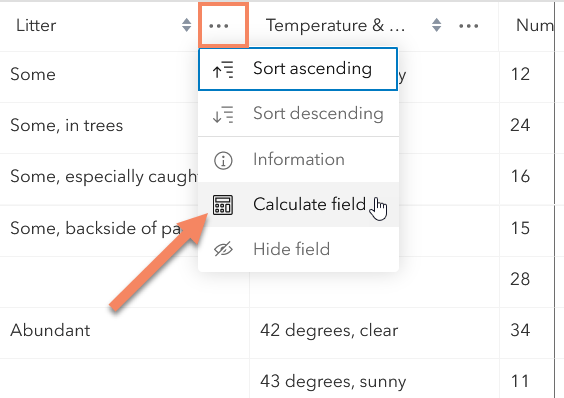
You can access field calculation by clicking the overflow menu for a field in the attribute table, then selecting Calculate field. Calculate field is available for feature layer owners or administrators.
To learn more, see Introducing field calculation in Map Viewer.

Smart mapping and styling
Read on to learn about updates to smart mapping, aggregation, and labeling in Map Viewer.
Reference size
Introducing the Reference size theme! This new theme allows you to visualize the proportional symbol bounded by a fixed-sized outer ring that makes judging relative sizes easier. Reference size can be found under the Counts and Amounts (size) theme drop-down, making it easy to apply without having to go into the configuration of the style. To get the most out of this theme, use it with binned features or gridded datasets.
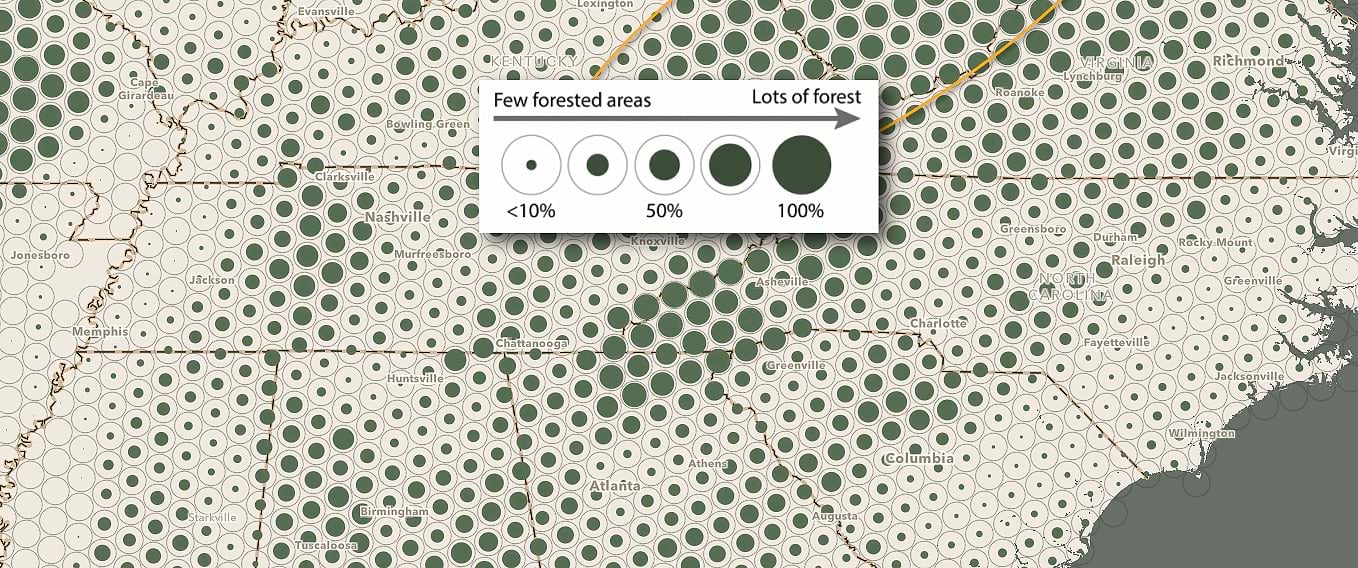
Reference size comes with five predefined shapes to choose from; circle, square, diamond, hexagon (pointy), hexagon (flat). This theme is also available with the following multivariate styles: Color and Size, Types and Size, and Relationship and Size.
To learn more, see Map Viewer Adds Reference Size Maps.
Aggregation
A custom arcade expression can now be used instead of an attribute field for labeling, pop-ups, and styling bins.
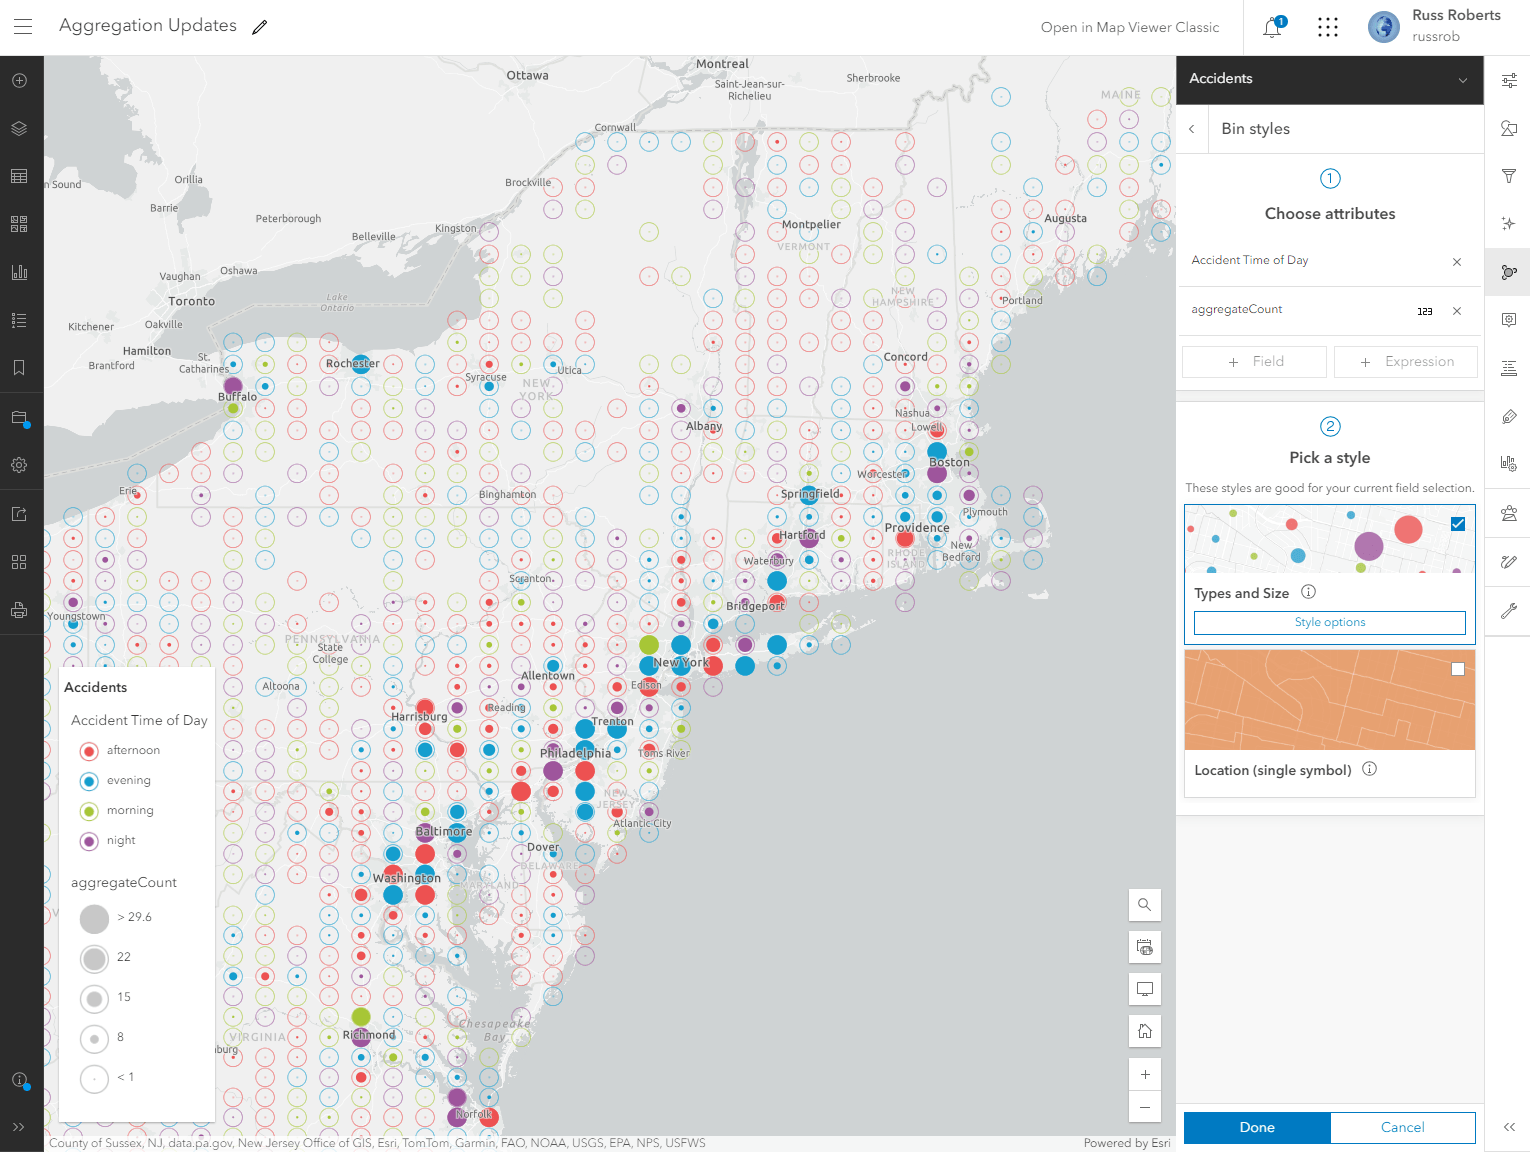
See Using Arcade with Aggregated Features in Map Viewer for more information.
Labeling
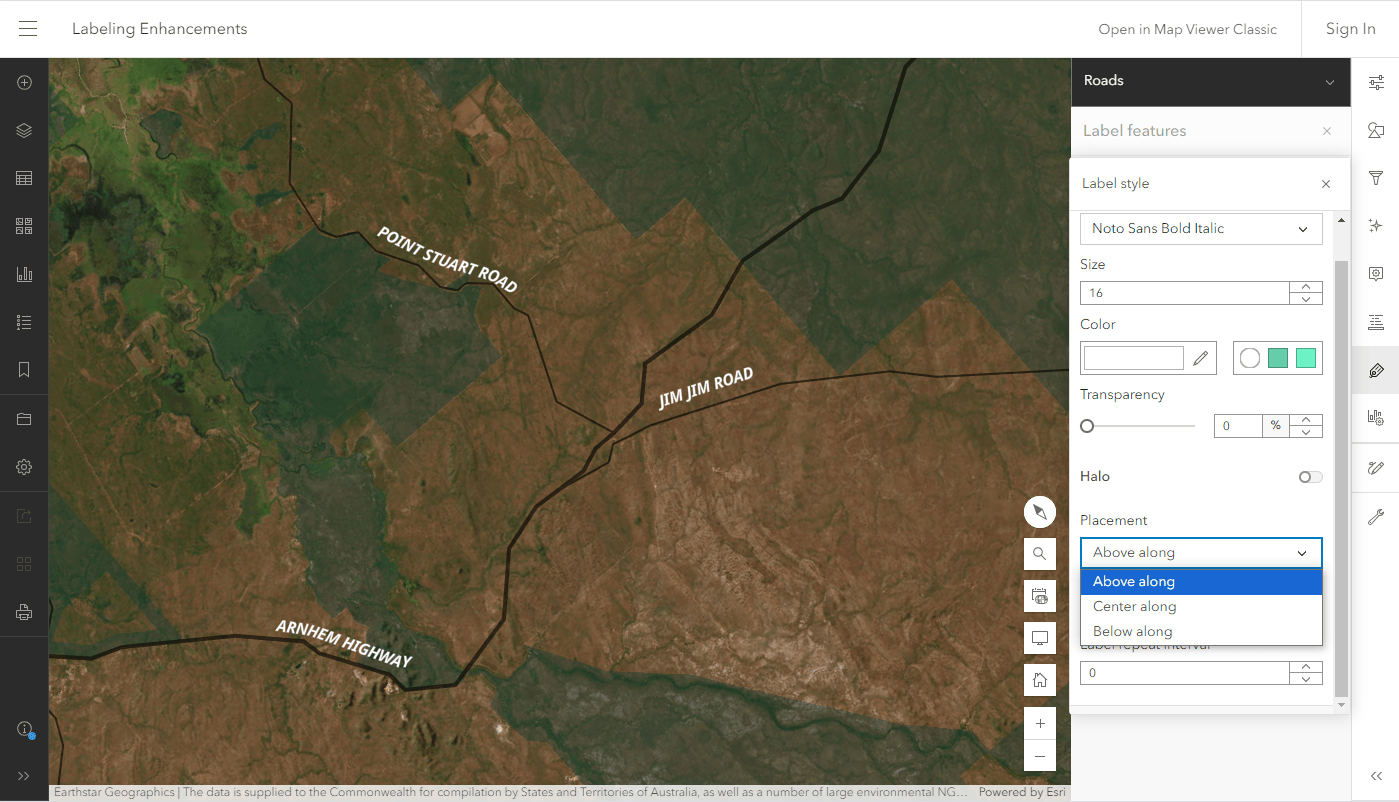
Elevate your web map labeling with a number of new enhancements, including advanced placement options like setting the label above, centered, or below a line feature. To start using label placement, expand the Label style menu and choose the desired placement option.
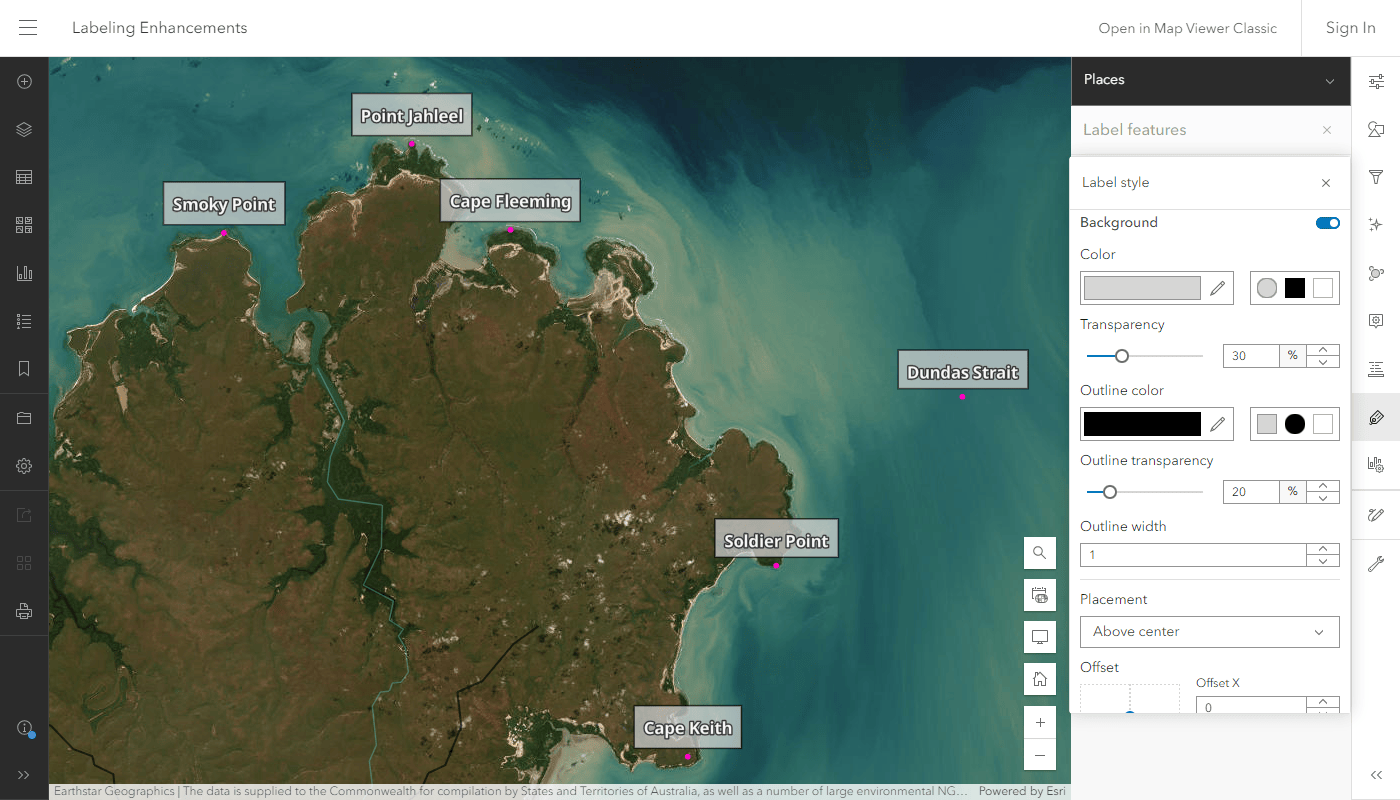
In addition to having more control over label placement, you can now add backgrounds for point and polygon features. This is particularly useful for busy web maps where labels may be difficult to read. Change the background color, outline, and transparency under the Label style menu.

Imagery
There are quite a few updates and enhancements related to imagery this release!
First, the licensing model for ArcGIS Image has been updated. Rather than requiring a user type extension, hosted imagery is now available to users with Creator, Professional, or Professional Plus user types. Image Analysis can now be performed by users with Professional or Professional Plus user types. Privileges can also be used to further refine access based on roles with these user types. For more information on ArcGIS Image licensing changes, see Navigating Updates: ArcGIS Image for ArcGIS Online.
Separate from licensing updates, there are other key enhancements for support for imagery layers included in the June 2024 update. For multidimensional imagery layers with multiple dimensions other than time, you can now configure each dimension and then animate them separately. Additionally, resampling type is now a configurable option available for imagery layers.
Oriented imagery layers have been enhanced to support Arcade, which can be used to style layers, create pop-ups, build label expressions and more. You can now also access an image’s pop-up from within the oriented imagery viewer by clicking on the image.
Finally, the June 2024 update includes user experience improvements for the Raster Function Editor, as well new parameter options for several raster tools and functions.
For more information, see What’s new in imagery in ArcGIS (June 2024).

Catalog layer
Catalog layers are a new layer type that offer unique functionality. They provide a dynamic way to organize, or catalog, other layers into a single browsable experience within a map. Layers in the catalog dynamically display as you pan or zoom, with corresponding footprints showing the extent for each layer. Any layer displayed in the catalog can easily be added to the map as a layer you can configure and save in the map.
For more information, check out Catalog layers in ArcGIS Online.

Printing
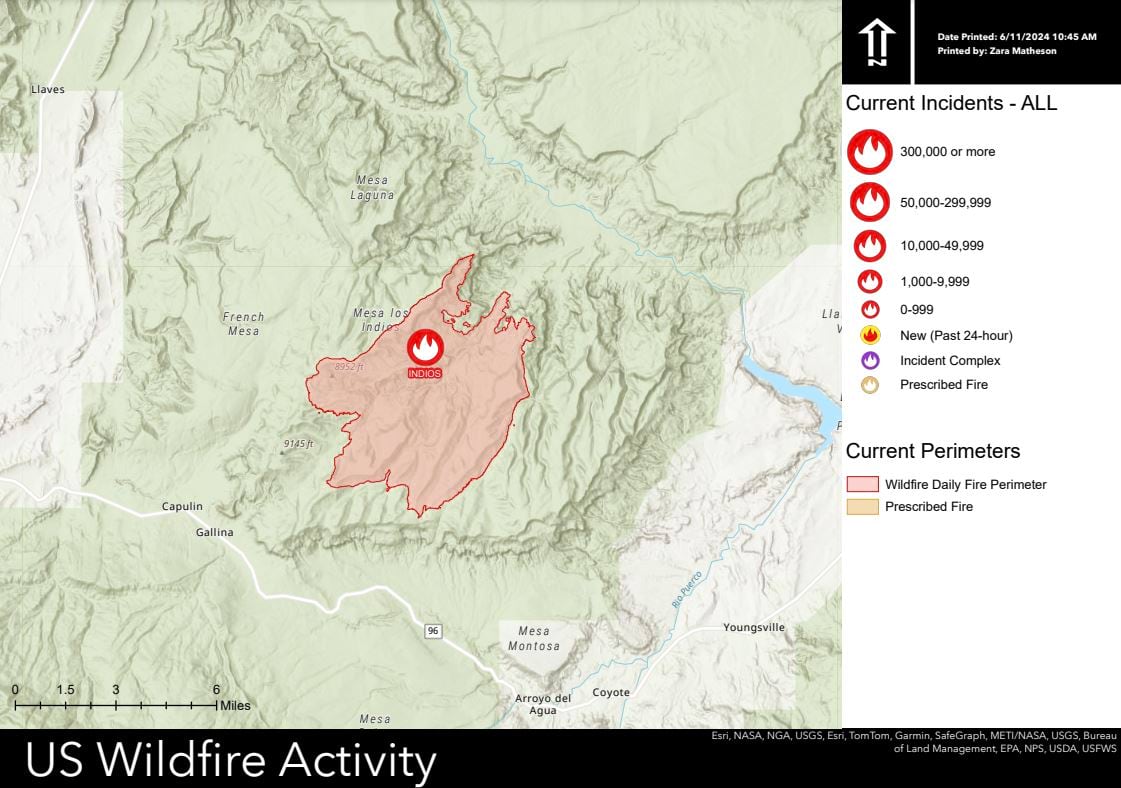
With the June 2024 update, Map Viewer allows you to print maps using custom layout templates. Organizational logos, themes, and other stylistic preferences can be defined beforehand as a layout item created in ArcGIS Pro, and added directly to ArcGIS Online. Printing from layout items is offered as an opt-in Beta program for users with Professional & Professional Plus user types.
Interested in previewing your map area before printing? The print tool is now offers a print preview option. This allows you to review the final extent of the map that will be included in the exported layout.
To learn more about how to set up and access print layouts, see our Print from layout items blog.

Analysis
Analysis includes updates across several areas this release, including the licensing changes and update to Raster Function Editor mentioned in Imagery above.
Custom web tools published from Notebooks can be run from Analysis now. There have been updates to several analysis tools including Join Features, Enrich Layer, and more.
For a full list of tool updates, see Analysis in Map Viewer in the ArcGIS Online What’s New blog. Additionally, check out New! Notebooks as web tools in ArcGIS Online for more information about custom web tools.

Filter
Check out the individual improvements that have been made to filter queries in Map Viewer.
Date queries in enterprise services
With the June 2024 update, you are able to create relative date queries on date fields from enterprise services that are 10.9.1 and up. For example, you can construct a query that filters features within a certain amount of days as opposed to defining a specific date.
New field types support
There have been continuous improvements to support the new time fields in Map Viewer. Date only field types now support using relative date queries to filter features in Map Viewer.
The Time only field type is now also supported when filtering features in Map Viewer. Time only fields are fully supported except for relative time conditions in queries.
To learn more about the new time field types, see Time is on Your Side with New Field Types in ArcGIS Online.
Define a time on Date fields
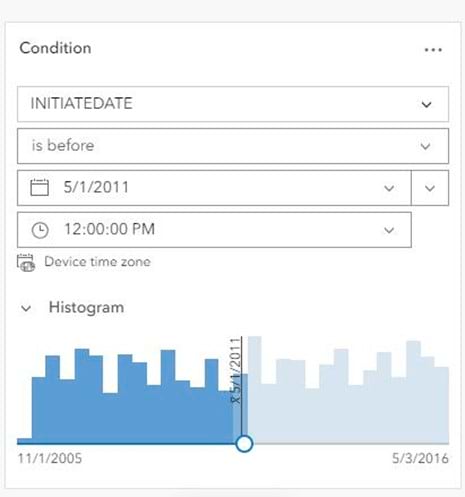
Need to fine-tune a filter query for a specific time of day? No problem! You can now filter Date fields based on the date and a definite time, allowing for more robust and complex filtering. For Date fields prior to this update you could only set the date with no control on the time aspect of your field.

Performance improvements
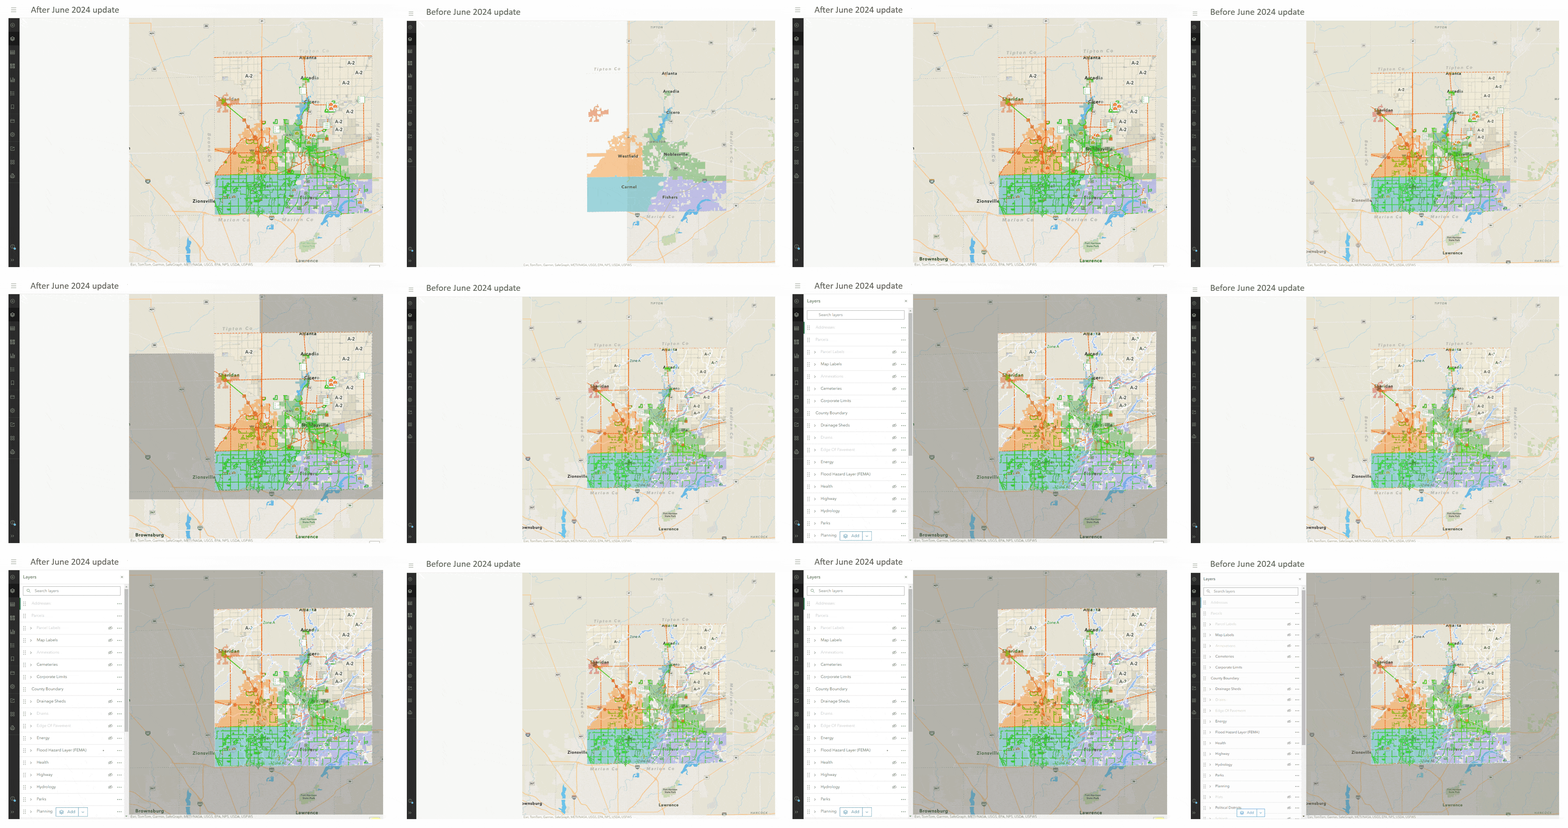
Blink and you’ll miss it! The performance when opening web maps with lots of layers has improved considerably with the June 2024 update. As evident with the image comparison below, the time to load layers in the Layers pane (and subsequent map interaction) is much improved for layer and feature-dense maps. Keep an eye out for additional performance improvements in future updates.

Sketch
In the February 2024 update, we introduced bulk actions when selecting multiple features of different geometries in Sketch (see What’s new in Sketch February 2024). We have continued to expand bulk action support to give you even more control over symbol modifications. For many symbol combinations you can now additionally change the color, outline, or fill.
Sketch also benefits from the label enhancements introduced, meaning you can now set the label background transparency and the background outline color and size when adding text features.

Charts
Map Viewer is proud to offer a new box plot chart option to visualize and explore your data. Similar to bar charts, box plots can have multiple series. The series can be displayed as side-by-side boxes or as mean lines. Box plot mean lines allow a user to visualize where the mean value of each series falls in relation to the total distribution of all the series combined. They show information about both the characteristics of each cluster as well as characteristics of each variable used in the analysis.


Other enhancements
Don’t forget to check out the other enhancements in other areas of Map Viewer as well, listed below.
Versioned data support
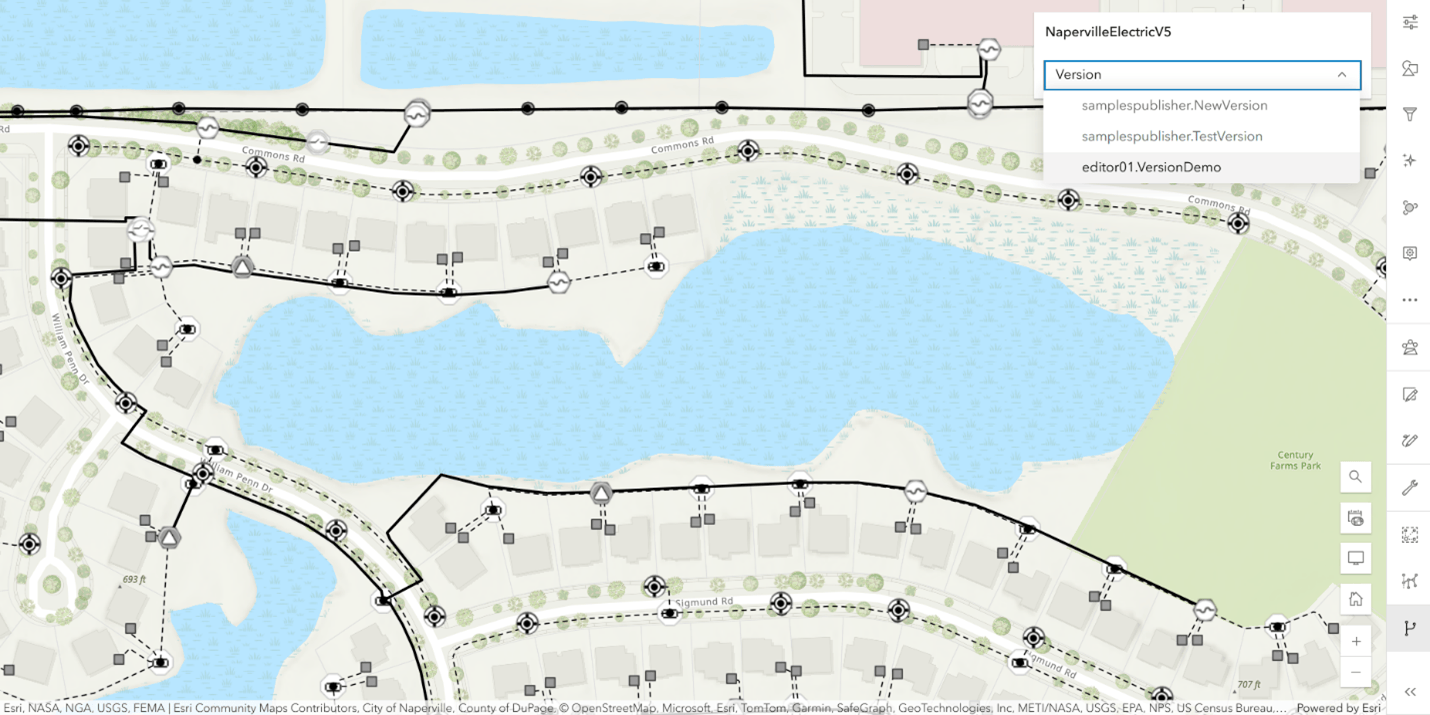
With the introduction of the Version Management tool in Map Viewer, you can now switch between a feature layer’s versions.
Switching between versioned data works seamlessly to visualize differences between versions.
With an Advanced Editing user type extension, you can also make edits to your versioned data, which creating new features, updating attributes, and removing any unwanted data from a selected version. The Version Management tool is available for any layer that has a VersionManagementService. Once the tool has been opened, you can search for and switch versions from the drop down list. Once a version has been selected it will remain visible on the map until the page is refreshed.
Pop-ups
Have related records in your Map image layers? With the June 2024 update, we now allow configuring and viewing related records in Map image layer pop-ups.
Pop-ups have additionally introduced support for a handful of new HTML tags like <details>, <blockquote>, and <main> to list a few. For a full list of available HTML tags, see the supported HTML documentation.
OGC WMS
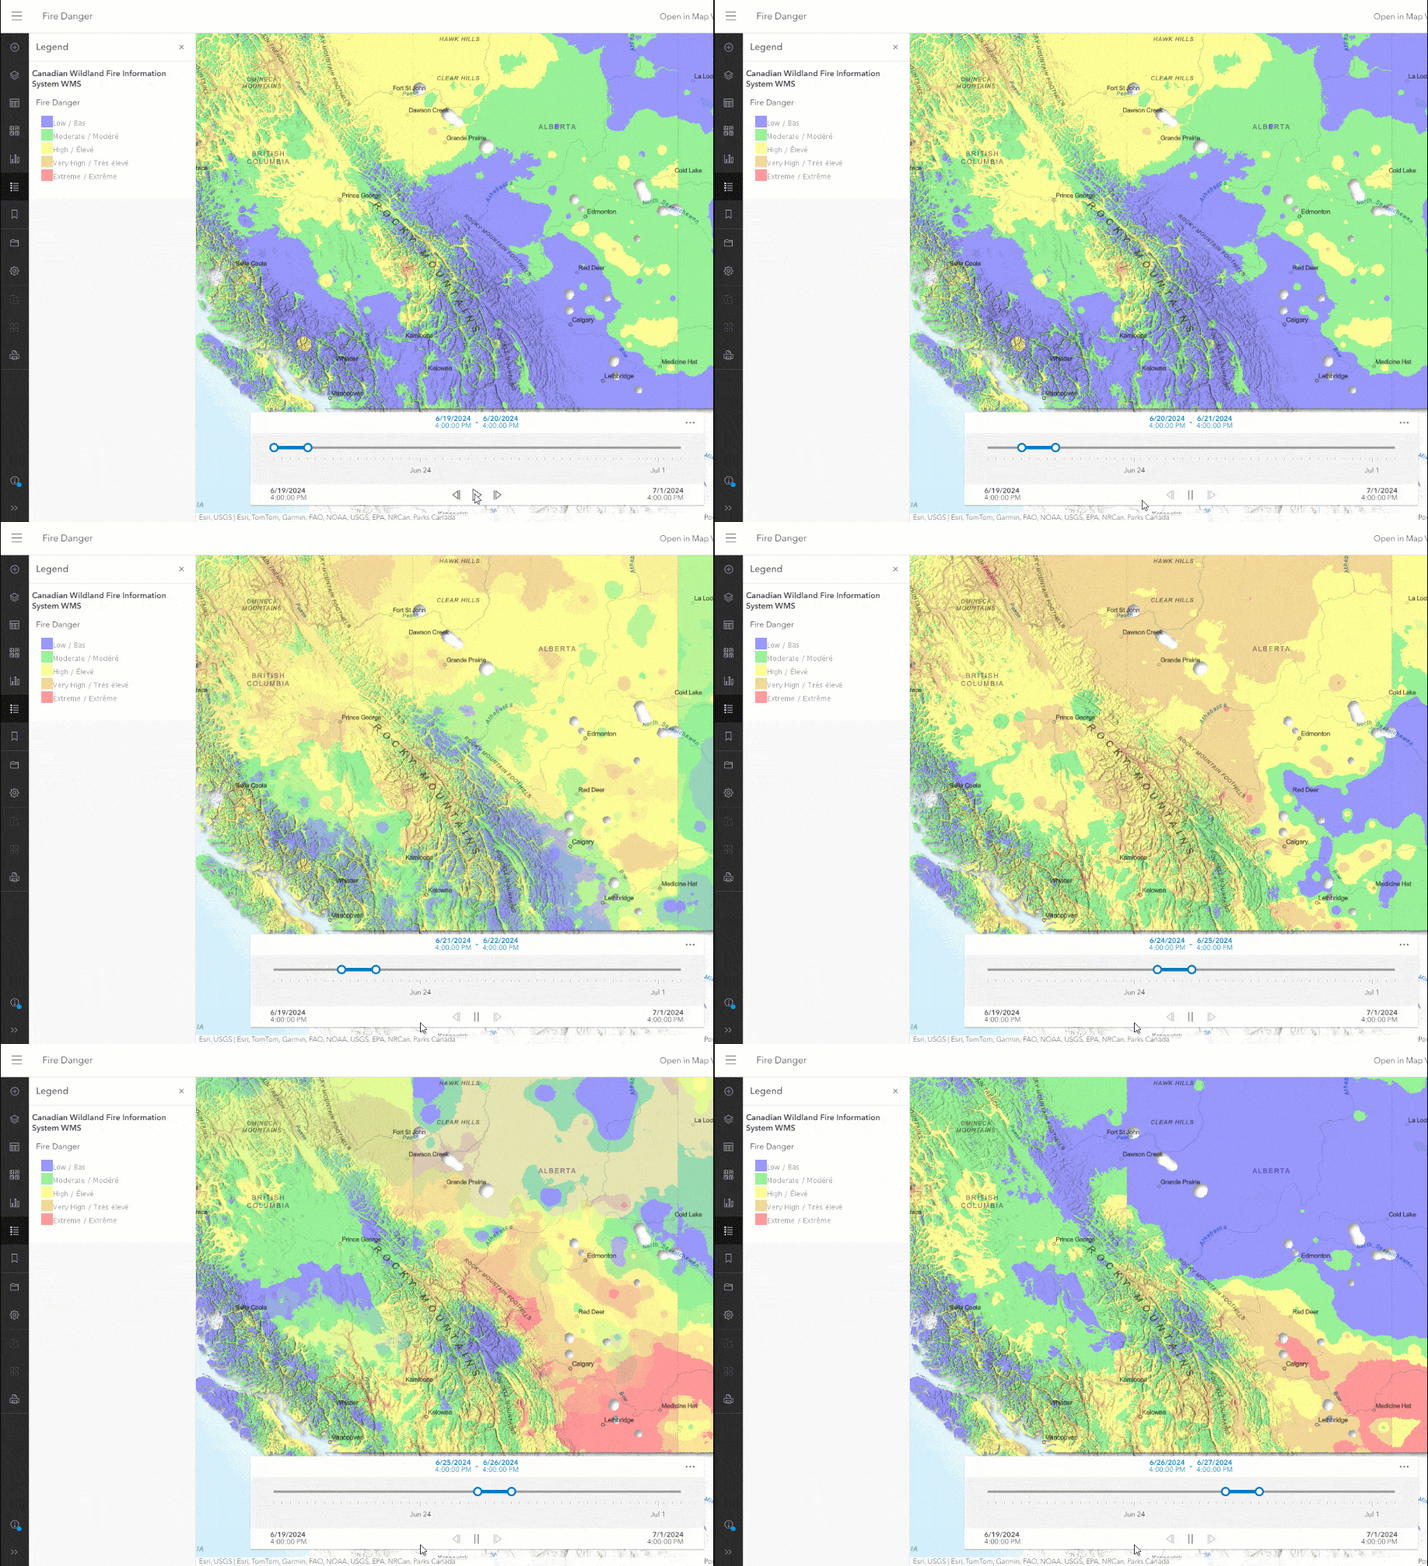
Time is now supported for time-enabled WMS layers. The time slider automatically displays if the WMS supports time. Time can be configured and saved in a map similar to any other time-enabled layer.
Date field support
Date only, time only, timestamp offset, and big integer field types are now recognized when publishing a hosted feature layer in Map Viewer through the Add layer from file experience with the following file types:
- Microsoft Excel
- Comma-separated values (CSV)
- GeoJSON files.
To learn more about formatting and requirements, see Date and time fields in ArcGIS Online.
Summary
The June 2024 update of Map Viewer introduced many powerful features that we hope will continue to push your work to the next level. As mentioned above, we love to hear feedback on these enhancements and see what you make with them. We are looking forward to chatting with many of you in a few weeks at the 2024 Esri User Conference. Until then, happy mapping!


Article Discussion: