It’s a new year, and a new update of Map Viewer! The February 2025 update of Map Viewer has exciting enhancements in editing, styling and symbology, and more. You can now create and manage feature templates directly in Map Viewer, improving data quality and reducing time inputting values. Read on below to learn how to take advantage of this capability.
Additionally, take your maps to the next level with animated symbols in Map Viewer. Animated symbology is an engaging and powerful way to draw attention to key areas of interest in your data. Not sure where to start? We’ve got you covered with a variety of ready-to-use animated symbols.
Have any questions or feedback? Share an idea on the ArcGIS Ideas site or post a question in Esri Community. As always, we’d love to hear how you are using these new features in your work. Until the next update, happy mapping!

Quick links

Editing
Feature templates
Create and manage templates for layers that you own or have privileges to manage without leaving Map Viewer! Feature templates are a powerful way to retain data integrity and create a consistent editing experience. Click Templates to enter a title, description, and any default attribute values to be included in the template. Once you are satisfied, save and exit. Now anyone editing that dataset will be able to choose from pre-configured templates.
If you have a Types (unique symbols) style applied to your feature layer, you can additionally sync up your templates and symbology. This makes it even easier to keep editing in sync with the layer symbology.

For more information on creating and editing feature templates, see Optimize Editing by Managing Templates in Map Viewer.
New drawing tools
The editor now supports additional drawing tools when creating polygon and line features. Choose from the new freehand, rectangle, and circle drawing tools to make sketching even easier.
If your feature template has a default editing tool defined, this will be automatically selected in the toolbar.
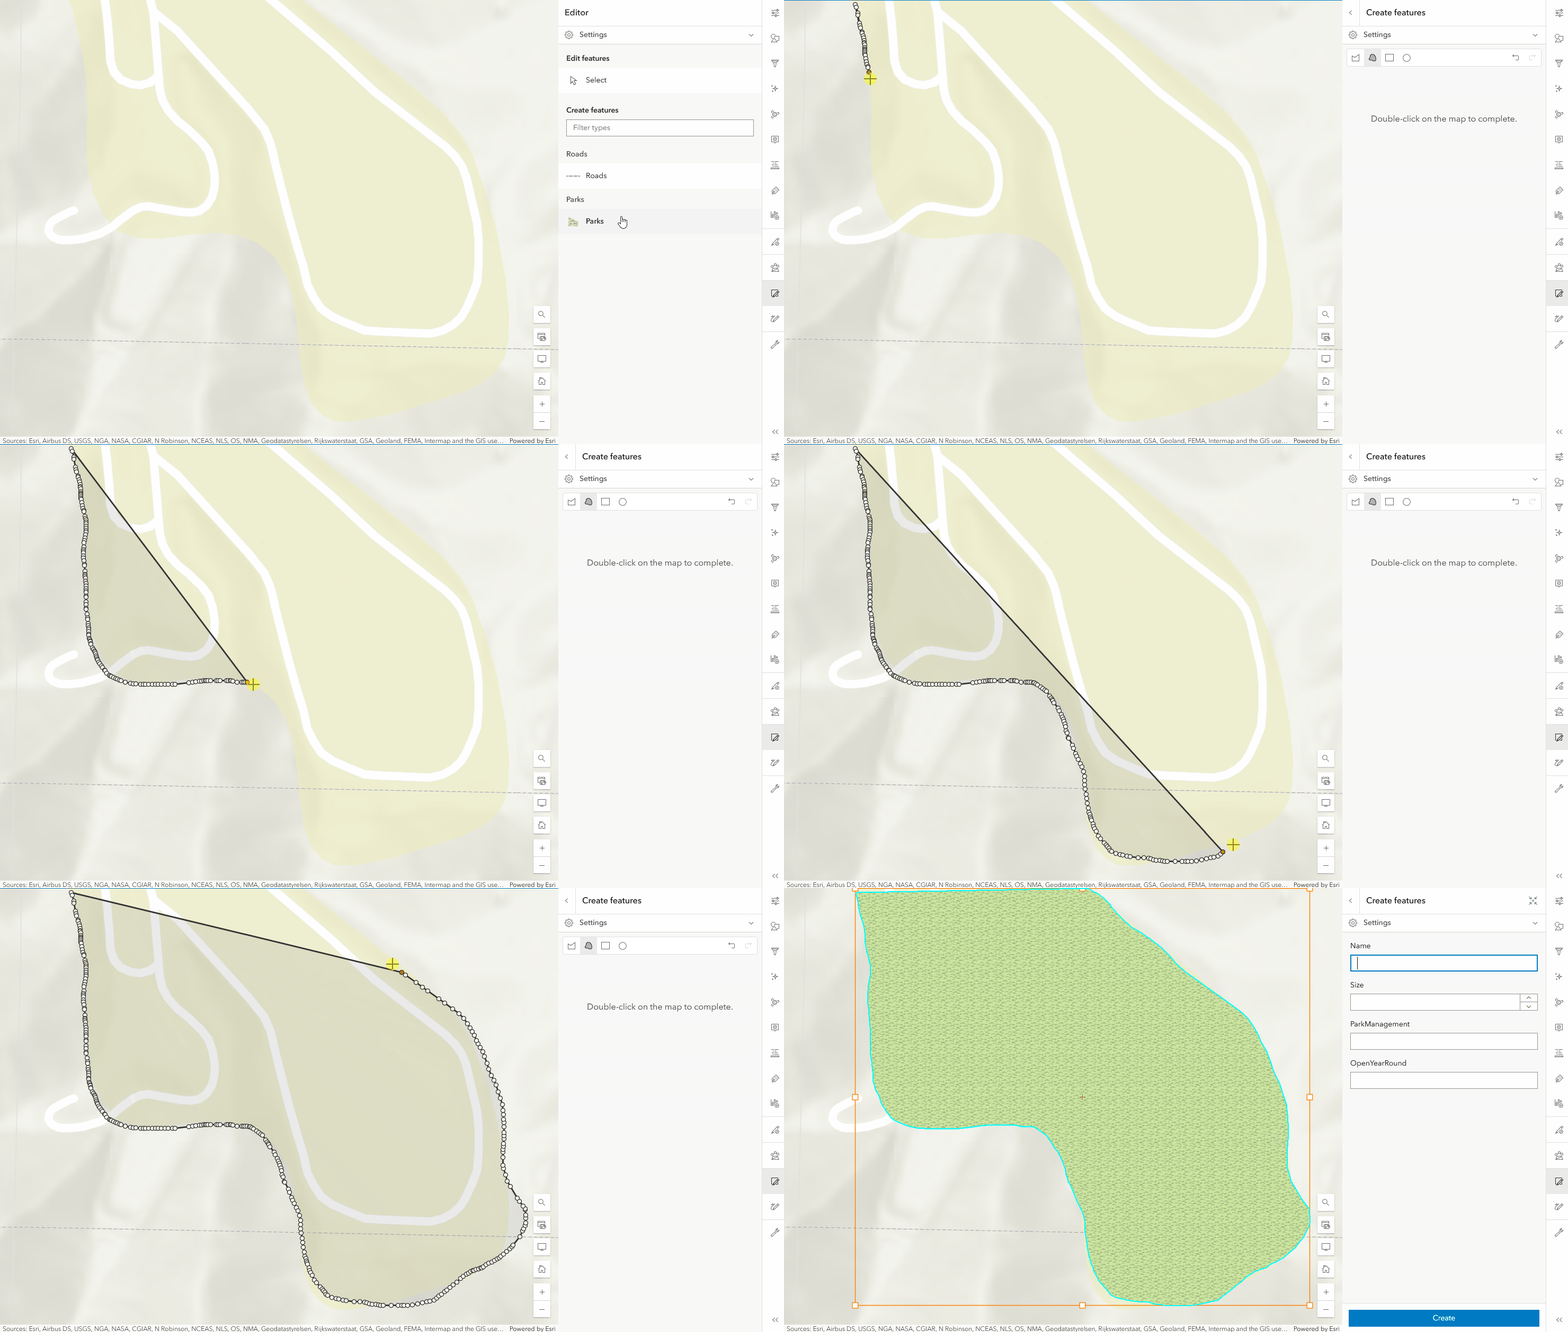
Improvements while creating multiple features
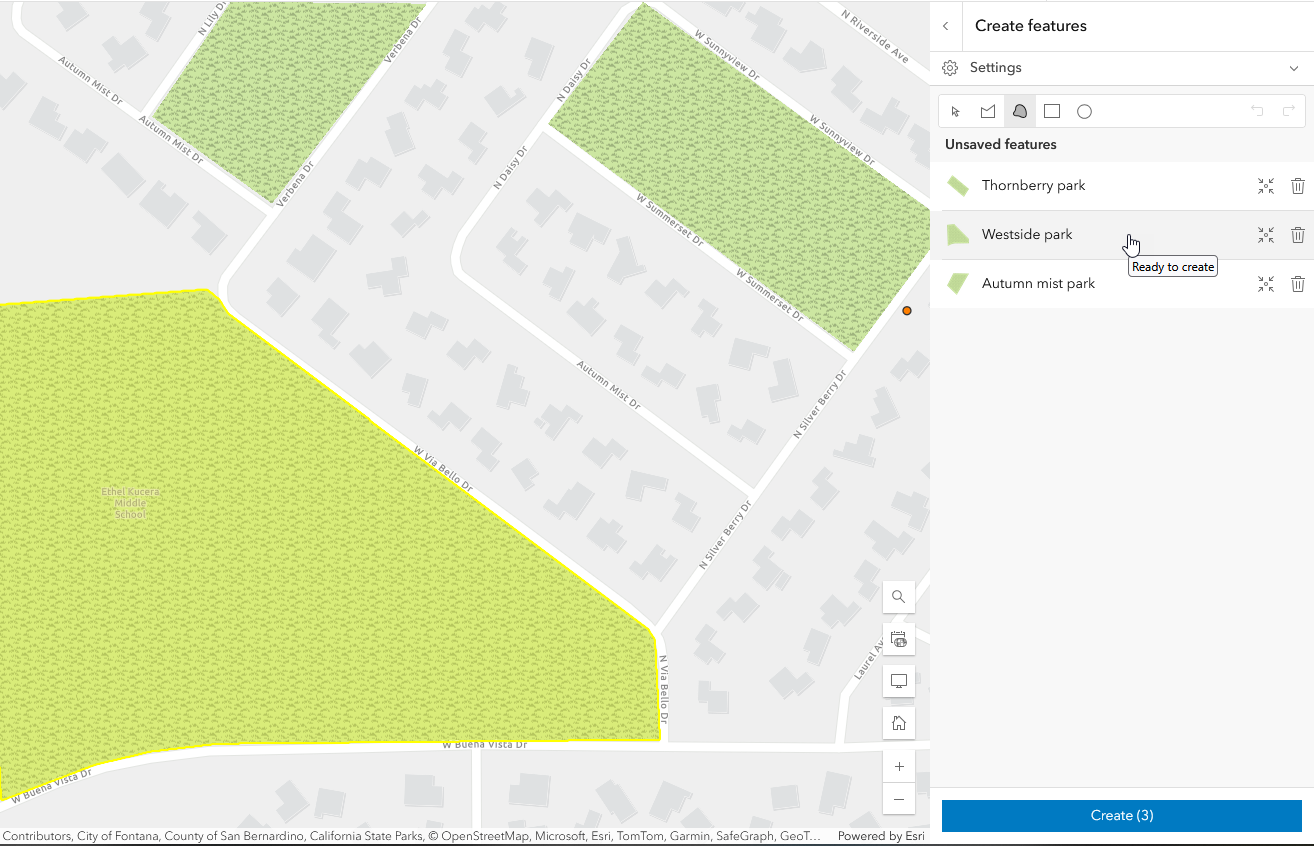
Map Viewer has supported creating multiple features at once for some time, but as of the 2025 February update there is now a simplified list to review and update pending features. Hover over the features list to see the corresponding geometry highlighted on the map. Easily zoom to or delete a feature using the actions on the right or select a feature to view any associated attributes. To view the pending features list, click the “back” button after drawing a feature on the map.

Styling and symbology
Animated symbols
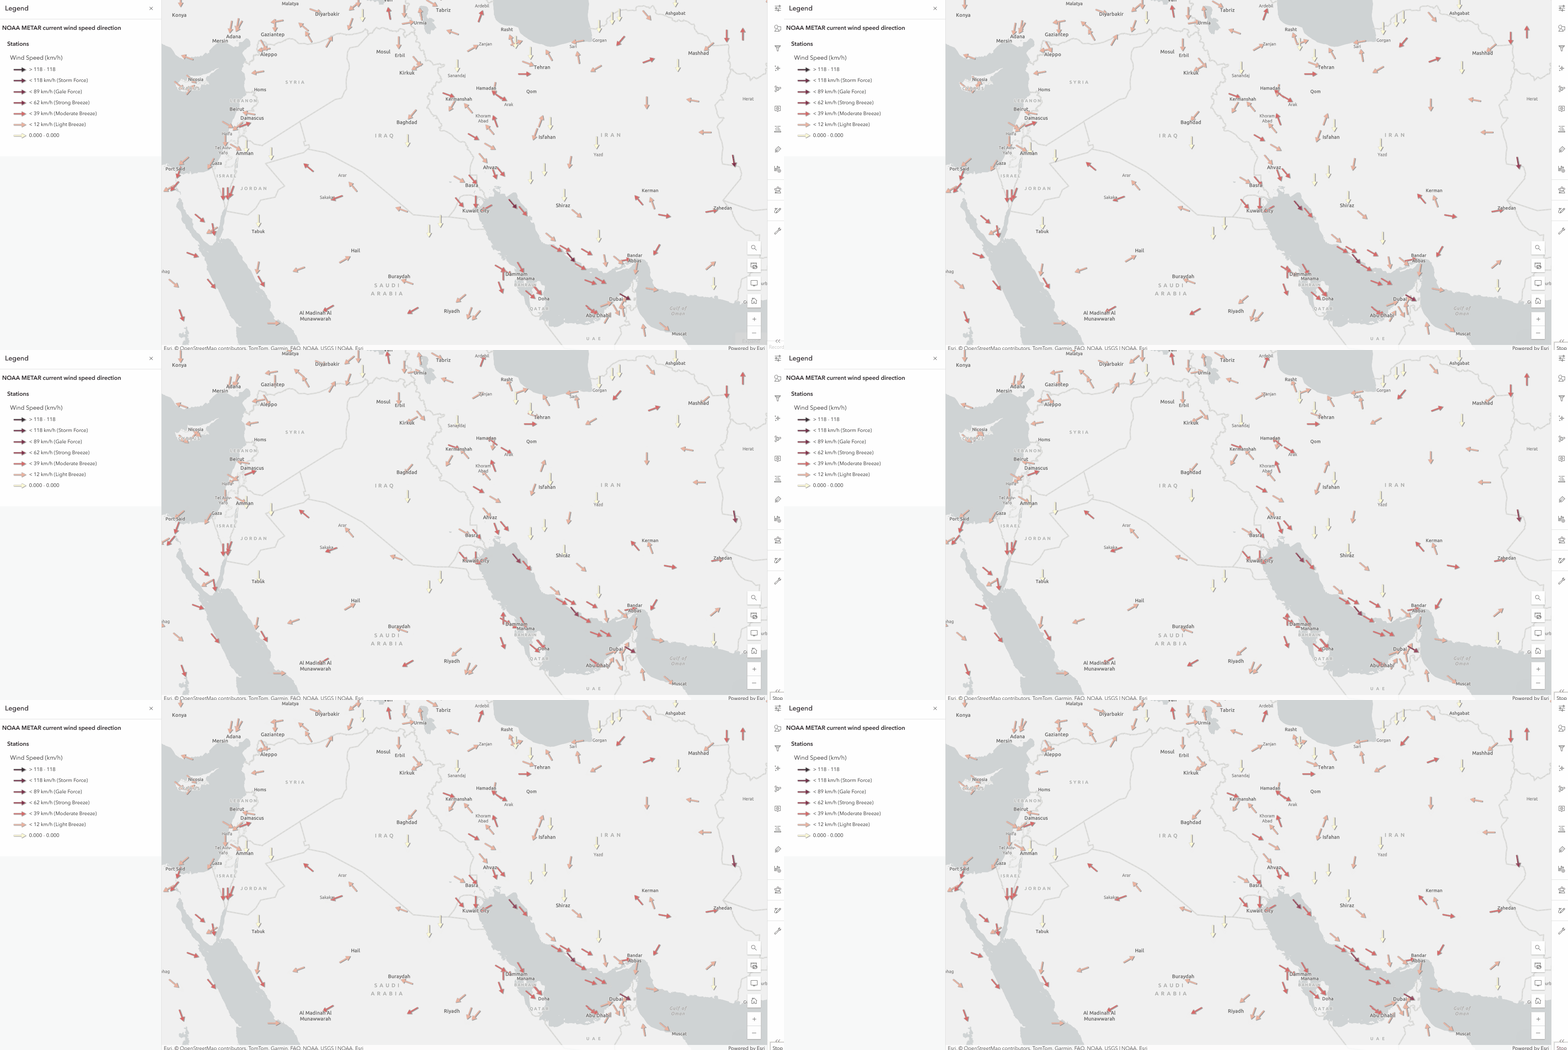
Bring your maps to life with animated symbols. A flash of color, subtle rotation, or dynamic increase in size can draw attention to key points of interest in your dataset. Animated symbology is an engaging way to highlight outliers in a dataset or illustrate dynamic phenomena such as wind patterns.
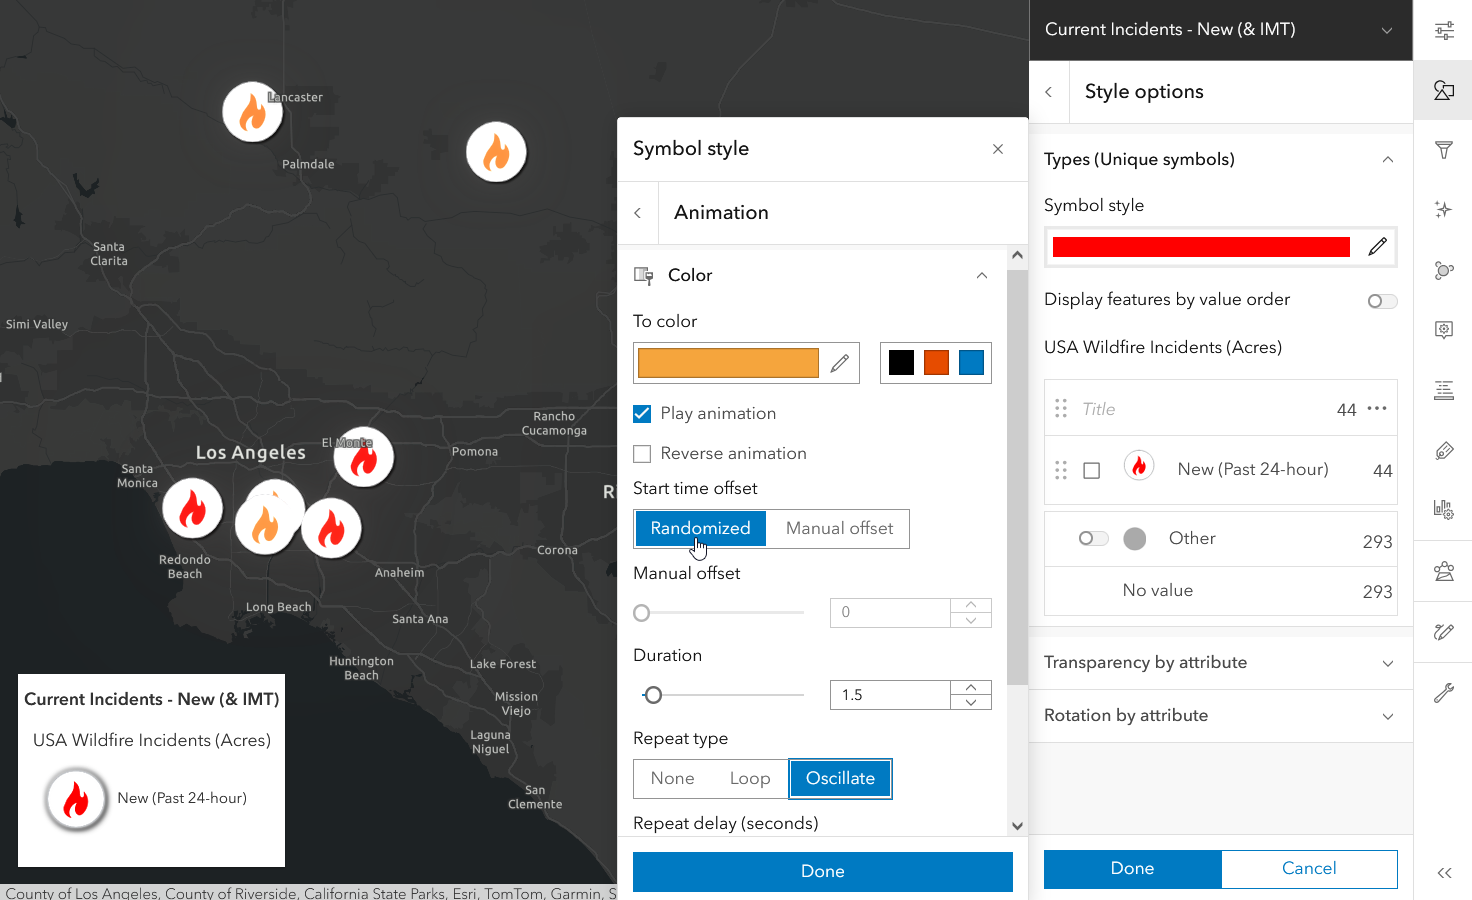
To take advantage of this exciting new capability, explore the Animated style for Vector Symbols when working with a point based dataset. There are various pre-configured symbols to choose from. Depending on the type of symbol selected, you can now configure the desired color transition, rotation, scale factor, size, and transparency in animation properties.

Directions
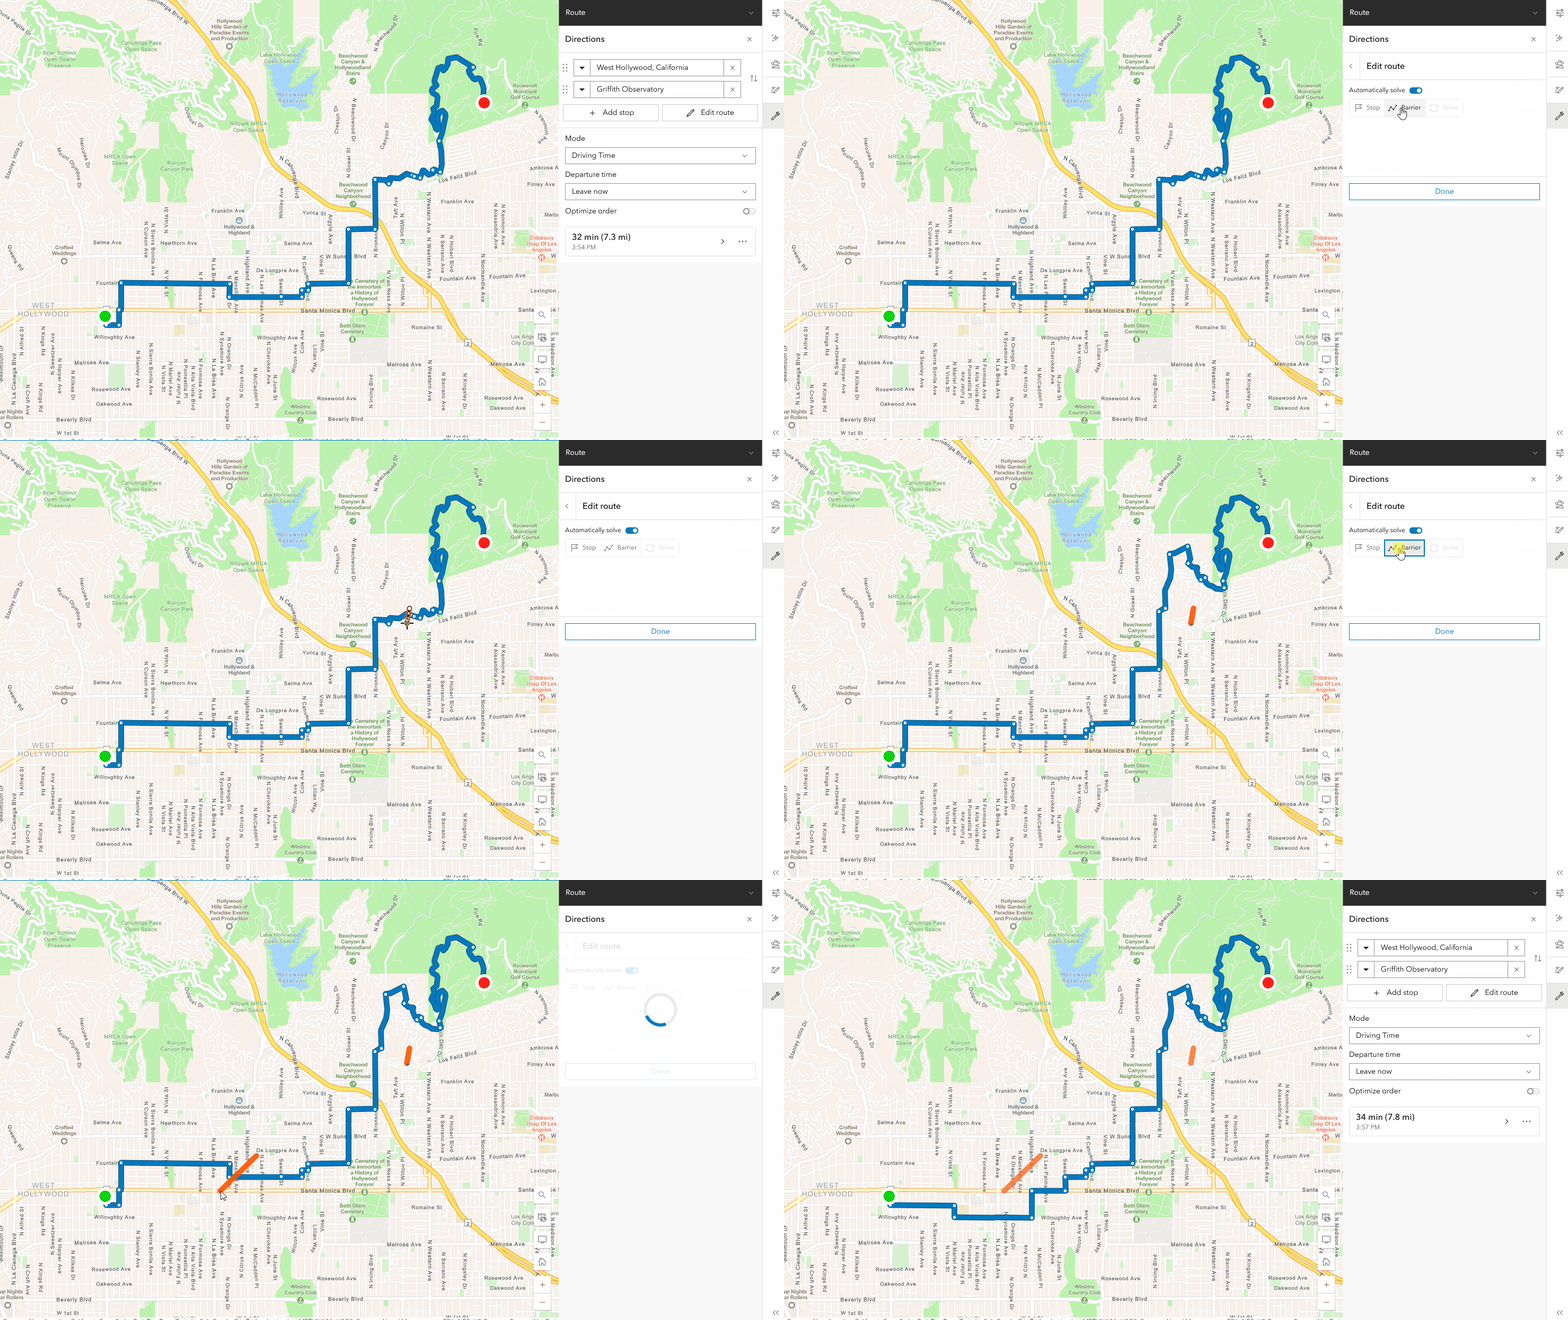
Are we there yet? Plan your route in advance with the new and improved Directions experience in Map Viewer. Updated with a sleek design and exciting enhancements, you now have more control when modifying routes. Select the Edit route button to dynamically add, change, and remove stops.
Additionally, you can now create barriers while planning your route to avoid certain areas. Simply draw a line to indicate the unavailable or blocked roads and the route will automatically recalculate. To opt out of automatically recalculating the route, switch the Automatically solve toggle off.

Pop-ups
Attachment sorting
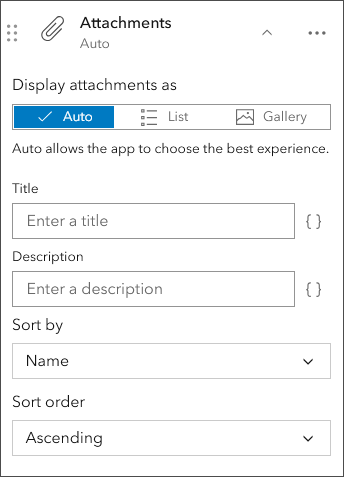
Prior to the February 2025 update of Map Viewer, attachments were automatically sorted in the pop-up. Now you have even more control over your pop-ups with attachment sorting settings. To take advantage of this new functionality, configure the Sort by and Sort order (ascending or descending) options in the Attachments pane for hosted feature layers and hosted tables.

Display filters
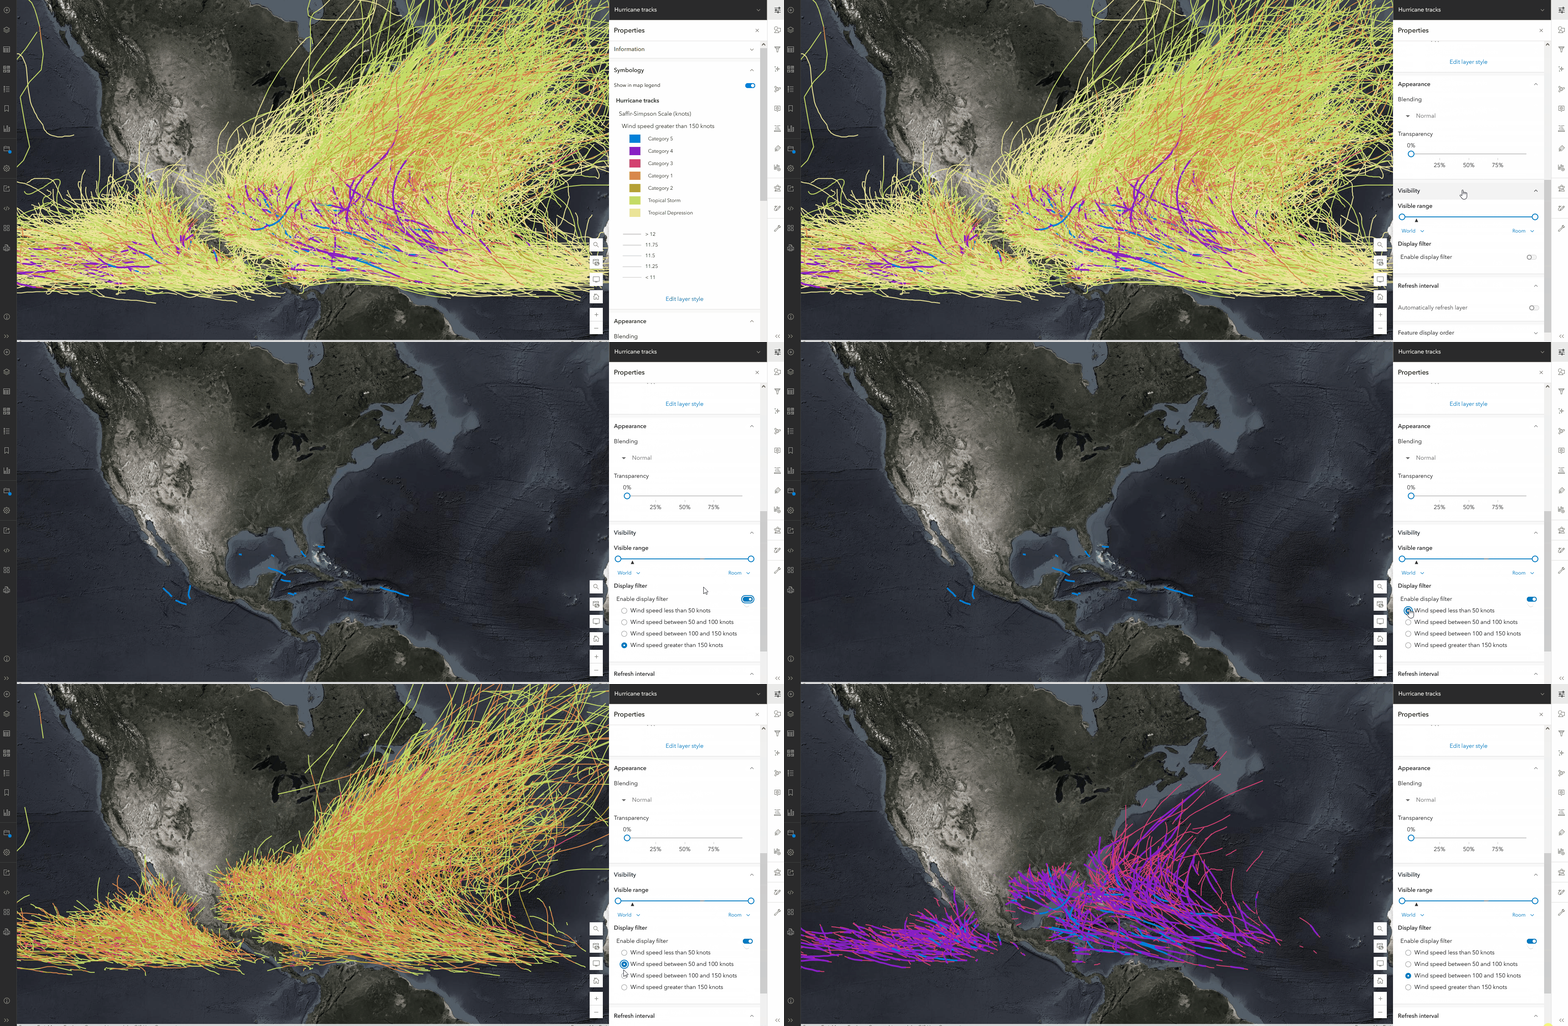
Map Viewer now supports display filters that have been published from ArcGIS Pro. Unlike feature filtering, display filters will only filter the data displayed by the map. This is particularly helpful when using a scale-based display filter to show the appropriate features for a zoom level. If configured, you can also choose from manual display filters authored on a layer. Select the desired layer and open the Properties panel to view any associated display filters. Stay tuned for a future update to create display filters in Map Viewer directly.

ModelBuilder (Beta)
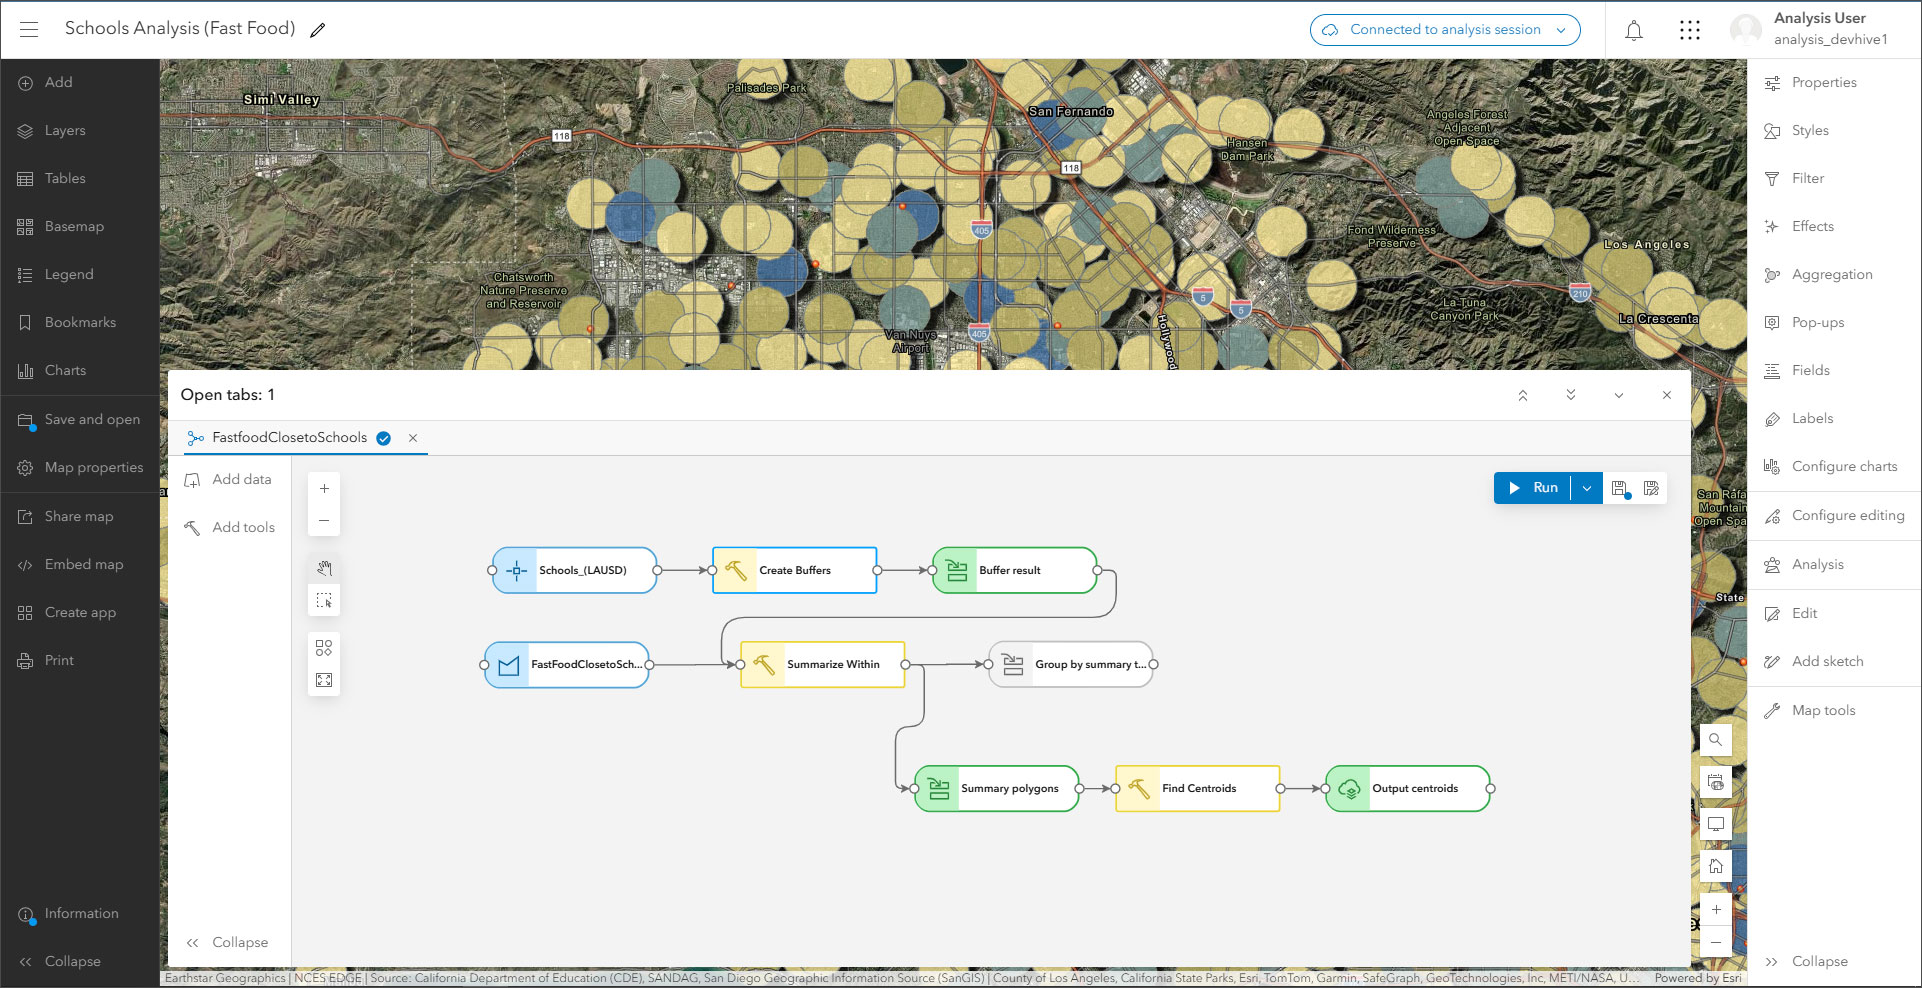
Models are a great way to streamline, document, and visualize analysis workflows. As of the February 2025 update in Map Viewer, you can now share your models with others! Once you have perfected your model, simply share it as an item to your organization or the public.
Additionally, ModelBuilder (Beta) has introduced support for two new tools:
- The Enrich Layer tool supplements point, line, and polygon features with demographic and landscape data from the ArcGIS GeoEnrichment Service or a custom GeoEnrichment service.
- The Generate Travel Areas tool uses Esri Service Areas to calculate the area that can be reached within a specified travel time or travel distance along a street network.
To learn more, see What’s new in ModelBuilder (Beta) 2025.

Analysis
Explore the new tools introduced into Analysis in the February 2025 update of Map Viewer:
- The new Tabulate Area raster analysis tool calculates the cross-tabulated areas between two datasets and reports the results as a table.
- The new Zonal Geometry as Table raster analysis tool calculates geometry measures for each zone in a dataset and reports the results as a table.
Additionally, subtype group layer sublayers are now supported when running an analysis tool from the tool pane.

Imagery
ArcGIS Living Atlas imagery optimized for analysis
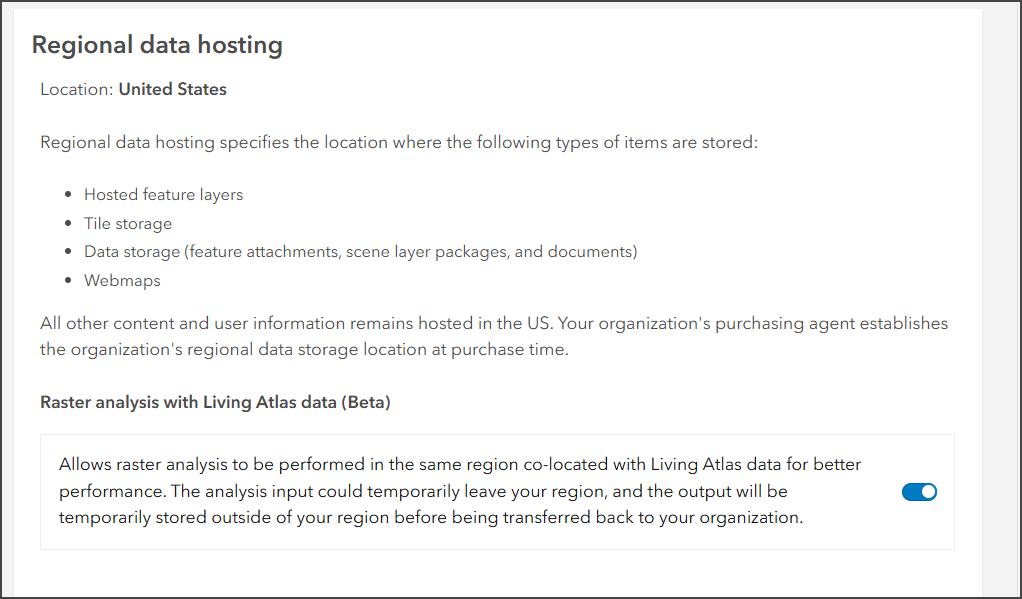
Take advantage of Living Atlas imagery layers in your raster analysis workflows. Currently, Landsat Level-2, Sentinel-1 RTC, Sentinel-2 Level 2A, and NAIP imagery layers are supported. This feature is currently in beta, and is turned off by default.
Oriented Imagery
You can now perform ground-related measurement within an area of interest for oriented imagery in Map Viewer. Measurements you can perform include ground distance, ground area, height above ground, and ground location.
Additional updates
The most recent update of Map Viewer also introduces a few quality-of-life improvements for imagery. You can now zoom to the source resolution of your imagery layer, allowing you to uncover details that may not be seen at a coarser extent. For tiled imagery layers, you can now see the dimension and variable values in pop-ups.
To learn more, see What’s new in imagery in ArcGIS Online (February 2025).

Charts
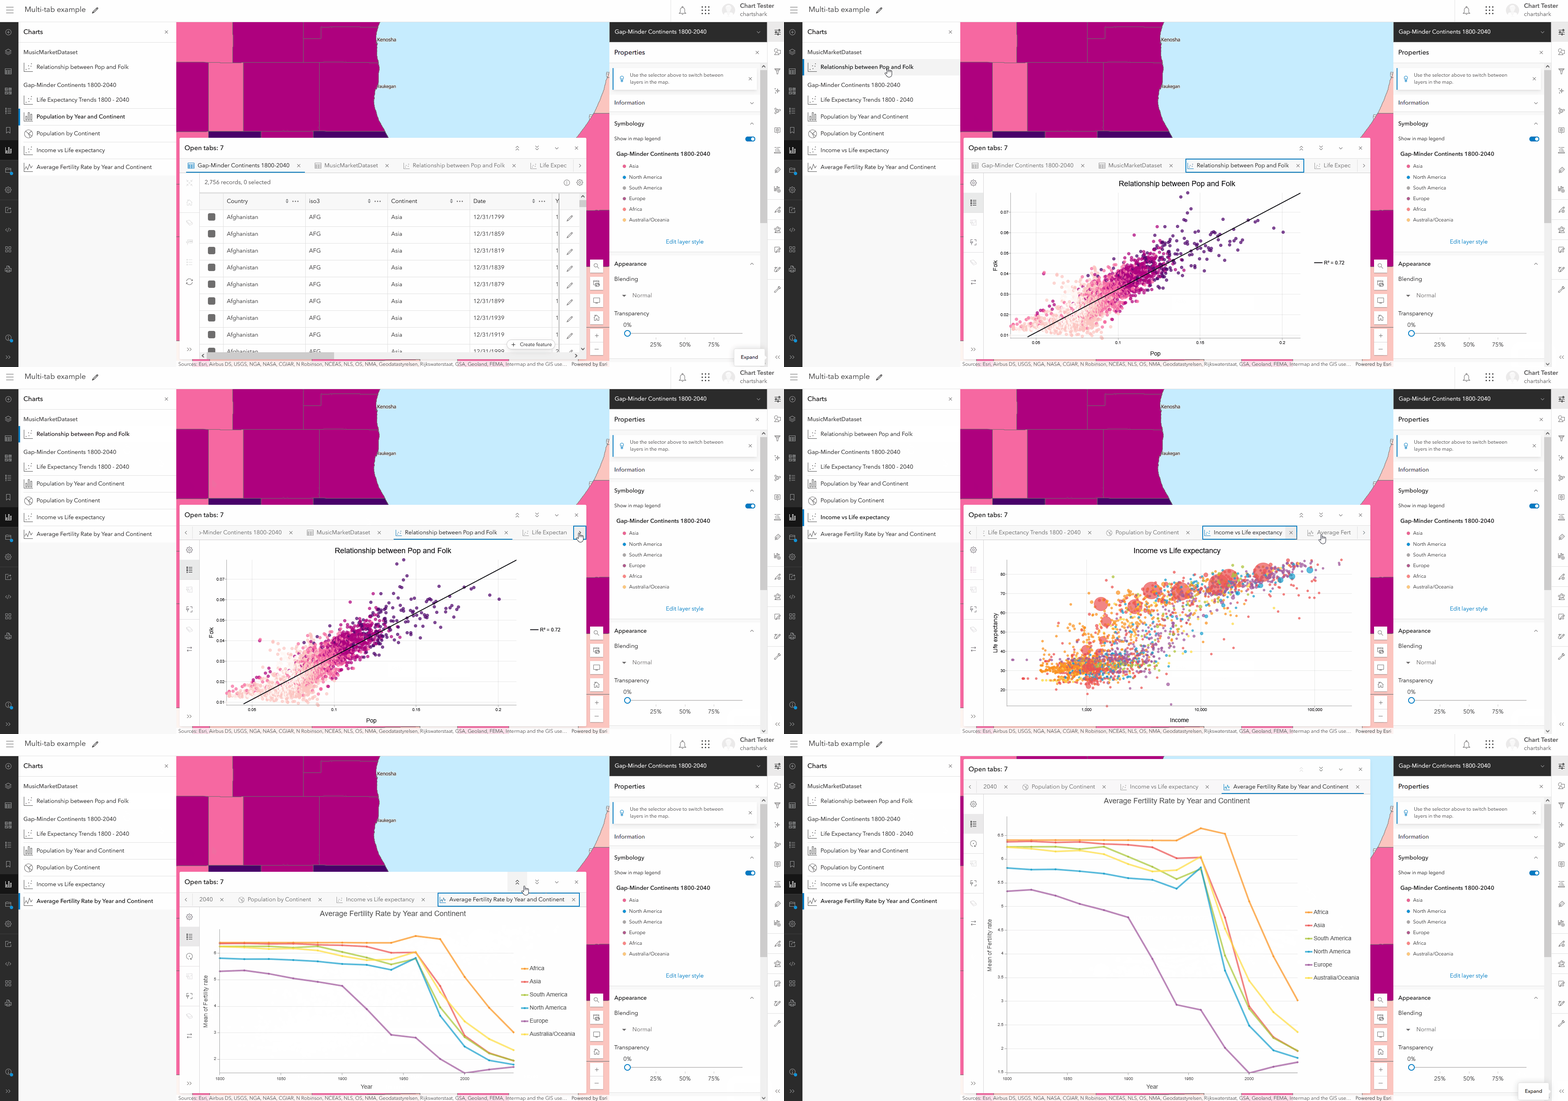
As of the February 2025 update, you can have multiple charts from different layers open in separate tabs. Easily navigate through charts without losing your place or closing other items.

Map Image Layer
You can now view Map Image Layer attachments in pop-ups and the attribute table. Feature display order can be authored for Map Image Layers when the “supportsOrderBy” property is set to true. The feature display order will honor the display order of pop-ups as well.

Other updates
Map Viewer Classic deprecation
Map Viewer Classic has been deprecated since June 2023. As of Q1 2025, new organizations, trials, and public accounts will not be able to open content in Map Viewer Classic. Map Viewer Classic will no longer be available for existing organizations in the Q1 2026 update of ArcGIS Online. See the Map Viewer Classic Roadmap for Retirement to learn more.
Shared templates
Shared templates, otherwise known as group and / or preset templates, are now supported in the editor panel in Map Viewer. To learn how to publish shared templates, see Introducing Editing Templates in the Geodatabase.
OGC Imagery WGS
You can now add Open Geospatial Consortium (OGC) Web Coverage Service (WCS) layers to Map Viewer via URL or by creating an item in your content. OGC WCS layers can be configured similar to any other imagery layer.


Commenting is not enabled for this article.