Aggregation in Map Viewer supports taking point features and aggregating them into clusters and bins. If you are new to aggregation in Map Viewer, check out these blogs below.
- Introduction to aggregation in Map Viewer
- Authoring bins with aggregation in Map Viewer
- Using scale threshold on aggregated features and updates to bin styling
With this June 2024 release of ArcGIS Online have added support for:
- Creating summary statistic fields with arcade for both clusters and bins.
- Styling bins with arcade expressions.
These two updates bring a lot of additional control to the aggregation authoring experience. Following the example scenario below to see how you can leverage these enhancements.
Example Scenario
In this sample map, I am looking at the accidents across the US. I am going to use binning where I will take a timestamp offset field and use arcade to create a summary statistic field to determine the predominant hour the accidents occurred. Then in the Styles panel, I am going to use that summary statistic field in an expression to set the predominant hour values as Morning, Afternoon, Evening, and Night for the Types style along with the aggregate count field to Counts and Amounts size with the new Reference Size theme.

Creating a Summary Statistic Field using Arcade
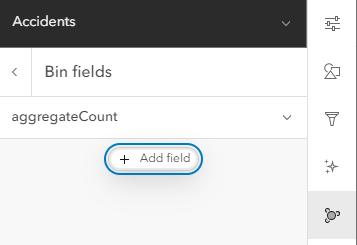
The creation of a summary statistic field still takes place within the same Fields entry point within clustering and binning. You will see we have the expression button next to the fields dropdown which is like the arcade expression-building experience for labeling. In this case, I have binning already enabled, and clicking on Fields will open the Fields panel. Clicking on the Add field and finally, the Arcade expression button will open the expression builder modal.
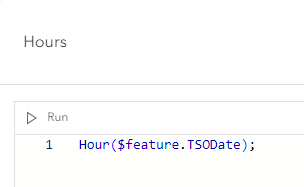
The expression I am creating will use the Hour function to extract the hour the accident occurred from the timestamp offset field.
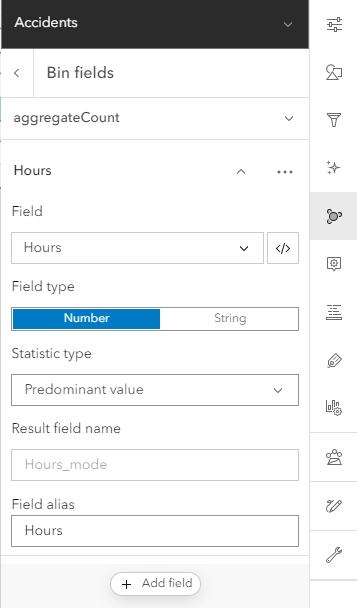
Next, the properties for this arcade driven summary statistic field can be configured. The first is defining the field type. I want to have the output type for this as numeric for this case so setting the Field type as Number will be needed. This is important because this will drive the available styles for the bins when the field is selected. Next for the statistic type – I want to have this summary statistic field show the predominant value within the bins. The rest of the properties can be left unchanged for now.
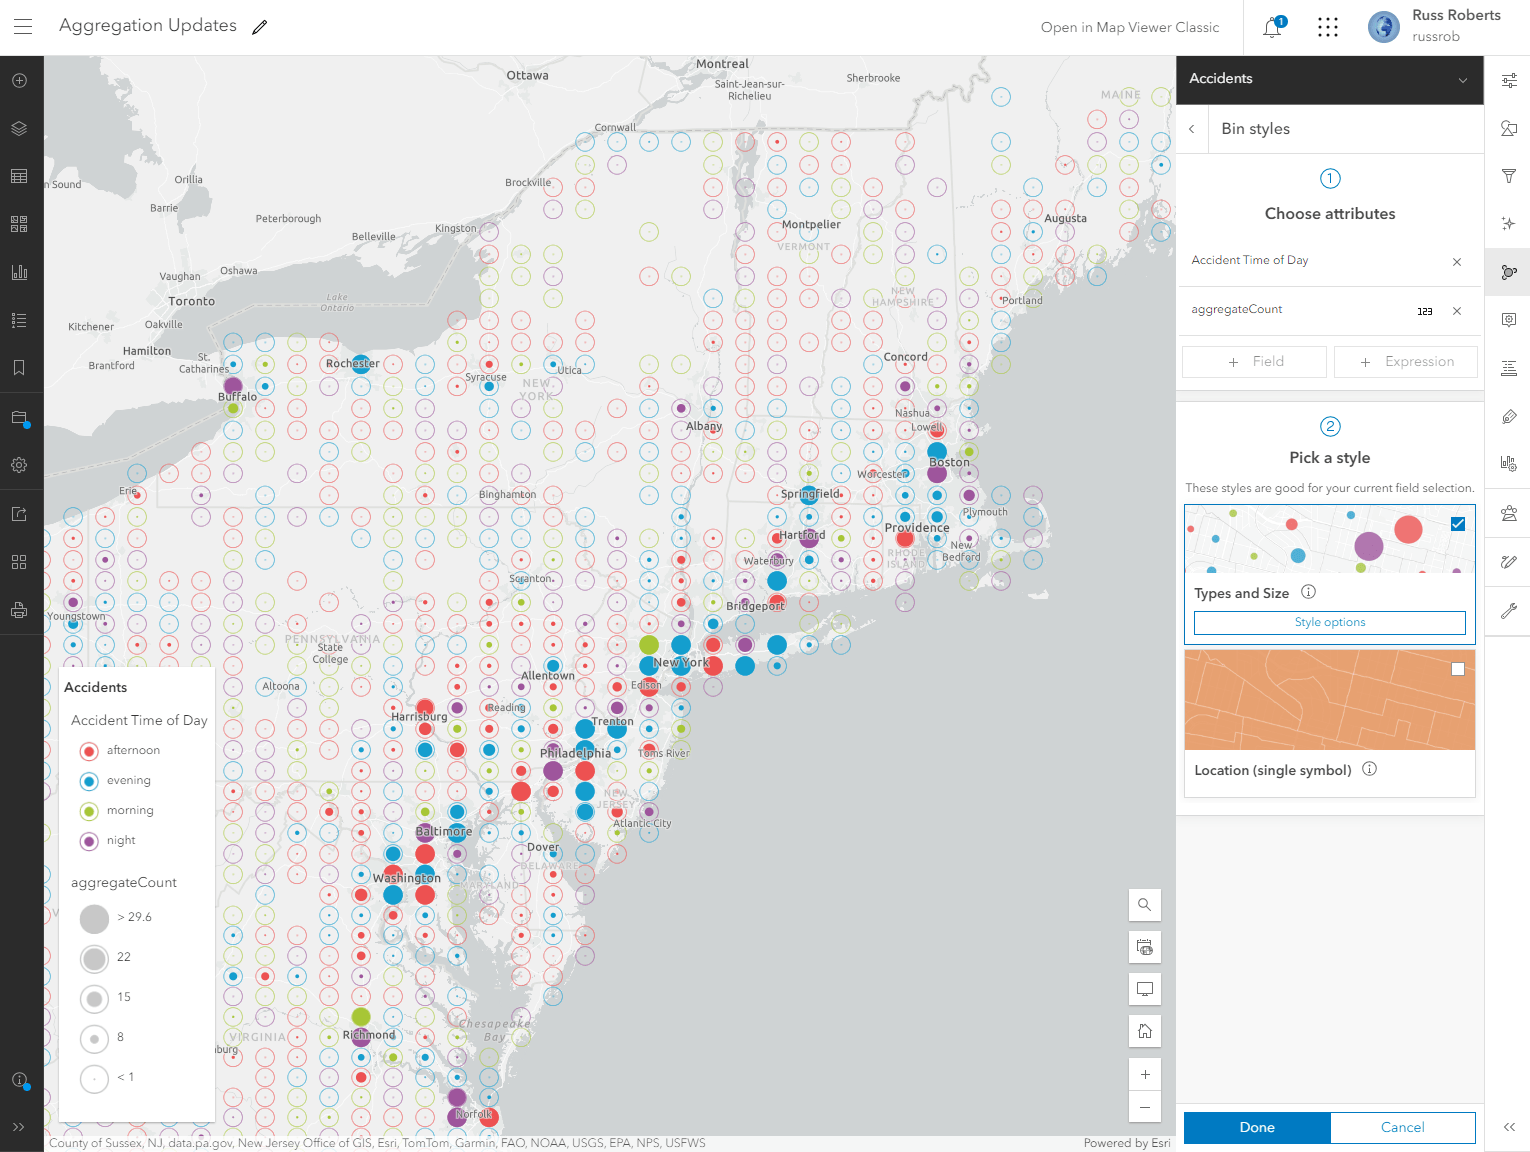
Styling your Bins with Arcade
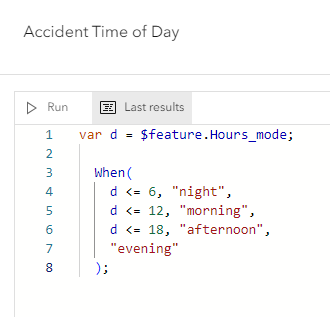
When clicking on the Bin style button will open the styling panel for just styling your bins. This is contained within the aggregation. This styling experience is exactly like what you see when styling non-aggregated features. With this release, the Expression button is now available for bin styles. Clicking on the Expression button will open the Arcade Expression builder. As mentioned above. I want to use the summary statistic field from above within the expression where I will take the predominant hours value and assign a string value to classify the hour as Morning, Afternoon, Nigh and Evening.
When this expression is applied to the styling panel the smart mapping style updates to Types and Size. The bins will use the new theme Reference Size which works well with gridded visualizations like binned features.
Now with the final map, we can easily tell.
- Where the most accidents occur which primarily lines up to the densely populated areas.
- What time of day are most of the accidents happening. With most happening along major commuter routes.
This wraps up our overview on the latest enhancements to aggregation in Map Viewer and look forward to seeing what you create.

Article Discussion: