ArcGIS Arcade is an expression-based scripting language for data in your maps. You can use it to do basic calculations, convert field types, and configure symbols, labels, transparency, pop-ups—all without leaving the map. And you don’t have to be a developer or GIS expert. Arcade is for anyone who wants to transform their data values on-the-fly. Check out the resources below to see how Arcade can enhance your work.
Arcade in action
Watch Jeremy Bartley, Esri’s lead product engineer for web mapping, create an Arcade expression to tell a different story within his map.
Jeremy uses Arcade to change his map from adults with high school education to those without it.
Learn how to create your own expression
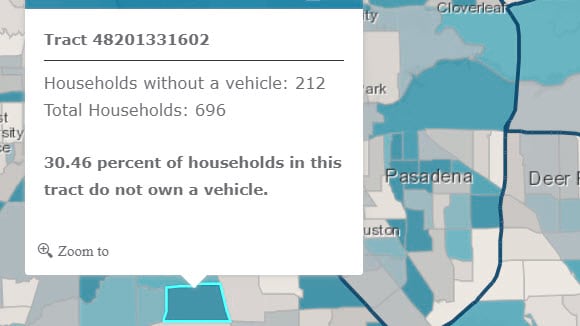
A common use case for Arcade is changing the total number of something to a percentage. For example, from the total number of households without a vehicle to the percentage of households without a vehicle. The article Discover patterns in your data with ArcGIS Arcade guides you through the steps.

Create an evacuation map to prepare for an incoming hurricane. Learn Arcade along the way.
Browse guided examples
The story map below includes numerous live examples of how to create custom calculations on the fly and immediately see the results in your map.
Experience Arcade expressions through this compelling quick guide.
Share your expressions
Have you created some useful expressions that others would benefit from? There’s an Esri Arcade GitHub repo for that.

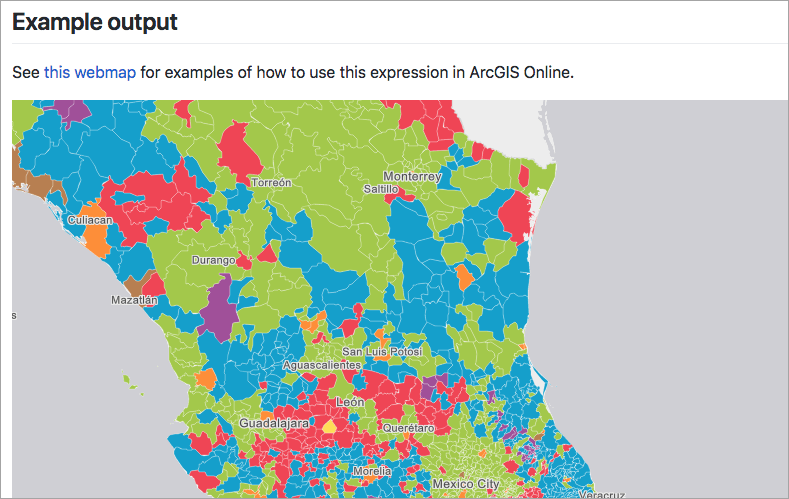
The Arcade GitHub repo includes live examples of how the expression works with real data.
We hope these examples have illustrated that whether you’re new to mapping or a GIS expert, Arcade can elevate your work. Please dive in, check them out, and leave us feedback about what you think.

Article Discussion: