Liven up your maps with labels
The recent update of Map Viewer includes labeling. Add labels to guide readers to points of interest such as Congressional Districts, restaurants, streams, and much more.
This blog will cover new additions to labeling that many of you have requested:
- Multiple lines
- More than one label class
- New fonts
- Arcade expressions
- Scale dependency
- Rotation
- and offsets
Multiple Lines and Multiple Label Classes
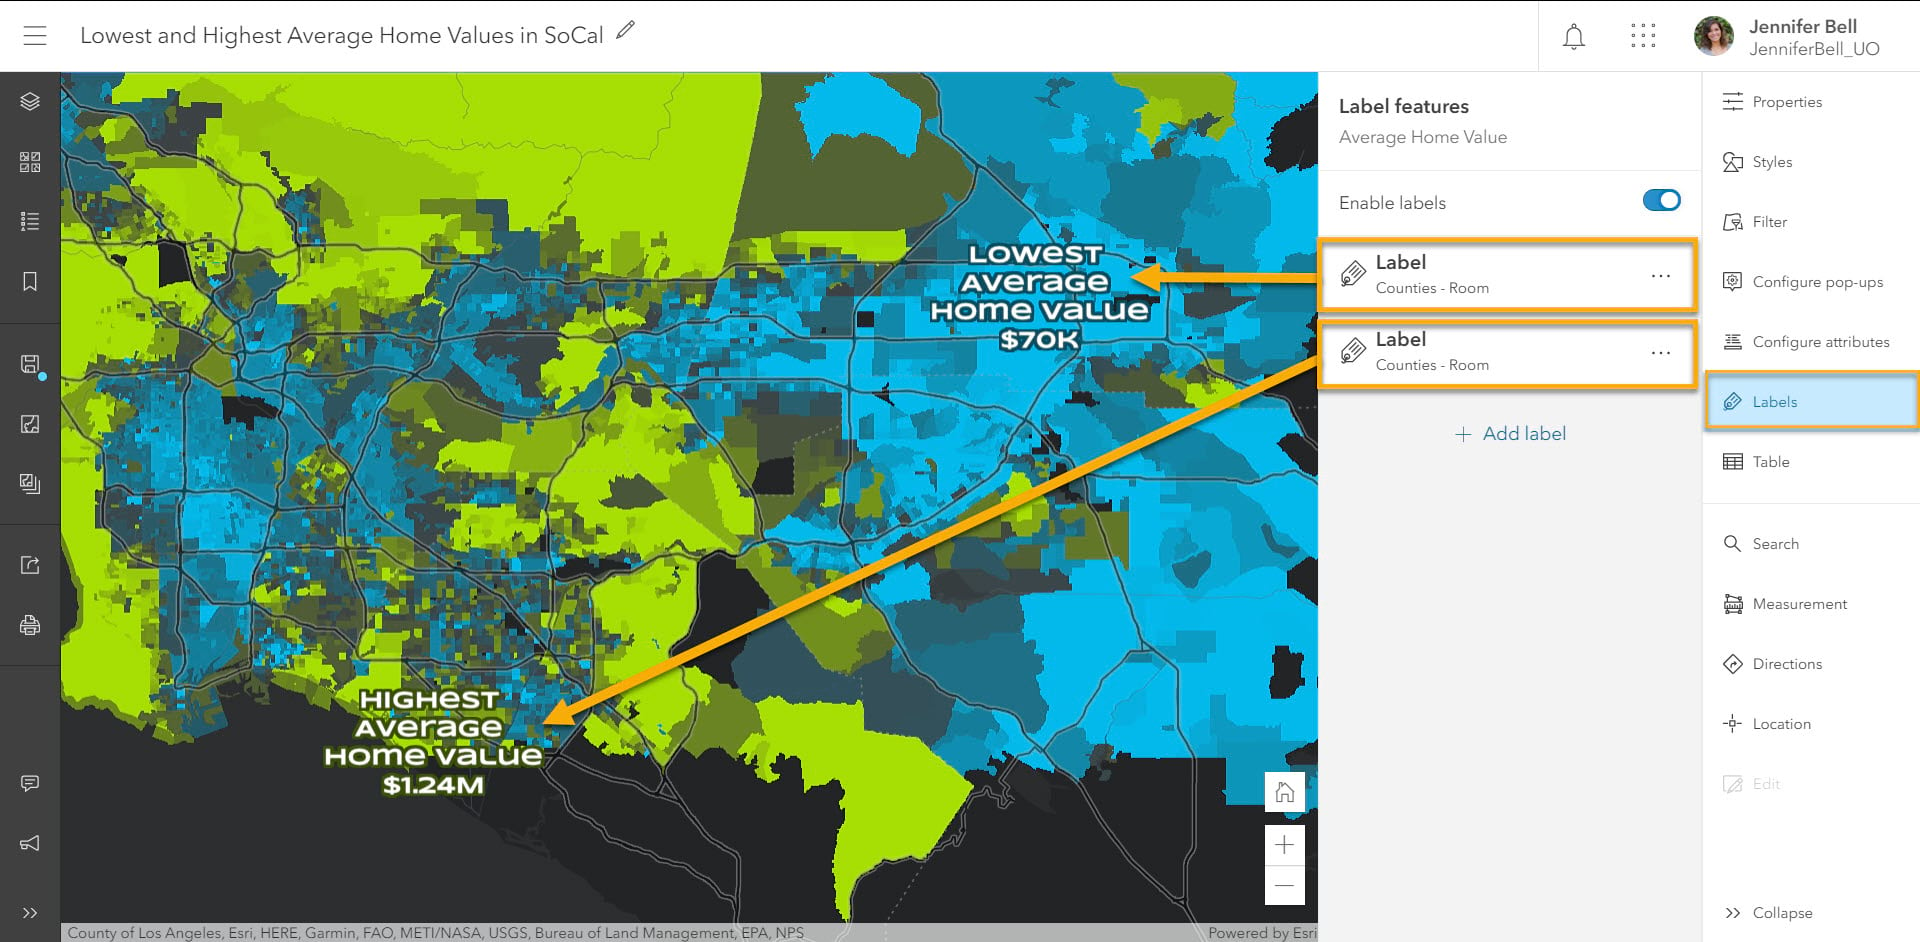
Choose a layer to access labeling on the right side of Map Viewer. You can now add multiple label classes for different configurations. The map below calls out the lowest and highest average home values in and around Los Angeles, California using two label classes. Areas in green have higher average home values while areas in blue have lower average home values.
Notice how the text automatically wraps onto a new line. This ability is one of the most requested updates and we’re happy to provide it in Map Viewer. You can also achieve new lines using Arcade expressions which you’ll see later in this blog.
New Fonts
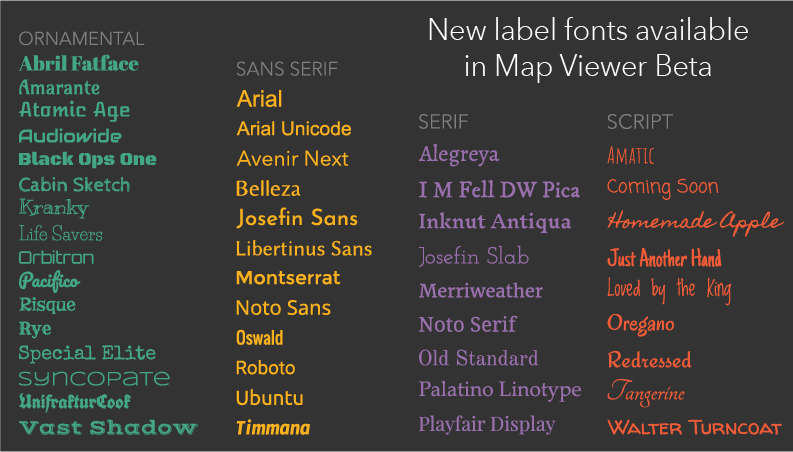
A great font will make your map stand out. Map Viewer includes new fonts that are ornamental, or decorative, sans serif, serif, and script. We recommend using up to two font faces in your map such as Arial and Avenir, but as many fonts (bold, italics, etc.) as you like.
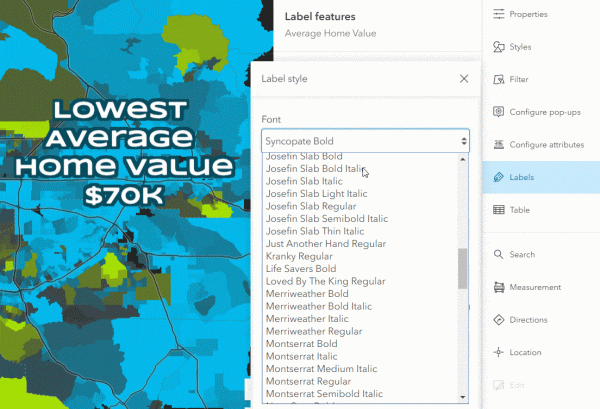
Explore different styles that match the mood or tone of your data. For example, more serious topics might benefit from sans serif or serif fonts. Decorative or script fonts will add playfulness to lighter subjects.
Arcade expressions
Labels are data-driven based on fields or custom Attribute expressions. Remember the two label classes we mentioned above? These both use Arcade expressions to label the lowest and highest average household values in Los Angeles. To do this, select the Expression option in the label attribute section. The image below shows an expression that labels the highest average home value.
A new feature in Map Viewer is adding a new line to your label using the useful expression “TextFormatting.NewLine”.

Scale dependency
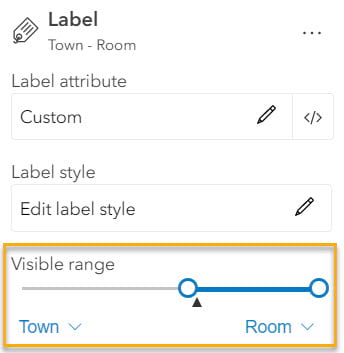
An exciting, new feature in Map Viewer is the ability to specify when labels appear based on zoom level. This is useful when you want to reveal more detailed information as the reader zooms into the map. You can set the visible range for each label class.
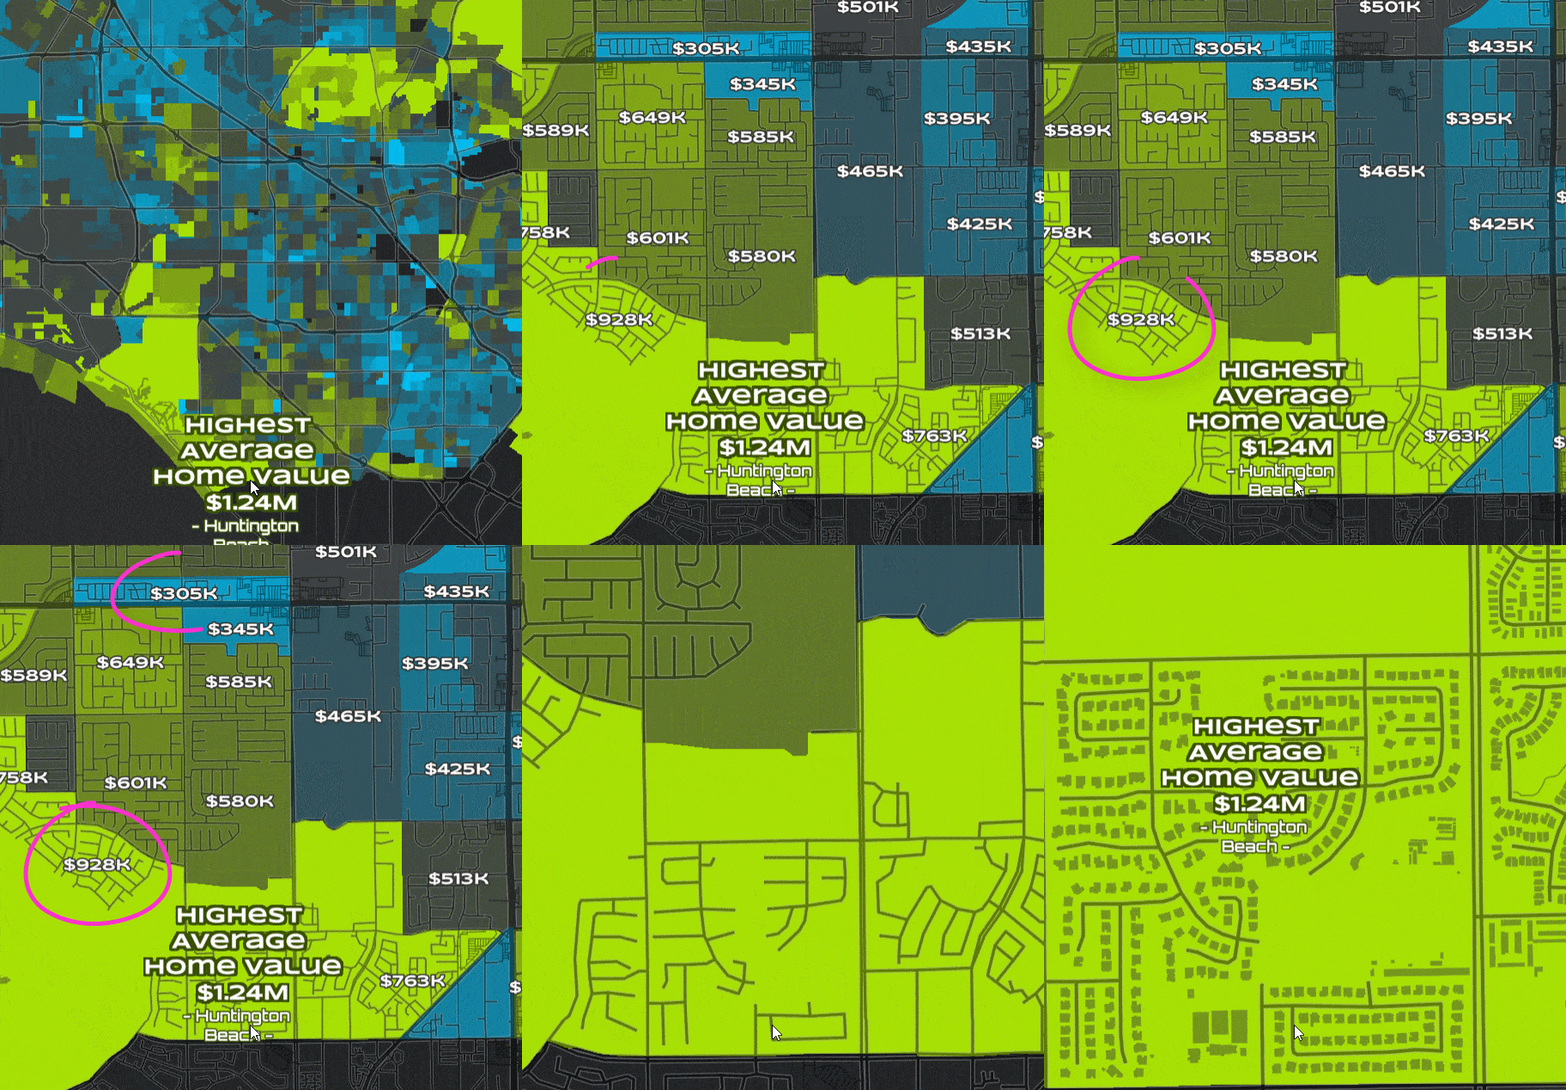
In the GIF below, the highest average home value is displayed at smaller scales (zoomed out). As the reader zooms in, the average home value appears for all block groups. Notice how much the average home value changes from one block to another (in this example, $305K to $928K in just 3 blocks!).
Rotation
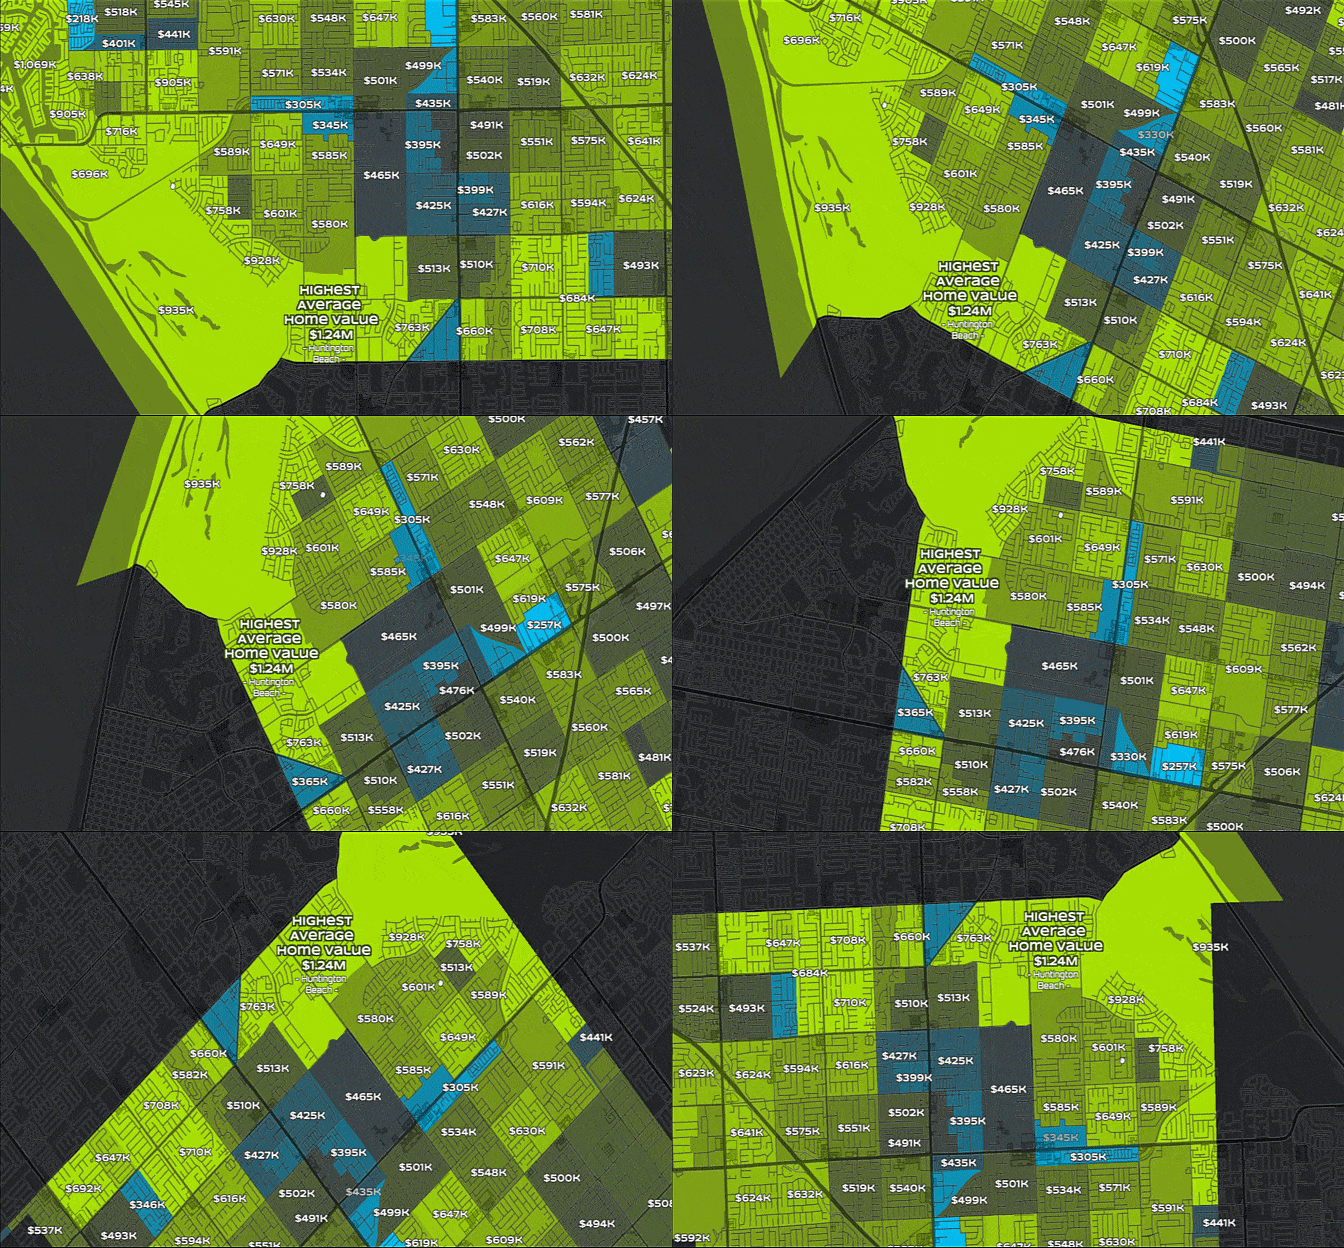
As map rotation is new in Map Viewer, so is label rotation. In an ever-growing, mobile-based world, responsiveness to every pinch and pan of the map is even more important. Map Viewer has your back no matter which way your world turns.
Offsets
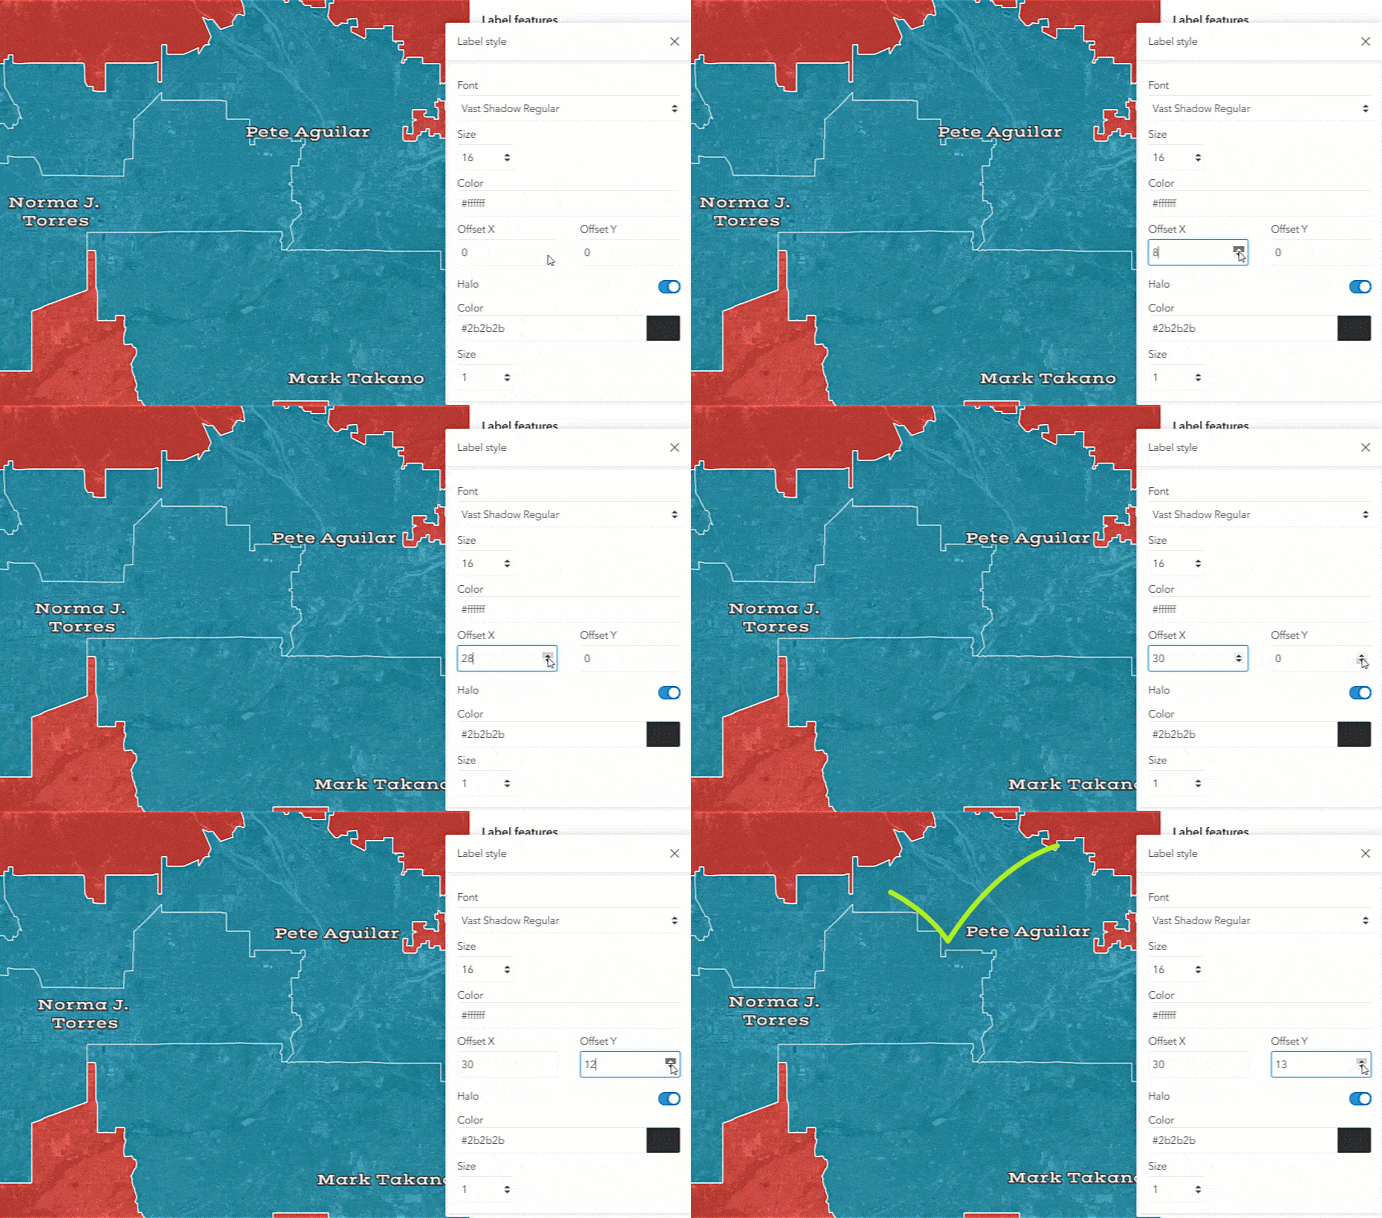
Another feature many of you have requested is the ability to reposition labels. We’ve introduced a horizontal offset (x) and a vertical offset (y). You can use the up and down arrows or simply type in a positive or negative value. This ensures that your labels are exactly where you want them to be.
What’s next?
In a future release, Map Viewer will indicate which fonts are used in the current basemap, when possible. This ensures a cohesive look-and-feel of all elements in your map. Another new feature will be the ability to use the filtering experience to control what features are labeled (instead of using Arcade expressions).
Explore new label fonts and capabilities to make your maps shine.




Article Discussion: