Labeling in Map Viewer allows you to create one or many label classes that can use fields and arcade to generate descriptive text for your features in the map. This blog will go over the labeling features that are available to help you design your map.
What are label classes?
Label classes are a powerful way to specify:
- Create one or many label classes for a single layer
- Supports using a field or arcade expression
- Filter based on feature values to show/hide labels
- Text styling and placement
- Set a visible scale range for each of the label classes
Building a Label Class
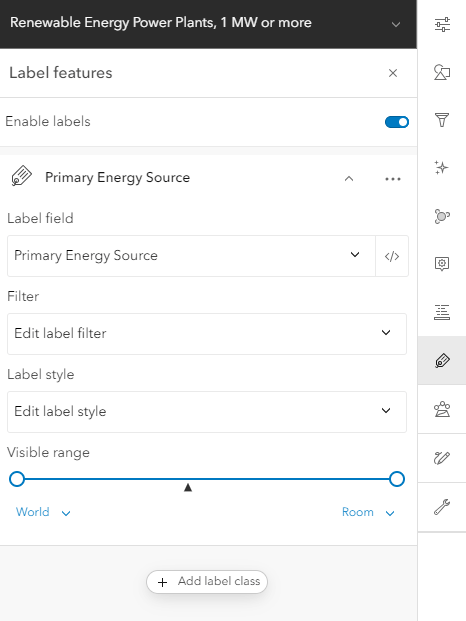
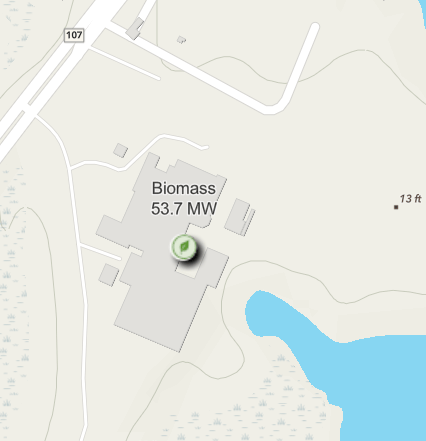
To start creating a label class open the label panel and click + Add new label class. This will select the first field in your layer. You can switch the field chosen by clicking on the field drop-down. The button next to the field drop-down will open the Arcade editor. This allows you to format your numeric fields by defining the number of decimal places you may want to show. It can also be used to create multiline labels. For example, with this map, I am combining the Primary Energy Source and the Total Energy Capacity(MW).

Using this snippet sets the power type, assigns the output to a new line, and adds the unit of measurement.
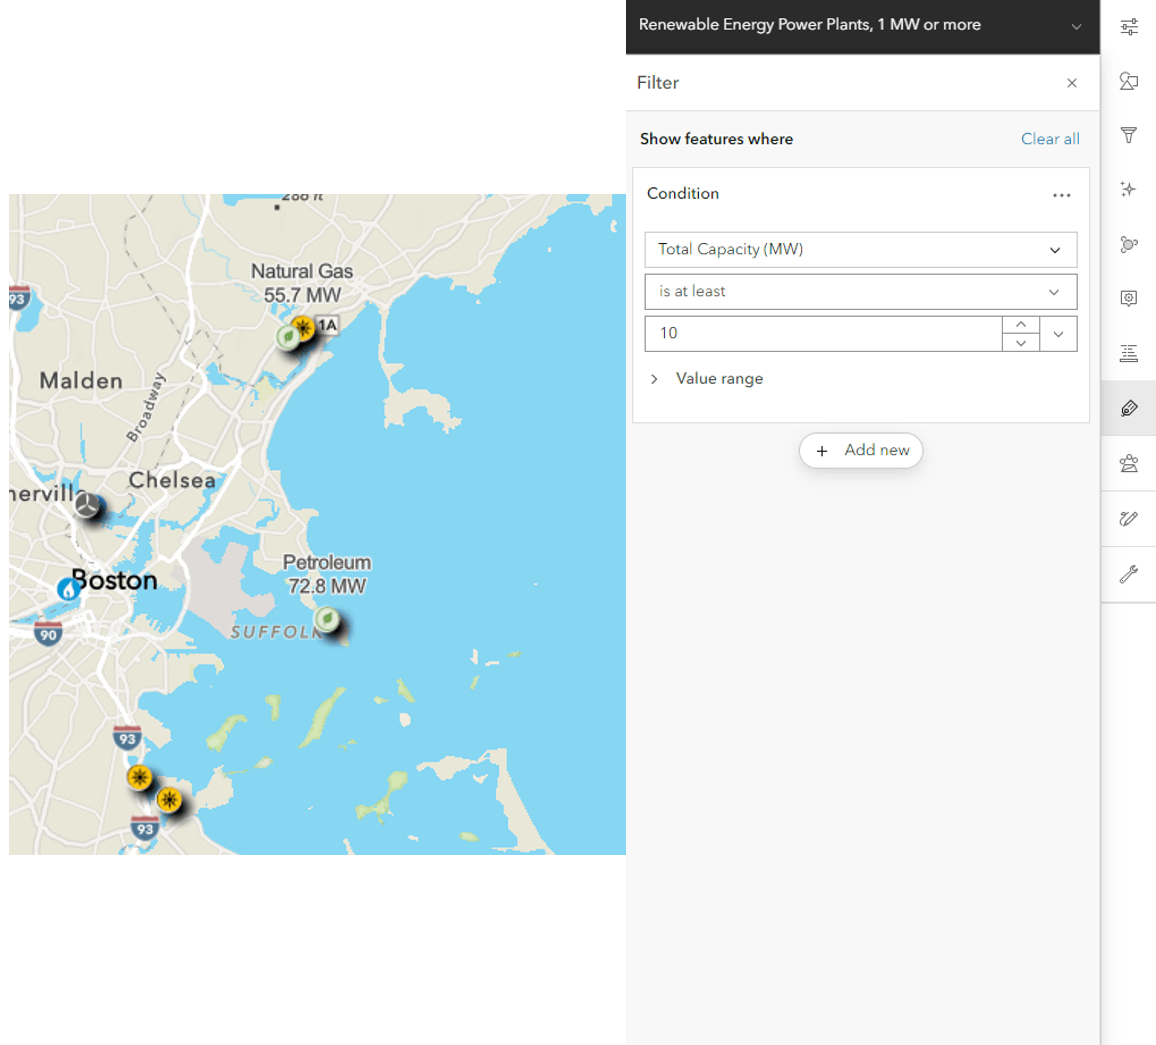
Label Filtering
Next, I can define a filter for this label. In this map, I only want to see power plants that have a total capacity greater than or equal to 10 MW. The label filtering experience uses the same experience as feature filtering and feature layer effects. All you need to do is select the field and define the value or use the histogram to set that value or range.
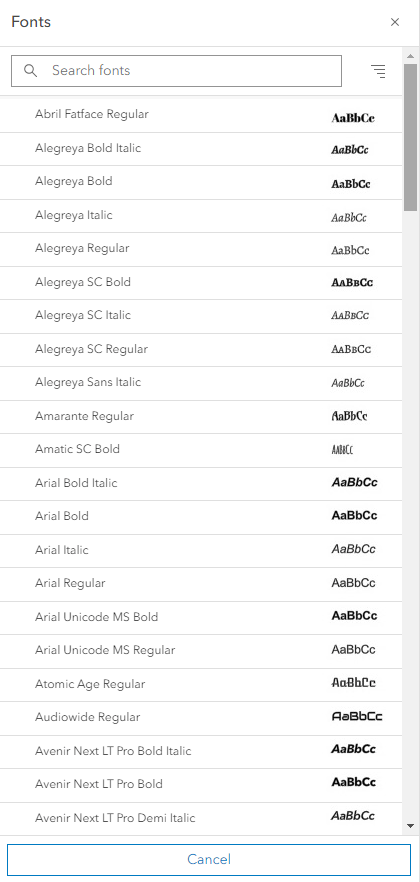
Label styling
Now for the fun part, styling our labels. The label styling panel in Map Viewer offers over 100+ fonts available for you to use. Here I am selecting a font that is used with the basemap which makes my label styling match the rest of the map.
Next, I configure the color I want to use. The color picker supports saving colors that are used in sketch, feature styling, labeling, and map background. This makes it easier to have a consistent color used in one panel and reuse it in another without have to re-enter color codes. Here I am picking a green to match the symbol color used in the feature styling.
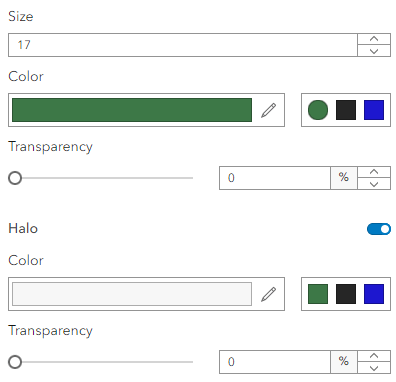
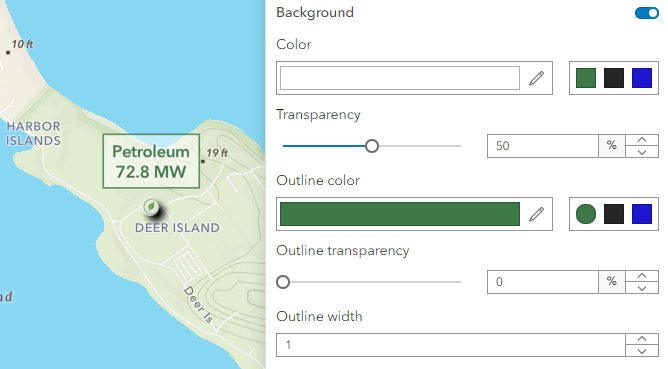
With the June 2024 release, Map Viewer also supports enabling a background on your labels for points and polygons (lines coming soon!). Here I am going to use a white fill with 50% transparency for the background along with the same green used before for the outline.
Label placement
Depending on the geometry type being labeled you will have varying options for label placement options.
Points
For points, 9 defined placement options allow for additional offsets to be defined. Looking at the gif below we can see how the label placement moves by choosing between the Above, Center, and Below options along with using the XY Slider to define the offset.
Lines
Lines have 2 defined placement options that support the placement above, center, and below along. There is no XY offset exposed for lines at this time.
Lines also have 2 additional properties to define your label placement. Allow overrun which is off by default will allow label text that is longer than the line feature to not be visually constrained by the feature length and allow the label to show at any length of line. Repeat interval allows the spacing between label placement to be controlled along the line. 0 is the default spacing value and increasing the number of points will add more spacing.
Polygons
Polygons currently are only placed at the centroid within the feature along with using the XY slider to set an offset from that centroid.
Scale Range
Jumping back to the power plant layer we are going to look at the visible scale range for labels. This is supported across points, lines, and polygons. This is useful for setting a proper scale range to help your labels not get cluttered at scales that may not make sense. The scale range will match what is set on your layer but can be adjusted within the layer’s visible scale range. They will not show if the layer is not visible.
I hope this review of labeling functionality in Map Viewer was helpful and look forward to seeing what you create!

Article Discussion: