
This blog article has been deprecated and is no longer updated.
It has been replaced by: Map in a minute: Map weather using ArcGIS Online and ArcGIS Living Atlas
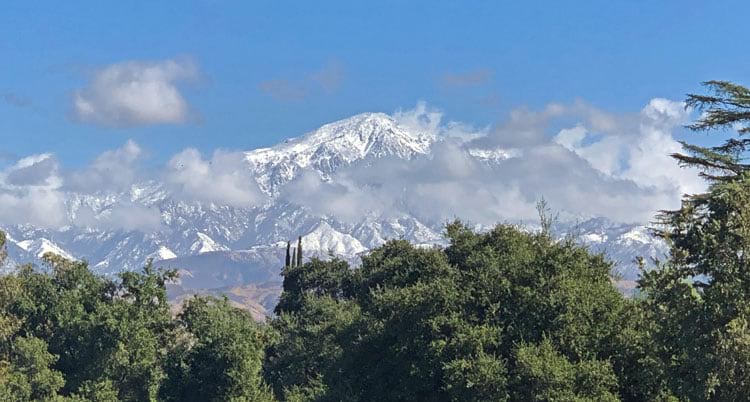
After a night of heavy rain, I awoke to see the storm lifting from the local mountains. Snow levels were down to an elevation of 2000 feet, with accumulations reaching 18 inches in mountain communities. Winter storms sweeping the U.S. later this week were predicted to bring record setting snows to the West Coast, and across the U.S. heavy snows are forecast from the Central Plains to the Mid-Atlantic Coast, with 23 states under a winter storm alert.
Make a winter weather map
ArcGIS Living Atlas of the World includes authoritative live feeds and other content that helps you learn more about current and predicted snow conditions. Follow these steps to make your own winter weather map in a minute (or less), using Living Atlas live feeds and filters to focus on winter weather watches, warning, and advisories.
Choose Map Viewer or Map Viewer Classic to see specific steps for each.
Map Viewer
Step 1 — Sign in to your ArcGIS account. Open Map Viewer Beta, click Add layer, then Browse Living Atlas Layers.
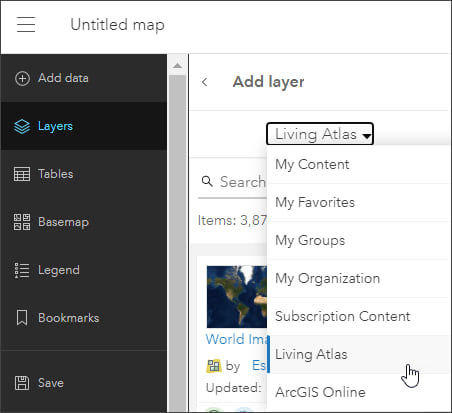
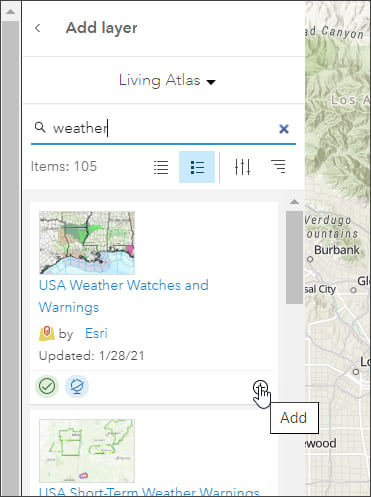
Step 2 — Enter “weather” in search to locate USA Weather Watches and Warnings. Click (+) to add it to the map.
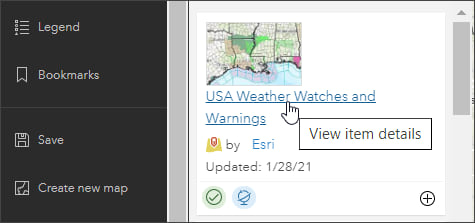
Tip: To learn more about any layer, click the layer title to View item details.
From the USA Weather Watches and Warnings item details we can learn that the layer is a live feed from the National Weather Service. The feed publishes official weather warnings, watches and advisory statements for the United States, and is updated every 5 minutes. The watches and warning are classified into 43 different categories.
Viewing the map layers, we find that the feed contains 11 layers, including boundaries.
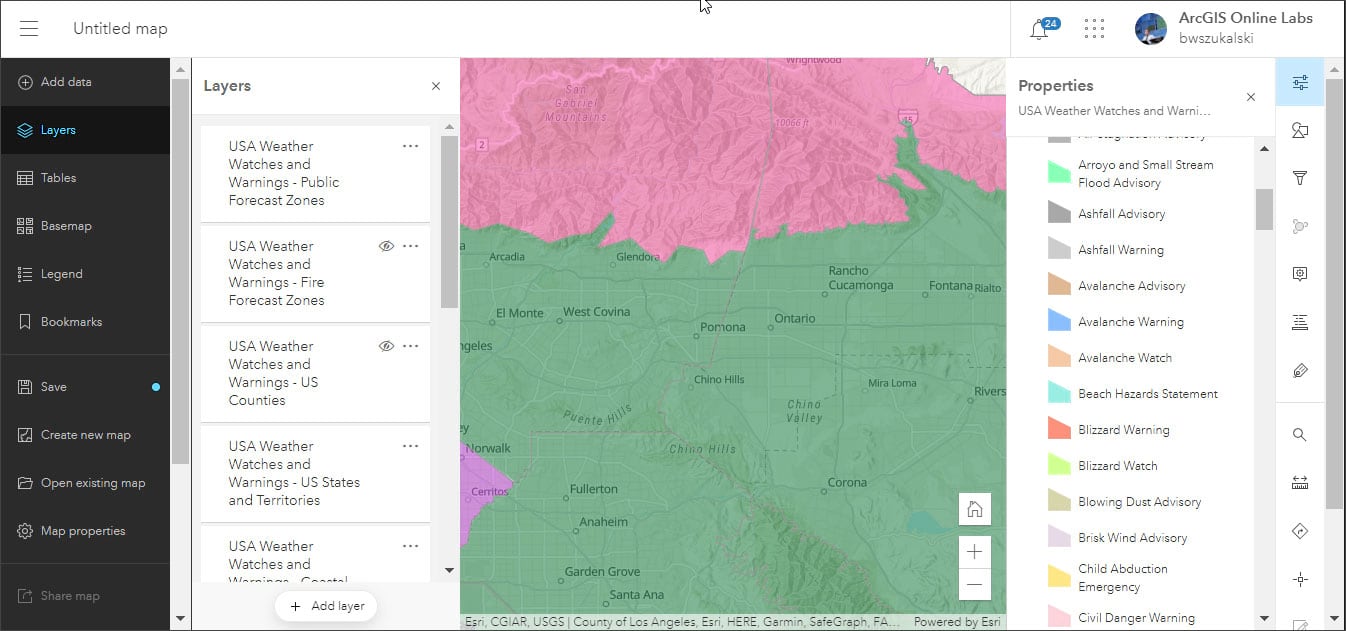
To simplify the map and focus on winter weather, follow these additional steps.
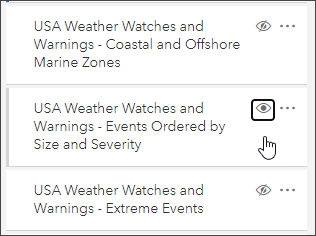
Step 3 — Toggle the visibility of all layers off except USA weather watches and warnings – Events ordered by size and severity. You can also remove all layers except this one.
Step 4 — View the National Weather Service watch/warning/advisory definitions. Decide which definitions you want to focus on. For this example, a filter will be created to focus on those that pertain to blizzards and winter weather.
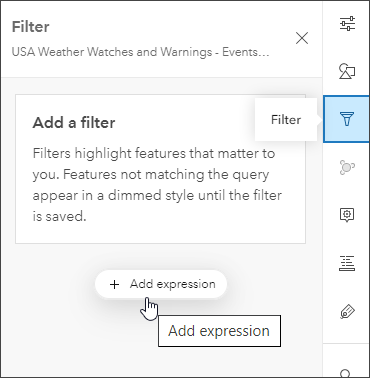
Step 5 — Open the layer filter. Ensure that USA Weather Watches and Warning – Events Ordered by Size and Severity is active (you will see a blue highlight on the left side indicating it is selected).

Click Filter in the settings toolbar on the right, then click Add expression.
Step 6 — Construct a filter expression as follows:
a – Select Type as the attribute from the list.
b – Select includes as the operator from the dropdown list.
c – Choose the desired values from the dropdown list.
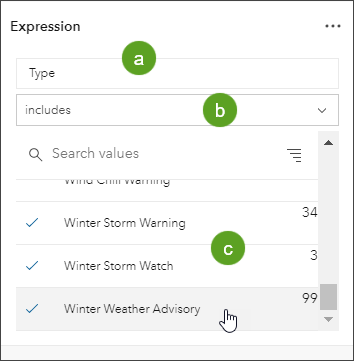
Tip: By default, attributes are listed by Count. Choose A to Z to make finding specific attributes easier.
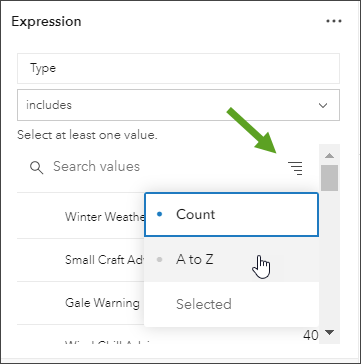
Step 7 — When finished, click Save.

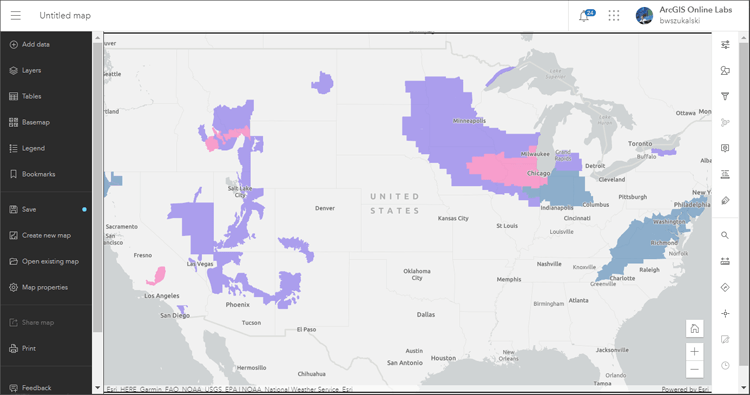
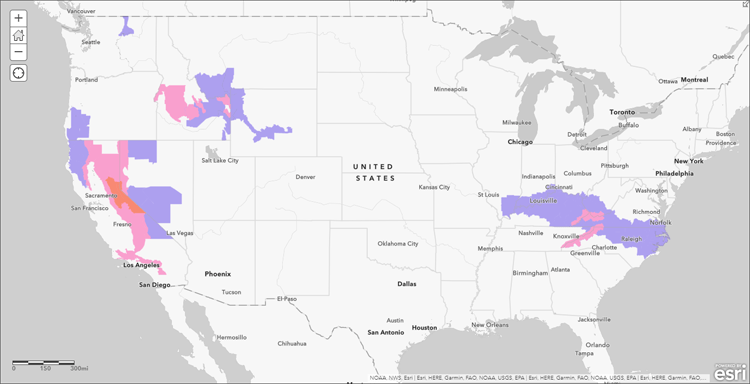
The map shown below is the result of applying the following expression:
Type includes Winter Weather Advisory, Winter Storm Watch, Winter Storm Warning, Blizzard Warning, Blizzard Watch.
Map Viewer Classic
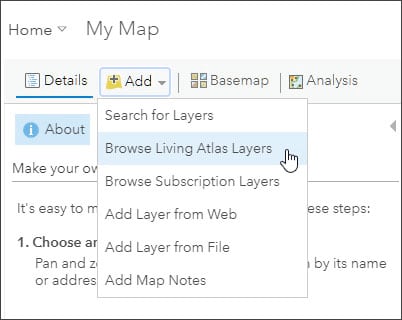
Step 1 — Sign in to your ArcGIS account. Open Map Viewer, click Add, then choose Browse Living Atlas Layers.
Step 2 — Enter “weather” in search to locate USA Weather Watches and Warnings. Click (+) to add it to the map.
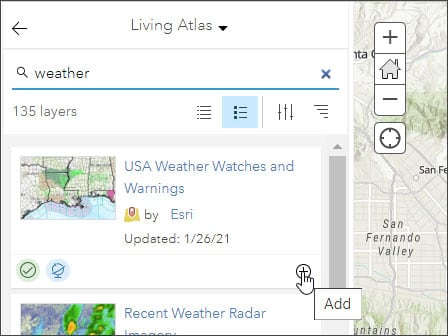
Tip: To learn more about any layer, click the layer title to View item details.
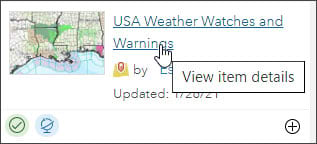
From the USA Weather Watches and Warnings item details we can learn that the layer is a live feed from the National Weather Service. The feed publishes official weather warnings, watches and advisory statements for the United States, and is updated every 5 minutes. The watches and warning are classified into 43 different categories.
Viewing the map contents, we see that the feed contains 11 layers, including boundaries.
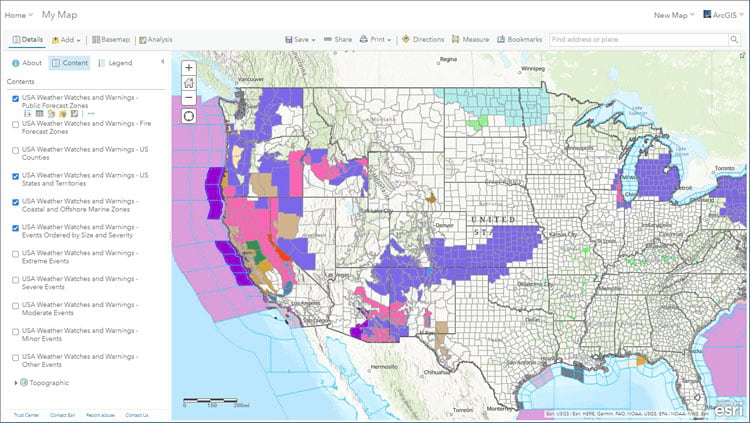
To simplify the map and focus on winter weather, follow these additional steps.
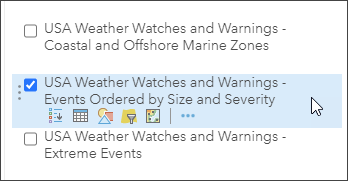
Step 3 — Toggle the visibility of all layers off except USA weather watches and warnings – Events ordered by size and severity. You can also remove all layers except this one.
Step 4 — View the National Weather Service watch/warning/advisory definitions. Decide which definitions you want to focus on. For this example, a filter will be created to focus on those that pertain to blizzards and winter weather.
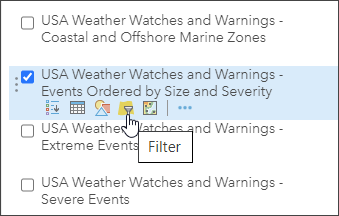
Step 5 — Open the layer filter.
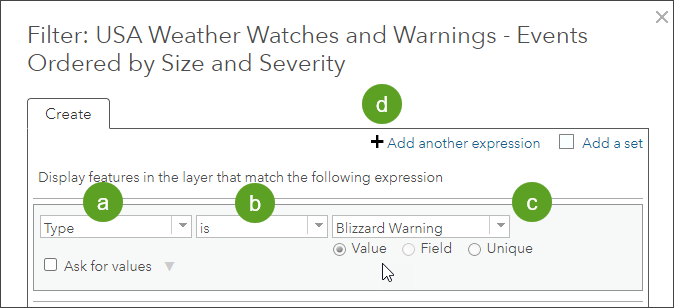
Step 6 — Construct a filter expression as follows:
a – Select Type as the attribute from the dropdown list.
b – Select is as the operator from the dropdown list.
c – Click Value and choose the value from the dropdown list. Use value instead of unique, since not all unique types may be present in the map layer at the time the filter is applied. Value will display all possible options.
d – When finished, click Add another expression.
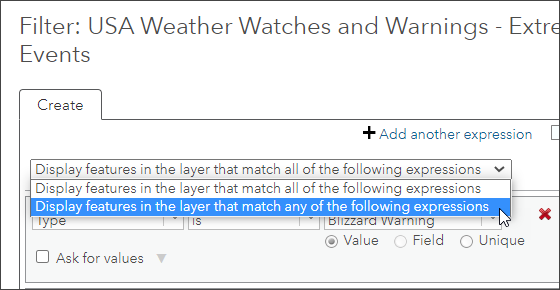
Step 7 — Once you click Add another expression, a dropdown list appears below it. Choose Display features in the layer that match any of the following expressions.
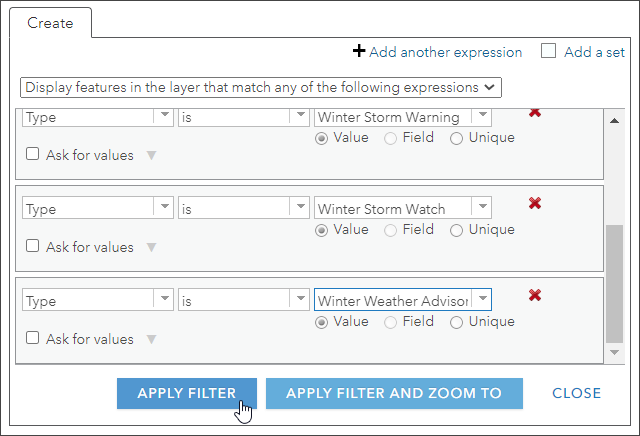
Step 8 — Continue adding filters for Type by selecting from the dropdown list until you’ve created filters for all the desired values. When finished, click Apply filter.
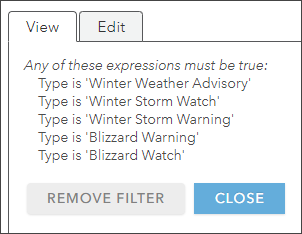
Open the layer filter again to see the current expressions. You can remove the filter, or click Edit to change, delete, or add filters.
The map shown below was made using the filters shown above.
More information
For more information, see the following:
- Apply filters (Map Viewer)
- Apply filters (Map Viewer Classic)
- Apply filters to make ArcGIS Living Atlas layers work for you
This blog article was originally published on January 29, 2021, and has been updated.

Commenting is not enabled for this article.