Note
Some capabilities detailed here are currently only supported in Map Viewer Classic. These will be available in a future release of Map Viewer.
The specific Australia fire events mentioned in this blog article are from January, 2020, and are now historical. However, the techniques and ArcGIS Living Atlas content can be applied to any current fire.
Extreme heat and a prolonged drought have generated unprecedented large-scale fires in many parts of Australia, especially in its southeast. Last year was the driest and hottest year on record in Australia, a fact that has literally fueled the fire season. As of today (January 6, 2020), over 12 million acres have burned, dozens of people have perished, many thousands of residents are homeless, and hundreds of millions of mammals, birds, and reptiles have been impacted. Using ArcGIS Living Atlas live feeds and imagery, we can learn more about the fires.
View fires using MODIS
We can examine where areas of high thermal activity (for example, fires) have been recorded using the MODIS layer from ArcGIS Living Atlas. Thermal activity is detected by sensors on board NASA’s Earth Observing System (EOS) satellites and is published as a live feed containing data collected within the last 48 hours. The feed is updated every 30 minutes. See the item details for more information.
Open a new map and zoom to the area between Sydney and Melbourne, Australia. To add MODIS to your map, follow these steps:
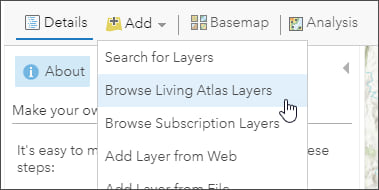
Step 1 – Click Add, then Browse Living Atlas Layers.
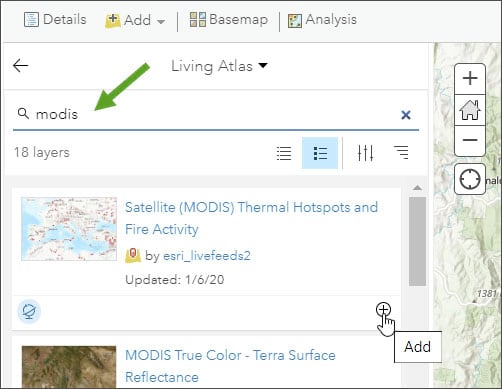
Step 2 – Search for “MODIS” to locate the feed, then click + to add the layer to your map.
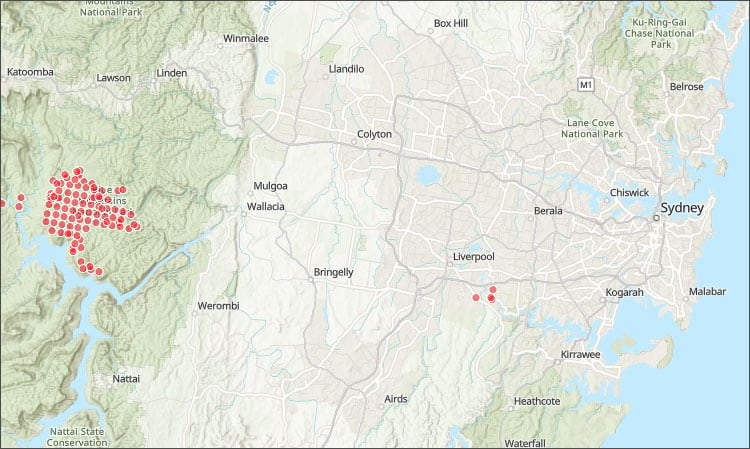
You will be able see an area of high thermal activity just west of Sydney, in the Blue Mountains National Park.
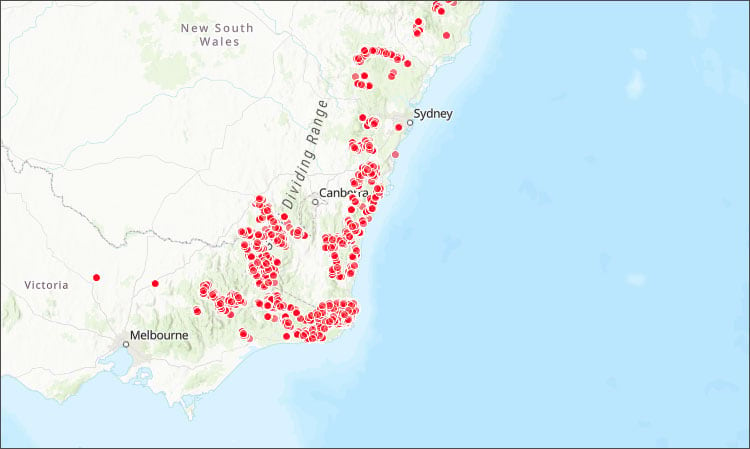
Moving the map you will see large fire areas indicated by MODIS between Sydney and Melbourne.
View fires using VIIRS
Thermal activity is detected by the VIIRS sensors on the NOAA/NASA Suomi NPP and NOAA-20 satellites. The VIIRS thermal activity layer can be used to visualize and assess wildfires worldwide. However, the satellite will detect any large thermal signal, for example oil and natural gas wells or volcanoes. See the item details for more information.
To add VIIRS to your map, follow these steps:
Step 1 – Click Add, then Browse Living Atlas Layers.

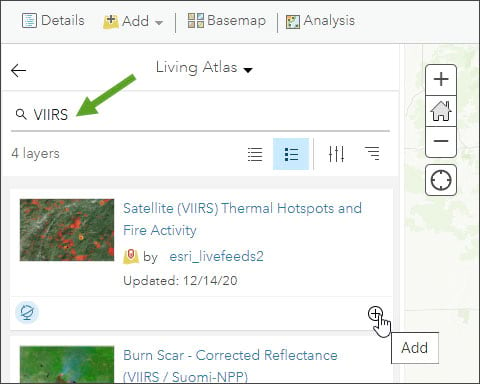
Step 2 – Search for “VIIRS” to locate the feed, then click + to add the layer to your map.
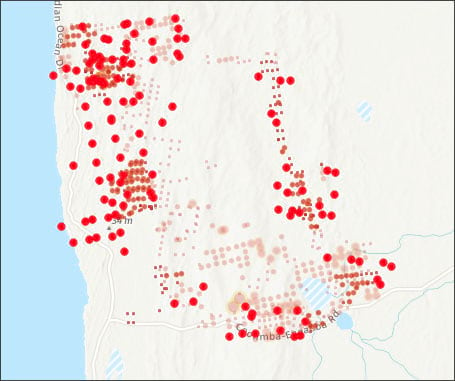
MODIS and VIIRS have a common geographic relationship, as would be expected, since both are detecting thermal activity.
View fire perimeters using Sentinel-2
Sentinel-2 is multispectral, multitemporal global imagery obtained via two satellites placed in the same orbit by the European Space Agency, and phased 180 degrees from each other. Every location on the planet is revisited every 5 days. This Living Atlas imagery layer pulls content directly from the source Sentinel-2 archive on Amazon Web Services (AWS), and is updated daily. The layer can be easily added to web maps (and scenes), and rendered in different ways to highlight specific characteristics. In addition, the imagery can be filtered by date. For more information see the item details.
To view fire areas using Sentinel-2, follow these steps. This example zooms to Blue Mountains National Park, west of Sydney, Australia.
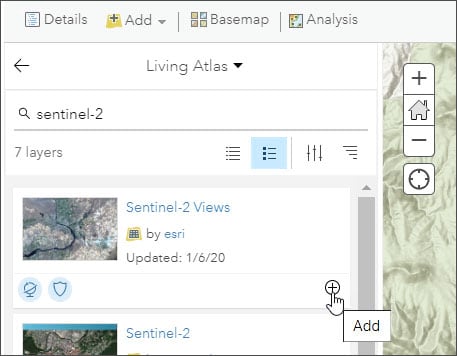
Step 1 – Add the Sentinel-2 imagery layer from Living Atlas.
This is similar to what you did with MODIS above, but search for Sentinel-2 instead.
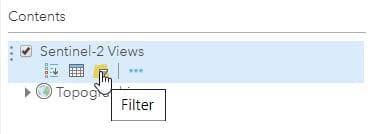
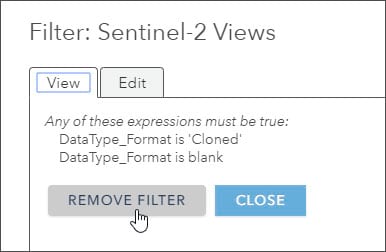
Step 2 – Remove the default filter on the imagery.
The default filter on the Sentinel-2 layer will display the most recent and clearest imagery available. You will want to search for all imagery around the dates of the fire, even smoke-filled imagery, so remove the filter so all imagery will be available. After adding the layer, click the Filter icon to display the current filter, and remove it.
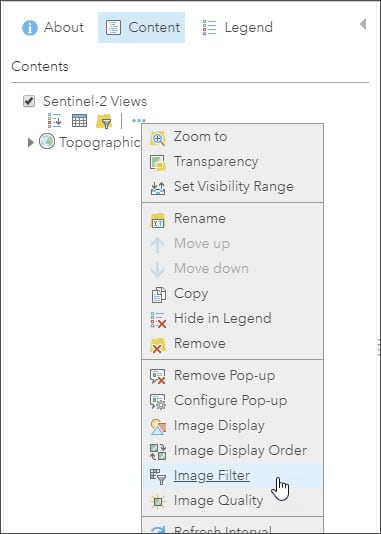
Step 3 – Click More Options (…) and choose Image Filter.
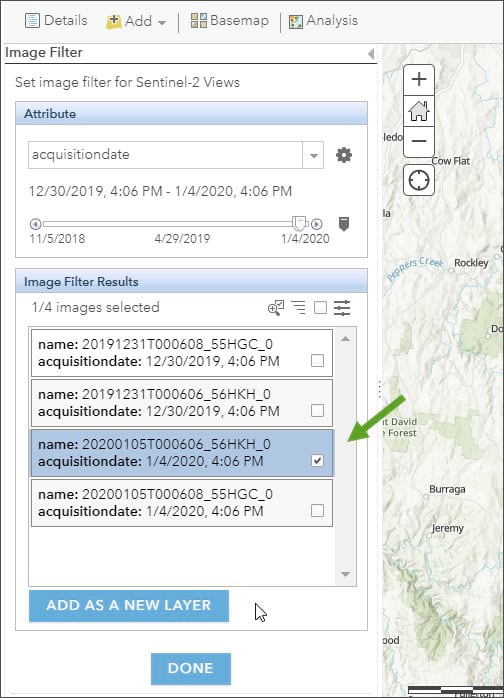
Step 4 – Select the imagery at the desired date.
Adjust the time slider to see available dates listed. Hover over each to display the coverage footprint in yellow on the map. Identify the date, then select the image that covers your area of interest best. In this example we chose Sentinel-2 imagery acquired on January 4, 2020. Click Add As A New Layer to add the imagery to your map, then click Done to return to Contents.
Adjust the imagery display
To glean more information from multispectral imagery like Sentinel-2, you can choose a renderer that highlights specific characteristics of the imagery. For example, you can choose renderers that highlight healthy vegetation, geology, moist areas, and more.
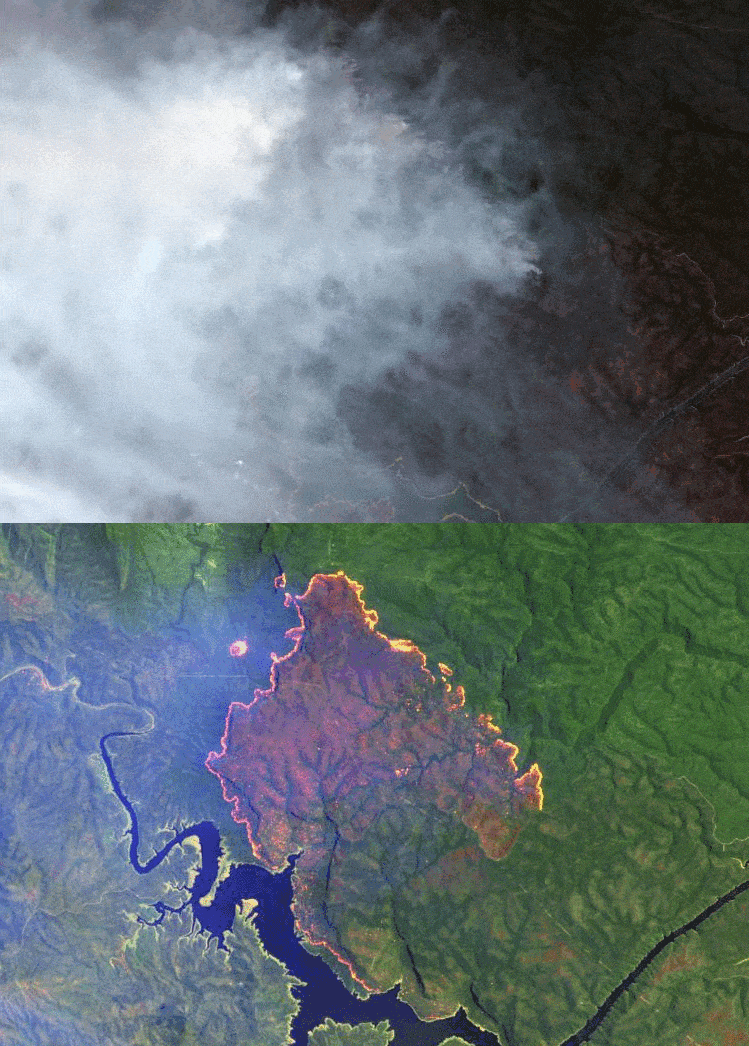
The default renderer is Natural Color with DRA (Dynamic Range Adjustment). Short-wave Infrared is appropriate for viewing active fire perimeters, even through clouds. .
Step 1 – From the layer options, choose Image Display.
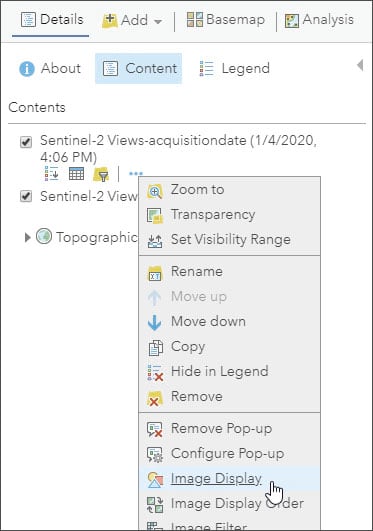
Step 2 – From the list of renderers, choose Short-wave Infrared with DRA.
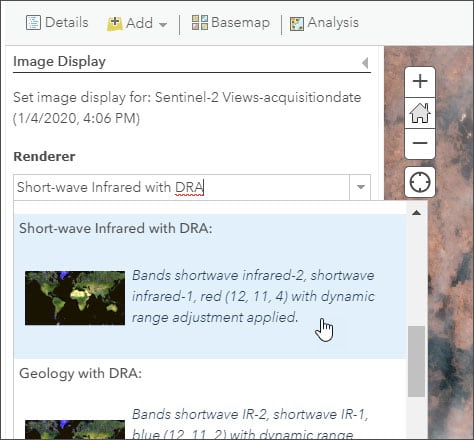
Click Apply, then Close. Using Short-wave Infrared we can clearly see the active fire perimeter for that date.
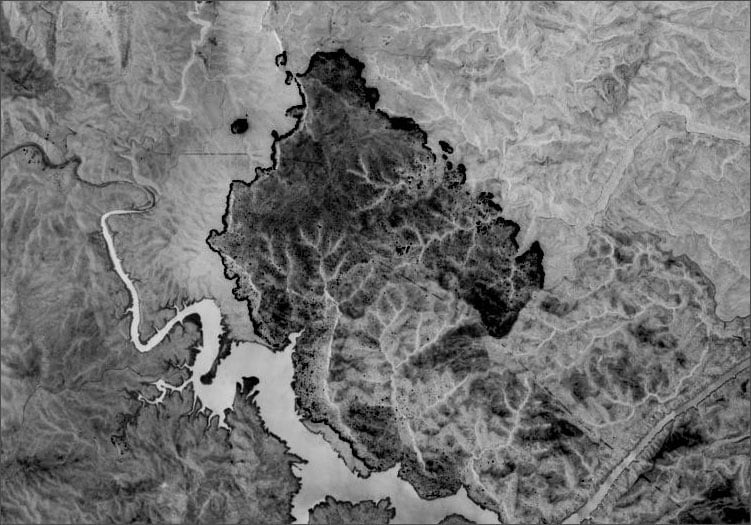
Other renderers can also be applied to highlight other characteristics of the imagery. Shown below is Normalized Burn Ratio which shows burned areas as dark gray and black.
Note that this article uses dynamic examples and specific results will vary over time. However, the methods described here can be applied anywhere, at any time.
More information
For more information see
This blog article was originally published on January 9, 2020, and was updated on December 14, 2020.

Commenting is not enabled for this article.