Imagery can be hosted, visualized, analyzed, and shared in ArcGIS Online, which assists organizations in managing and sharing their imagery data without the need for infrastructure. Once you have all your imagery data organized, ArcGIS Online allows for analysis workflows, including deep learning. For this release, there are several upgrades to the user experience for imagery in ArcGIS Online, including:
- Optimized raster analysis for select ArcGIS Living Atlas of the World imagery layers
- Support for new WCS item type
- Map viewer now supports zooming to the source resolution for imagery layers (dynamic/tiled imagery layers and WCS layers)
- Map viewer now supports the multidimensional fields (variables and dimensions) in configurations of multidimensional layer pop-ups
- New spatial analysis tools for your analysis
- New Processing templates widget to interact with imagery layers in Experience Builder
Raster analysis of ArcGIS Living Atlas imagery layers
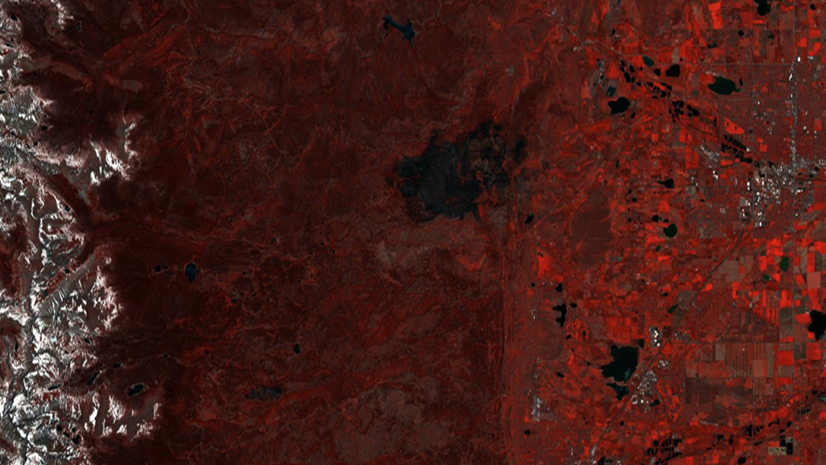
The ArcGIS Living Atlas of the world contains many different imagery layers that you can use in your work. You can add these imagery layers to your webmap for visualization or analysis in ArcGIS Online. You can further optimize raster analysis with selected imagery layers on ArcGIS Living Atlas by enabling the Raster analysis with Living Atlas data option.
The optimization requires your authorization to allow your data to be moved and temporarily stored in the same region of the ArcGIS Living Atlas imagery data, such as Deep Learning models or raster function templates. The analysis output will also be temporarily stored in the Living Atlas imagery data’s region before being transferred back to your organization.
Currently, only the Landsat Level-2, Sentinel-1, Sentinel-2 Level-2A, and NAIP Imagery layer supports such optimization.
This feature is currently in Beta. To enable it, your organization administrator can turn on this setting within the Organization settings page and under Security tab.

Note: this Beta feature currently has a known limit that the raster analysis cannot generate feature output from the selected list of Living Atlas Layers.
Support for WCS imagery layers
Similar to other OGC layer types (WMS, WFS, WMTS) that integrate with the ArcGIS Online platform, Web Coverage Service (WCS) is a dynamic image service based on an open-source specification. Users will have the option to create a WCS layer from either ArcGIS or a third-party WCS server as a new item type. ArcGIS Online applications, such as the web map viewer and scene viewer and other clients, will support the consumption of these layers.

Support zoom to source resolution in Map Viewer
Map Viewer has now added the functionality to zoom to the source resolution of the imagery layer in addition to the ability to zoom to the extent. This allows users to view the imagery at the real pixel spatial resolution defined by the cell size and uncover details that may not be seen at a coarser extent. This functionality also matches what has been available in ArcGIS Pro and removes the need to zoom in multiple times to view the imagery layer at its source resolution.

Variable and dimension fields are available for pop-ups
For tiled imagery layers, you can now see the dimension and variable values in pop-ups. Previously, it was not possible to access the variable and dimension fields in the multidimensional tiled imagery layer. Now both fields are available to be added to pop-ups to augment the pop-ups for your tiled imagery layers and work seamlessly with the time slider and multidimensional sliders.

Raster tools
There are two new raster analysis to augment your workflows. The tools are as follows:
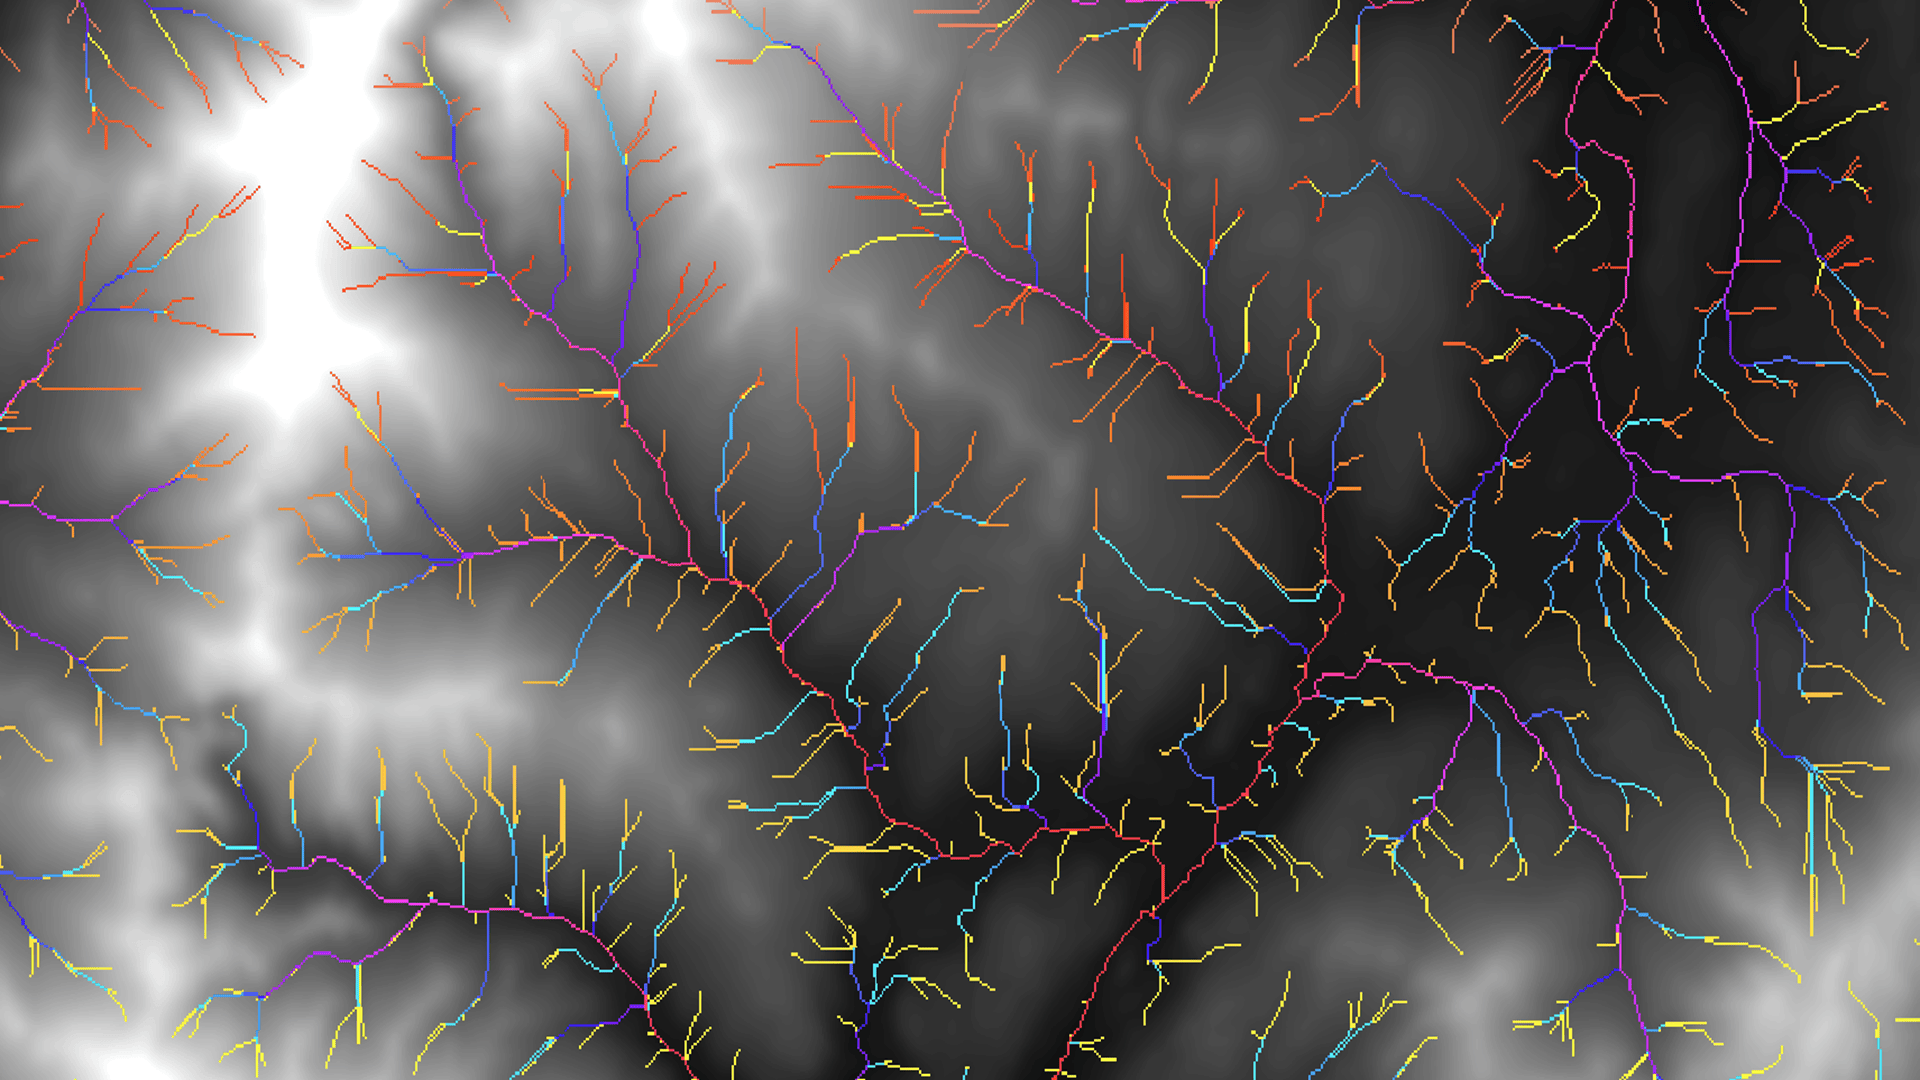
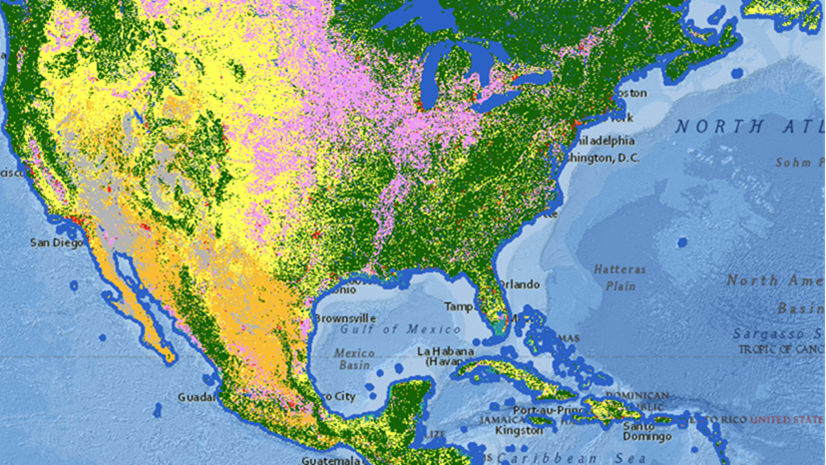
- Tabulate area – calculates the cross-tabulated areas between two datasets and reports the results as a table. You can use this tool to calculate the total area of land-use type within each watershed, summarize the area of vacant parcels within each city boundary, and so on.

- Zonal Geometry as Table – calculates four types of geometry measures for each zone in a dataset and reports them as a table. These geometries are area, perimeter, thickness and centroid. To learn more about how this tool works, see How Zonal Geometry works. An example workflow for this tool, is to calculate the different geometry types for each land-use zone.

Processing templates widget in Experience Builder
Similar to the processing templates tab in the Settings toolbar of Web Map Viewer, we added a new processing templates widget to ArcGIS Experience Builder. For imagery layers with predefined processing templates (aka. raster function templates), users can select from one of the processing templates for processing and display.
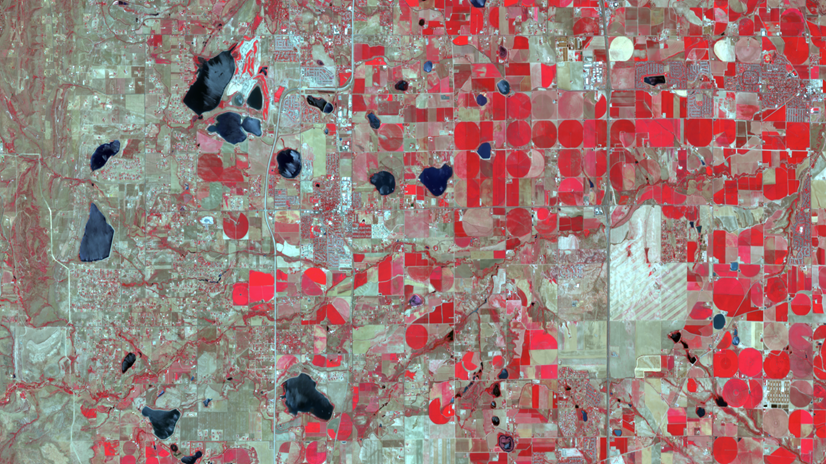
For example, a multispectral imagery layer can be configured with a colorized NDVI processing template. Users can choose to display the layer with a default RGB color composite renderer, or as a NDVI-processed image result.

Ready to take the next step?
As an ArcGIS Online user, you can start exploring these new imagery capabilities today. The Product Team is interested in your thoughts and ideas as you explore. Influence the direction of future releases when you visit us and leave a comment via the Imagery in ArcGIS Online community on Esri Community.
Are you interested in further exploration of imagery in ArcGIS Online can do for you? Watch a demo and see what others are saying about the product, such as Skytec, LLC, the City of Johns Creek, and the City of Yakima. You can also read a case study from the National Trust from the United Kingdom.


Article Discussion: