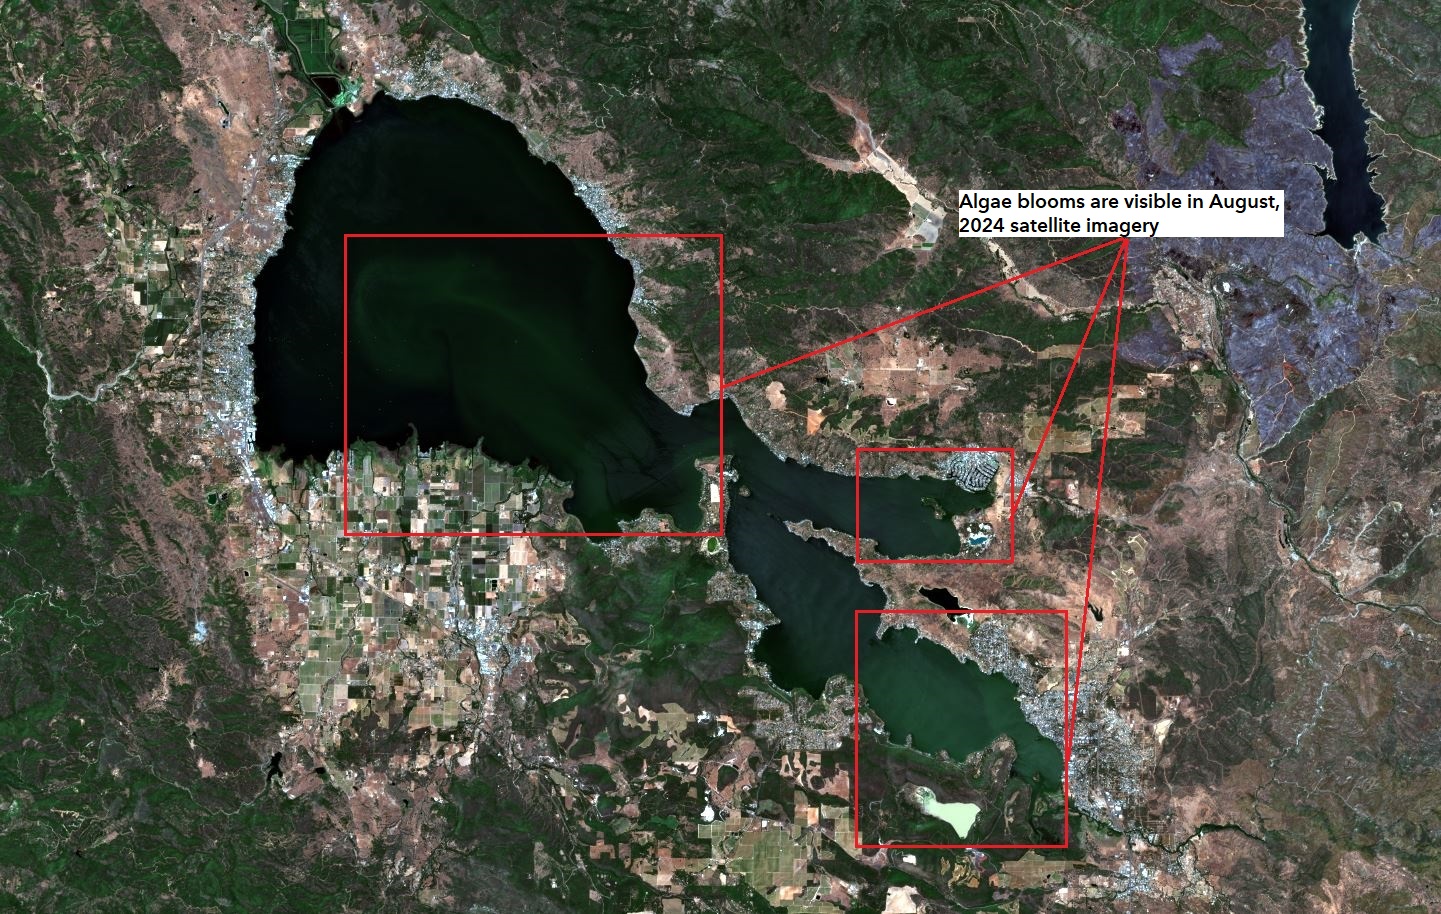
Monitoring algae bloom concentration in turbid waterbodies using satellite imagery is crucial for monitoring environmental health, as algae blooms can degrade water quality and harm aquatic life. Satellites like Landsat, Sentinel-2, NAIP and many other can detect chlorophyll concentrations and other indicators of algae presence through specific spectral bands, allowing for early detection and monitoring. ArcGIS Living Atlas of the World offers several satellite-based imagery layers, many of which include multiple time periods, providing a comprehensive view of the study area. By leveraging these satellite imagery, we can efficiently identify and monitor blooms in turbid waters.
This blog will guide you through the process of using Image collection explorer in combination with a Raster function template (RFT) to identify areas with higher concentration of algae over time. The Monitoring Algae Bloom Concentration In Turbid Water bodies raster function template from the Living Atlas will be used to identify the algae blooms. The detailed workflow for selecting imagery through the Image collection explorer is covered in another blog here.
Background
The algae concentration monitoring will be accomplished through water quality indicators to detect the water present in the imagery and the chlorophyll concentration within the water. The NDWI (Normalized Difference Water Index) will be used to detect water and the chlorophyll concentration will be determined with the NDCI (Normalized Difference Chlorophyll Index). By comparing these indices across two years change detection techniques can reveal patterns and growth trends in algal bloom presence.
Requirements
To complete this tutorial, you will need to have an ArcGIS Online account to add the imagery layer to a web map and you will need to have a Professional, or Professional Plus user type, which you will need to perform raster analysis.
Study area
The study area is Clear Lake, California, which is an ideal location for studying algae blooms due to its large size, relatively shallow depth, and history of frequent algal blooms. A time period between August and October is more suitable, because warmer water temperatures and increased nutrient levels typically lead to more frequent and intense blooms.

Which satellite sensors are compatible
This RFT is compatible with various satellite sensors that capture key spectral bands for analysis. Commonly used imagery layers include Sentinel-2 MSI, which offers high-resolution imagery with red-edge band (Band 5), which is more suitable towards this analysis. Landsat and NAIP provide red and near-infrared bands for medium and high resolution analysis of chlorophyll and water quality. Although near-infrared can sometimes yield low or unclear values over water, masking land areas and isolating water bodies can help reduce interference and get more accurate results.
Workflow
Step 1: Prepare the layer
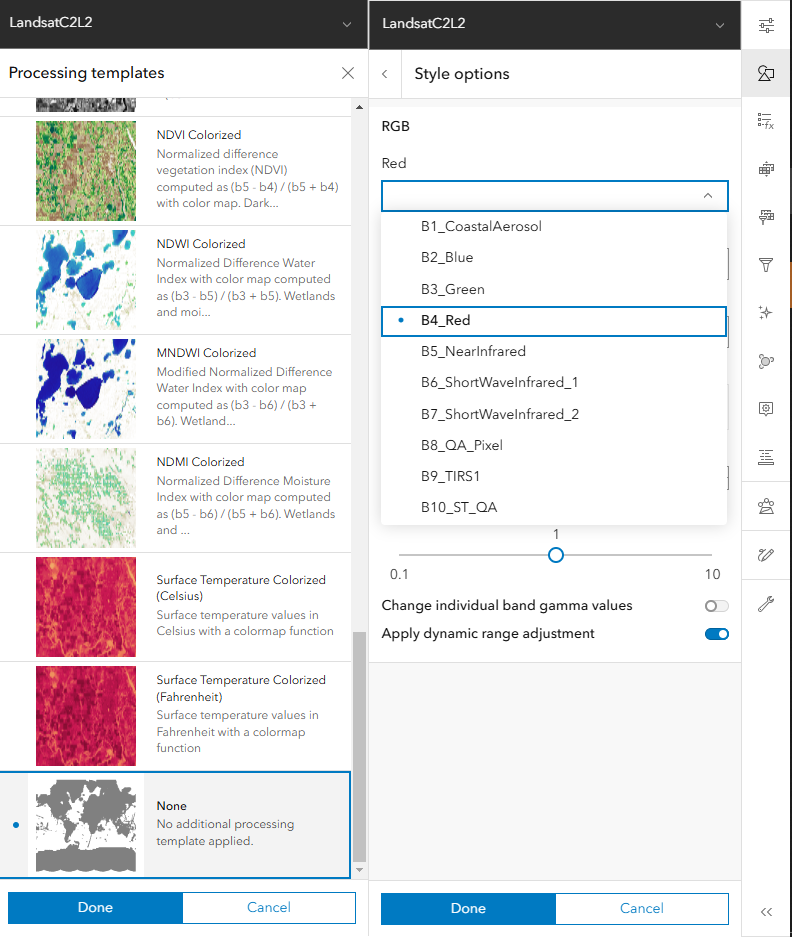
First, add Landsat Level-2 Living Atlas layer to Map Viewer, then sett the layer’s default processing template to ‘None’ to ensure that all the bands are available for the analysis workflow. You can access it through the Processing Templates pane on the Settings (white) toolbar. Once this setup is complete, use the Style pane to confirm that all required bands are available for analysis.

Step 2: Access Raster Function Template in Map Viewer
Raster function templates can be accessed in the Map Viewer through the Analysis Pane, which is on the Settings (white) toolbar. The RFT can be opened by selecting either the Raster Functions tab or by navigating to the Raster Function Templates tab. Once you are in one of these tabs, click to open or browse the raster function template, and change the selection group to the Living Atlas, where you will find a list of shared list of RFTs from which you can add the Monitoring Algae Bloom Concentration In Turbid Waterbodies. Once this step is completed, the RFT should appear as shown in the image below.

Step 3: Compute algae concentration
Once you open the raster function template you can see various raster functions has been used to analyze the algae bloom concentration in this study area. First, we have used Band Arithmetic function to create a NDWI or MNDWI index. Since the focus is on water areas, we have created a mask using the Calculator function. This has been applied to retain only those pixels where value are greater than zero, effectively isolating water bodies and excluding land areas from the analysis.
Next, to detect algae blooms chlorophyll index has been calculated using the Band Arithmetic function. For this analysis, we have applied the Normalized Difference Chlorophyll Index (NDCI) method, using the red (Band 4) and red-edge (Band 5) bands. Formula used is: (Band 5 – Band 4) / (Band 5 + Band 4). The red-edge band is highly effective for detecting algae, especially in aquatic environments. If you are using Landsat or other datasets, you can alternatively use the NIR band or apply the CIg index, which is particularly useful for monitoring chlorophyll levels.
If you are working with a large dataset, use the Clip function to focus on the region of interest where you expect to find the algae bloom. This also helps isolate water bodies from surrounding land areas for more focused analysis.
Once the NDCI outputs are generated for both time periods (T1 and T2), we can perform change detection to assess how algae bloom concentrations have changed over time. Using the Compute Change function, we subtract the NDCI of T1 from T2. The resulting raster highlights areas with increased chlorophyll concentration providing insights into the temporal dynamics of algae blooms within the study area. In the analysis results, the brighter red shades indicate higher concentrations, while other colors represent medium to no concentration.

Conclusion
In this blog, we have effectively mapped and monitored algae bloom variations over time. Variability in spatial, spectral, and temporal resolution across different satellite sensors could impact accuracy particularly in chlorophyll detection where other water constituents may interfere the analysis. In summary, this analysis provides valuable insights into algae bloom trends, this workflow so can also be applied to other datasets, different indices, based on available spectral bands for other applications. We hope this blog has helped you understand the raster analysis workflow, made it clear how simple it could be to leverage readily available data and out-of-the-box raster functions for insightful analysis.
The Product Team is interested in your thoughts and ideas. Influence the direction of future releases when you visit us and leave a comment via the Imagery in ArcGIS Online community on Esri Community.


Article Discussion: