Working from home for the past couple of months, I have had a daily view of the operations employees that are responsible for the upkeep of the apartment complex where I live. They inspect the same assets week in and week out, but the condition and work performed on them differs each time. The assets have certain properties such as ID, material and type that are unlikely to change, and other properties such as inspection date and work performed that may be different at each inspection. This is a common scenario in many industries but is especially prevalent in maintenance work.
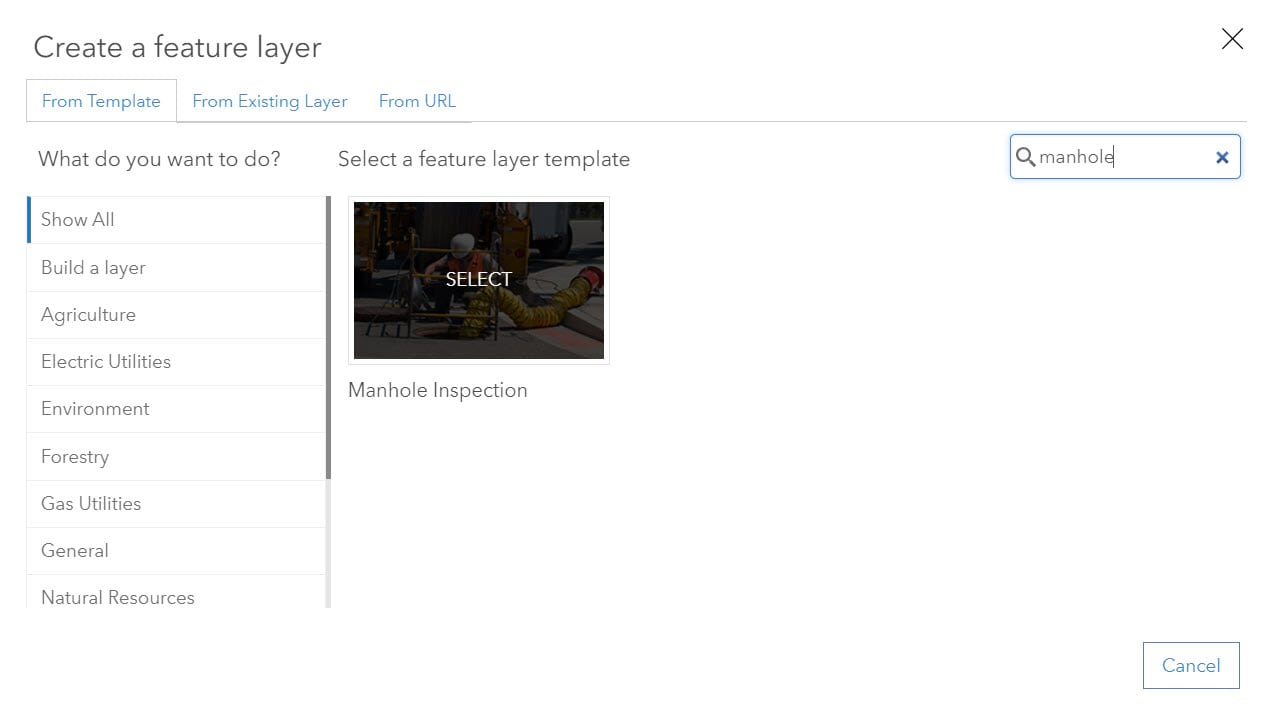
Using related tables in ArcGIS Online, as we collect data points for the same geographic feature over time – for example, daily inspections – we can quickly and easily see what our previous values were. The easiest way to get started is with a template from ArcGIS Online. For the purposes of this article, let’s say that I am working as a GIS Analyst for my hometown of Eugene, OR and want to streamline manhole cover inspections. To begin setting up for data collection, I’ll select the Manhole Cover Inspections template. The template includes fields in the feature layer that will be the same each time the manhole is inspected, such as cover type and flow direction, and has the inspection schema in the related table.
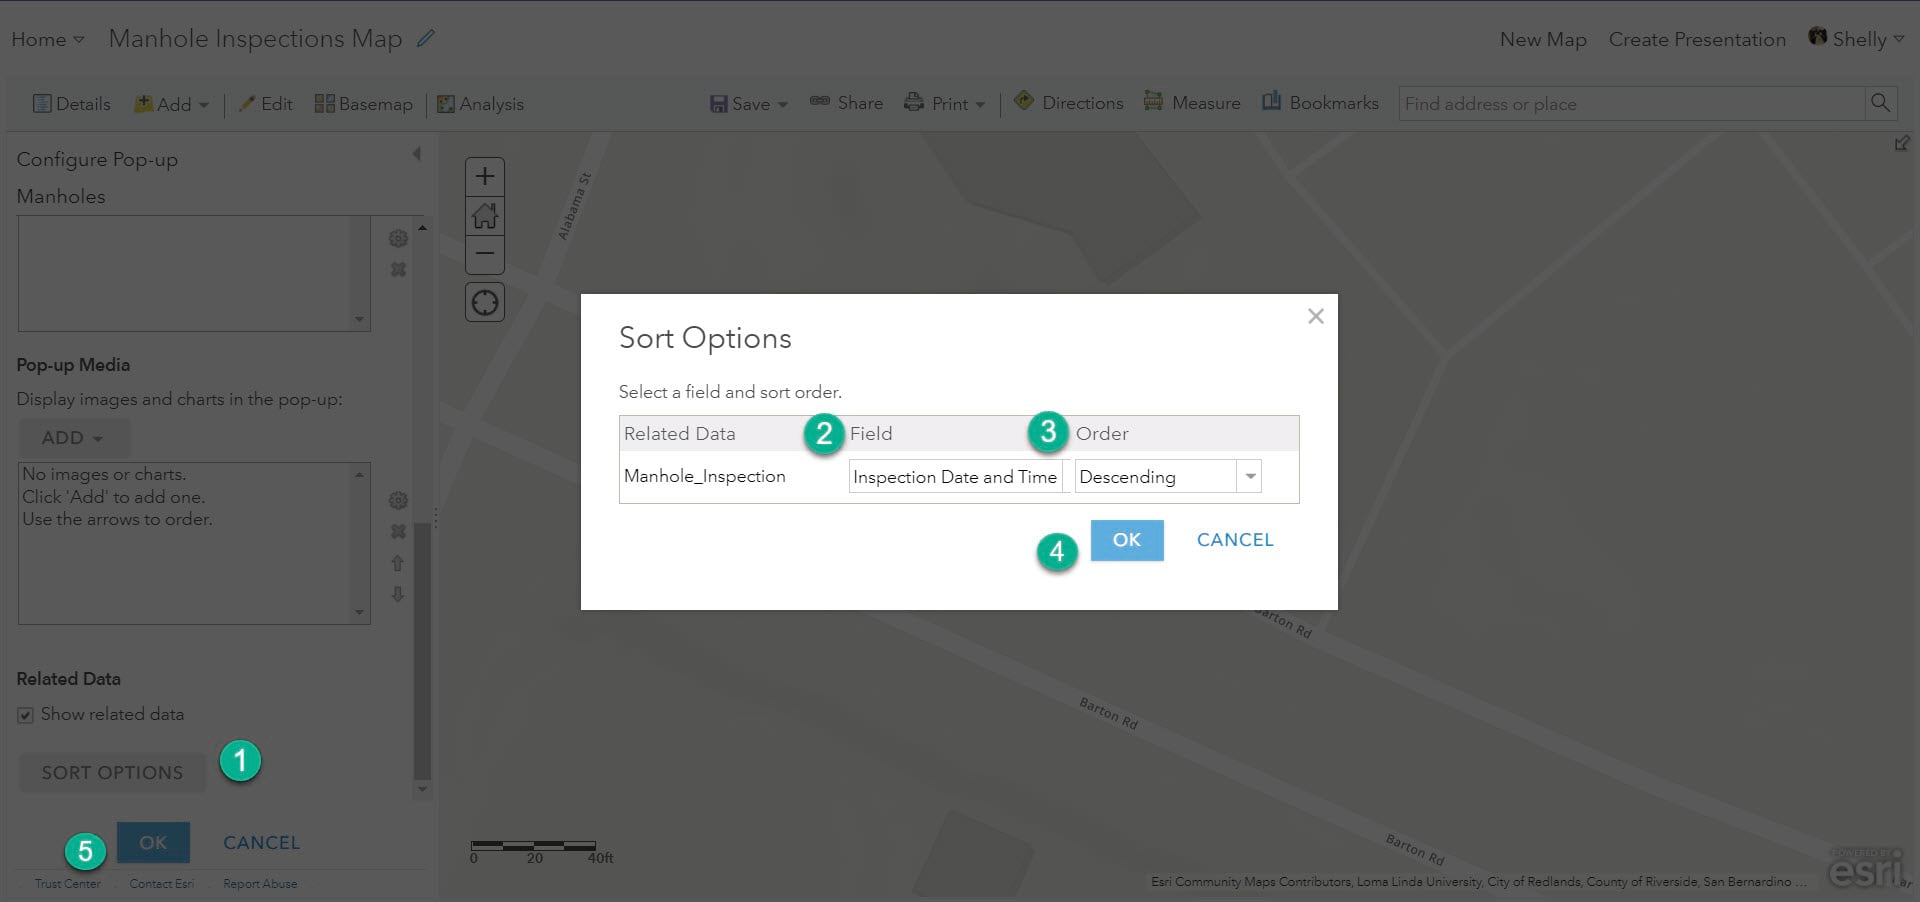
Now that we have our template published , we’ll configure the editing form and pop-up to prepare for smooth field data collection. This can be done in the web map or on the hosted feature layer visualization tab. In this case, the editing form and pop-up are already looking good, but we will choose to sort the related records in a descending order on the inspected date and time. There are many more form configuration options here that we won’t get into today, but are worth looking into as you implement this workflow.
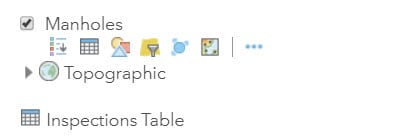
We can also update the layer names and pop-up titles to be even more clear for our field workers.

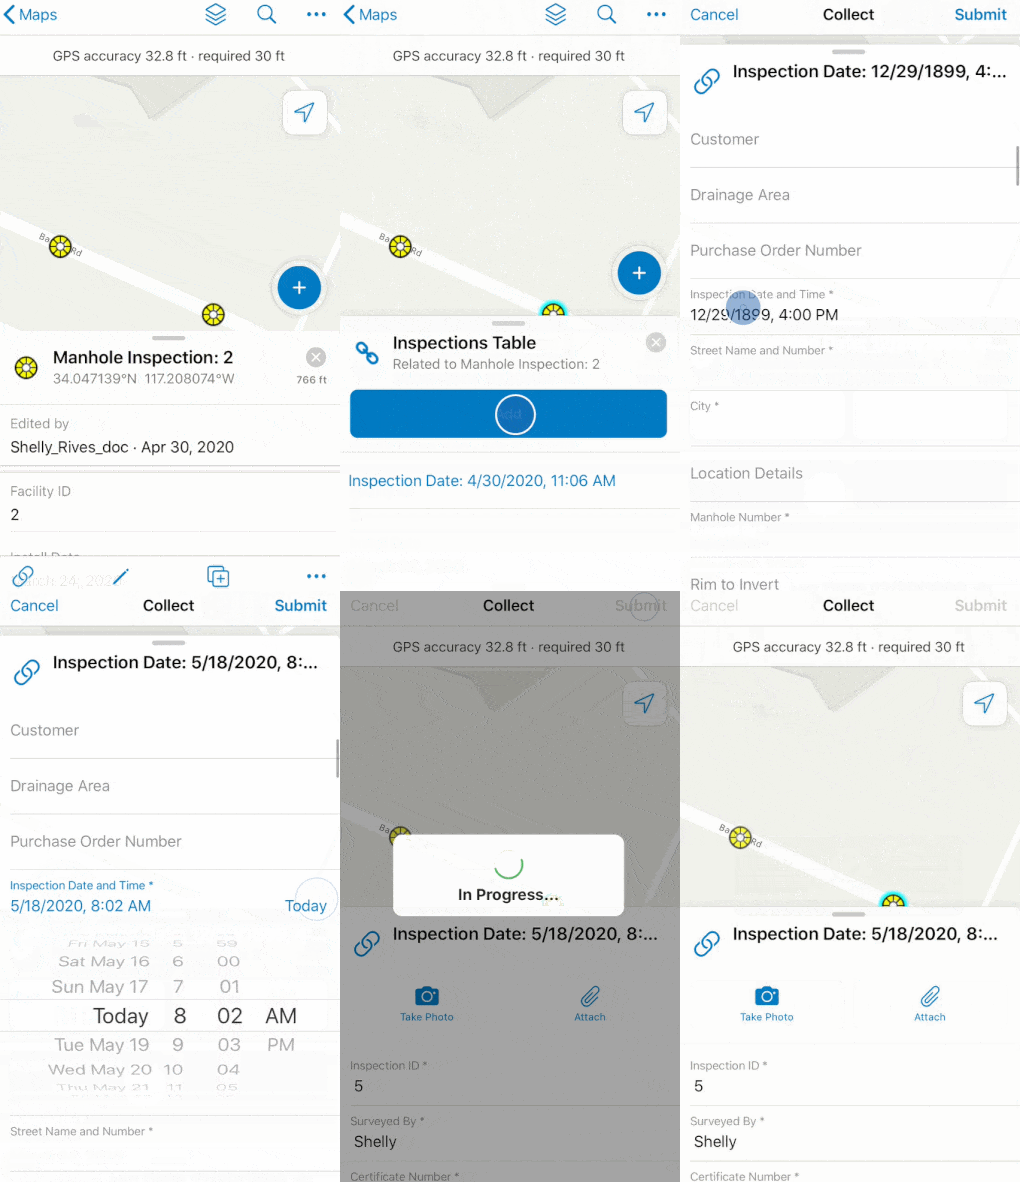
Now that the map configuration looks good, we can save the web map and by default it will be available for use in Collector for ArcGIS. We’re now ready to go inspect some manholes in the field with Collector! I can interactively select a manhole on the map and click the 🔗 icon to access the inspections table. After filling out some fields, such as Inspection ID and the date, I can submit my inspection. See this documentation for more on inspections with Collector and submitting related reports.
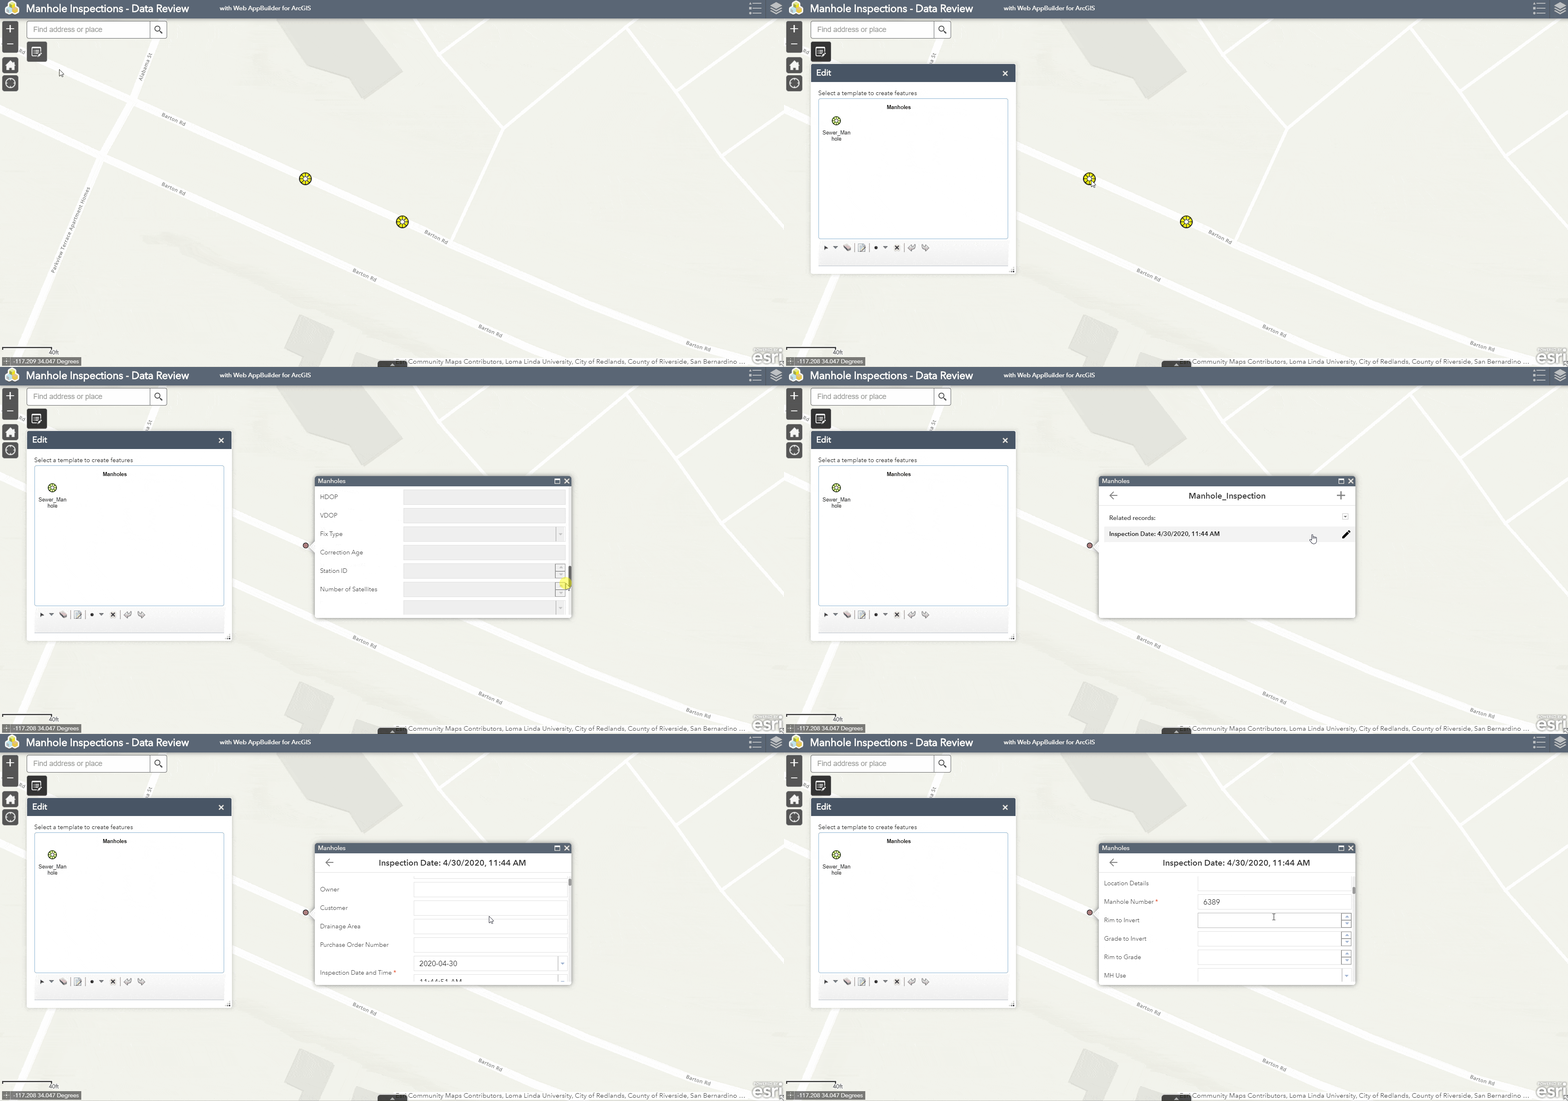
After completing all our inspections, there needs to be some quality assurance and control (QA/QC) done. QA/QC of inspections is an important part of the process and Web AppBuilder is a great tool to accomplish this. I’ve created a Web AppBuilder app with the Edit widget where the data updates instantly after the inspections are completed and it can be double checked in the office.
Finally, it would be great to share the most pertinent inspection data with local citizens. However, they probably don’t care too much about the granular details of manholes, and we also need to make sure that the layer shared with the public is view-only. A non-editable hosted feature layer view and custom pop-up configuration showcased in a clean, focused web application, such as my choice of Media Map, is just the ticket.
Using an Arcade expression, I can bring the last inspection date and status into the feature layer’s pop-up. The Arcade expression uses the $datastore global variable and a SQL query to connect a feature to its related records. You can learn more about configuring pop-ups here, and more about accessing related records in pop-ups in this GeoNet article.
//create the SQL expression to map a feature to its inspections:

var tbl = FeatureSetByName($datastore,"Manhole_Inspection")
var code = $feature.GlobalID

//the related records are created on GlobalID/AssetGUID

var sql = "AssetGUID = '" + code + "'";
console(sql)
var inspections = Filter(tbl,sql);
var total_inspections = Count(inspections)
var last_inspection_date = ""
if (total_inspections > 0) {
    var ordered_inspections = OrderBy(inspections, 'DateTime DESC')
    var latest_inspection = first(ordered_inspections)
    var condition = $feature.CONDITION
    var latest_date = Text(latest_inspection.DateTime, 'M/DD/Y')
    last_inspection_date = "was last inspected on " + latest_date +
	"." + TextFormatting.NewLine + "" + TextFormatting.NewLine +
	"The condition of the manhole is " + condition + "."
}
else {
    last_inspection_date = "has not been inspected yet."
}

return last_inspection_date
As a citizen, I can browse to the public application and quickly see the last inspection date and condition of each manhole.
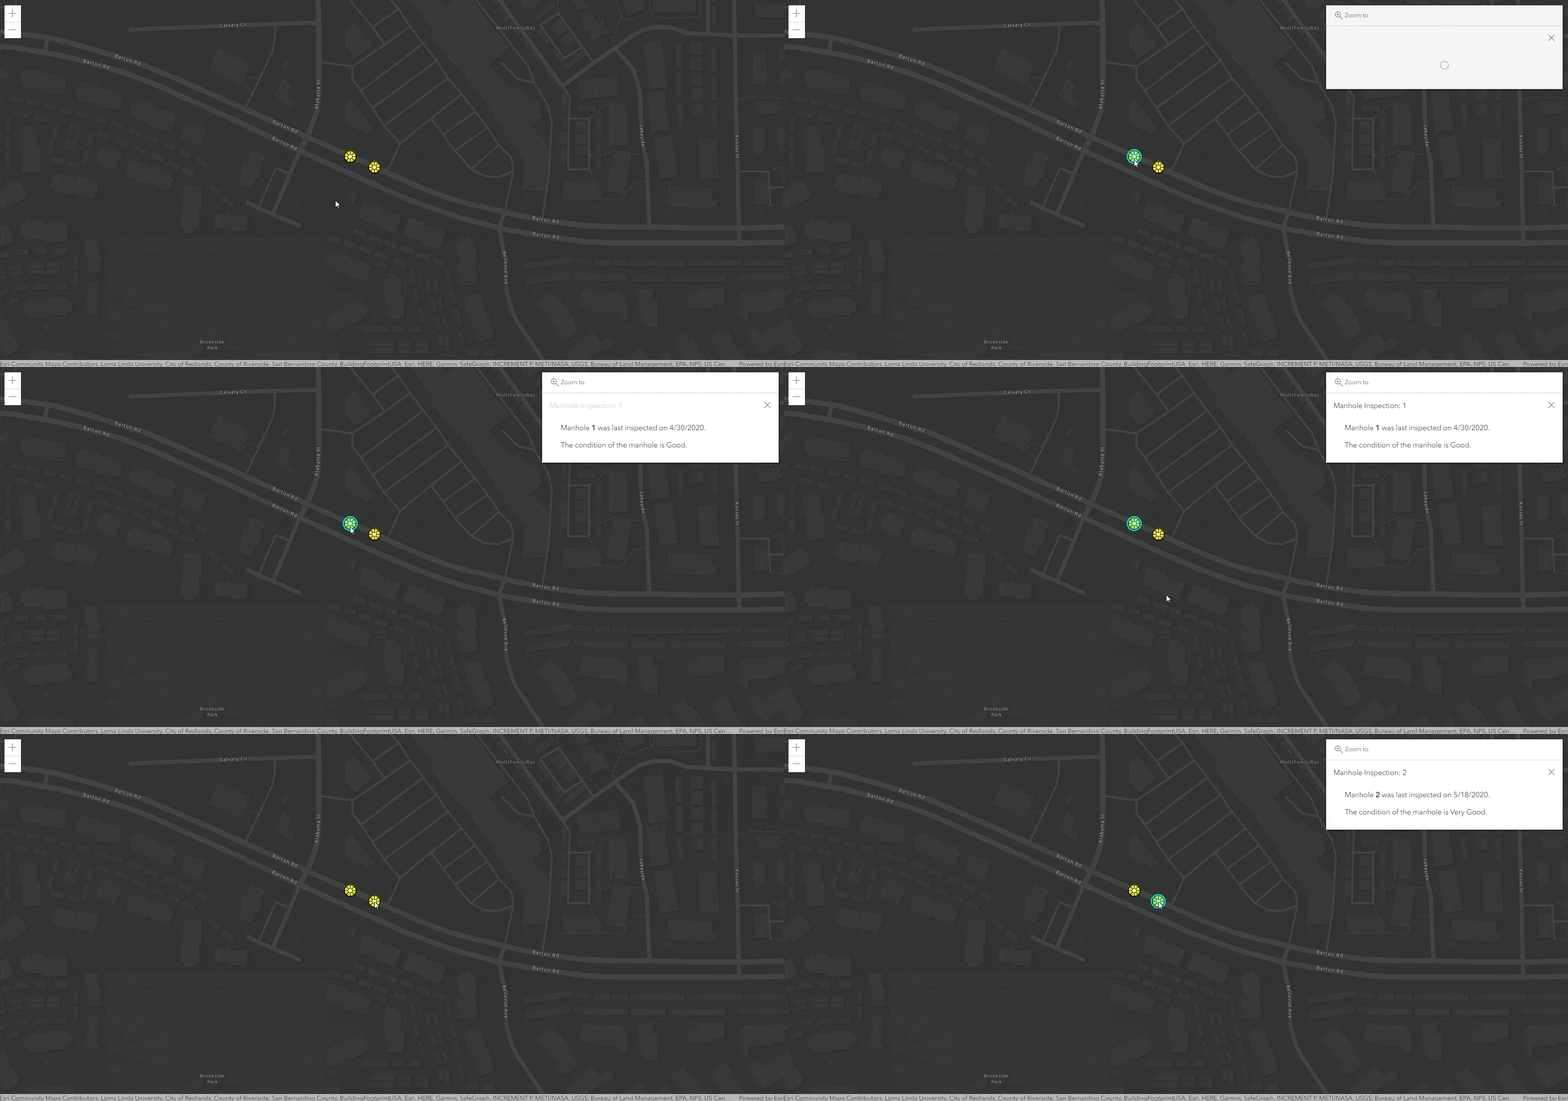
In this workflow, we created a feature service with a layer and related table in ArcGIS Online, authored a web map for data collection, performed an inspection in Collector, QA/QC’d the inspections, and finally presented the last inspection date and manhole condition to the public in a sleek, interactive web app. The next time field workers go out and do inspections, new records will be created in the related table, creating an inspection history, and the public-facing web app will dynamically update to show the last inspection date.
What assets can you apply this workflow to? Thanks for reading and let me know your thoughts and questions in the comments section below.

Article Discussion: