Your table is ready. Right this way please.
Yes, with the July 2020 update of Map Viewer Beta, you can now view your attribute data in a table. Tables are an essential part of the map because you often need to see a layer’s attribute data to really understand what information is being shown. Plus, tables list the other attributes that aren’t being visualized. Sometimes, gaining an understanding of these other attribute values can help you display your layer in different ways, communicating different messages. You’ll quickly find that working with tables in Map Viewer Beta is really no different than working with tables in the original Map Viewer or on the Data tab.
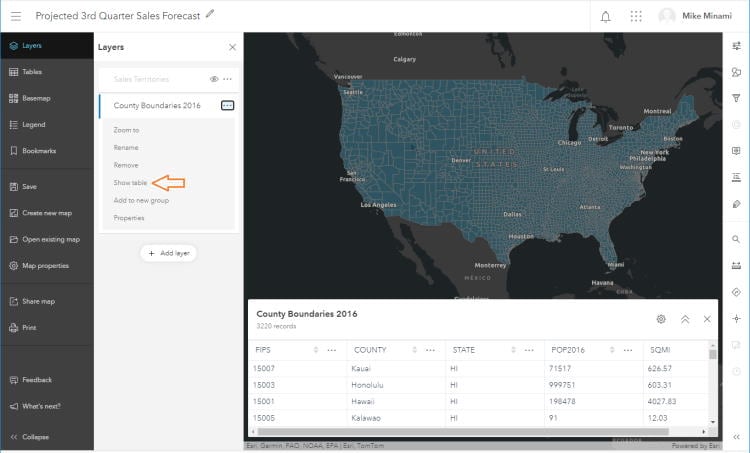
If you’ve been using Map Viewer Beta, you may notice the Table button on the Settings toolbar (right side) is gone. Now, to open a table, you’ll use the Contents toolbar (left side) to open the Layers pane and select ‘Show table’ in the options menu.

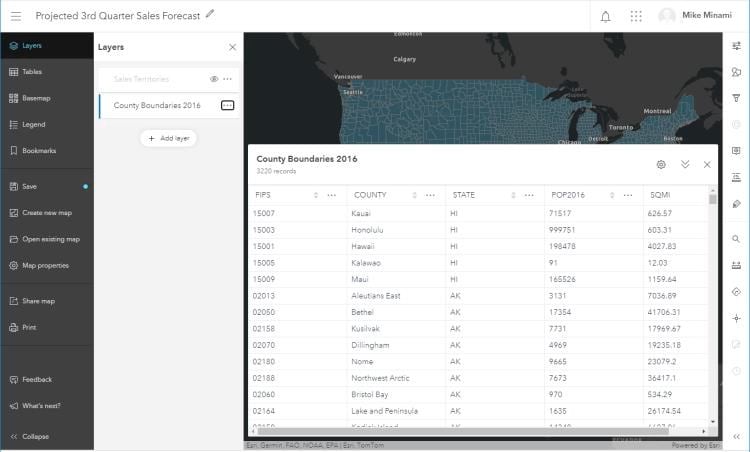
When opened, the table appears at the bottom of the map. The table contains common capabilities, such as:
- Sorting on a field
- Dragging columns to reorder fields
- Changing the column widths
- Showing and hiding fields
- Expanding the table to see more rows
- Getting field information, including field type and description
- Applying a filter
- Editing records, if editing is enabled

Our main goal for this update was to introduce tables and begin gathering your feedback, so let us know what you think. Meanwhile, we’re continuing to work on additional capabilities that we plan to release in subsequent updates. These capabilities will be coming soon:
- Saving table settings such as field order and visibility
- Selecting table rows to highlight features on the map
- Viewing related records
- Formatting fields
- Calculating fields
- Adding and deleting fields
- Displaying non-spatial tables
So, while your table is ready, it’s going to take a little longer for the rest your meal to be done. Thanks for your patience.

Article Discussion: