The November 2024 ArcGIS Online update introduces new features and key updates throughout the site. The same applies for ArcGIS Instant Apps, as we have rolled out many updates and new features to our existing apps, further improved choosing and managing your apps on the Instant Apps home page, introduced three new app templates, and addressed various bugs and enhancements to help stabilize and improve your experience across the site. See the highlights below.
New app: Compare
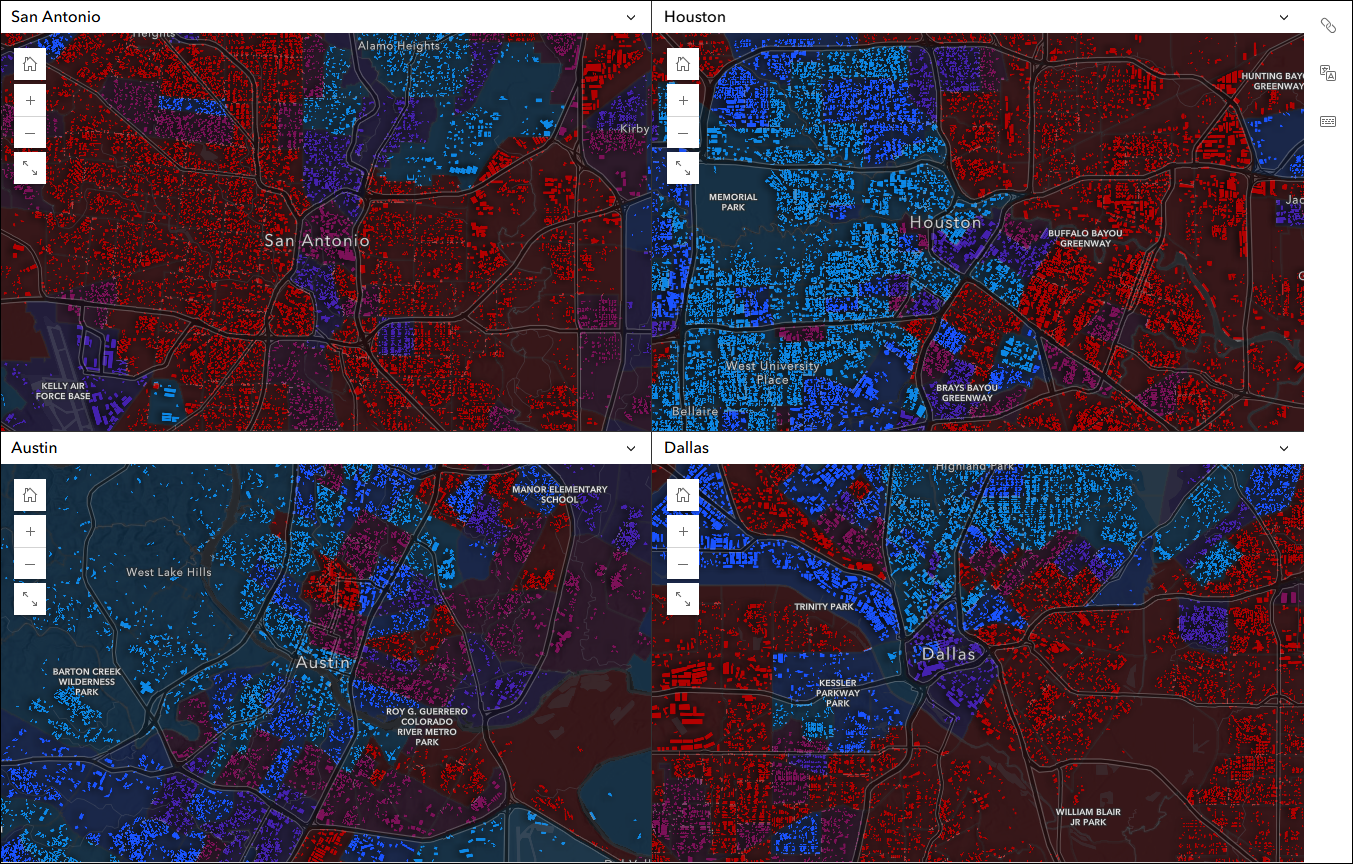
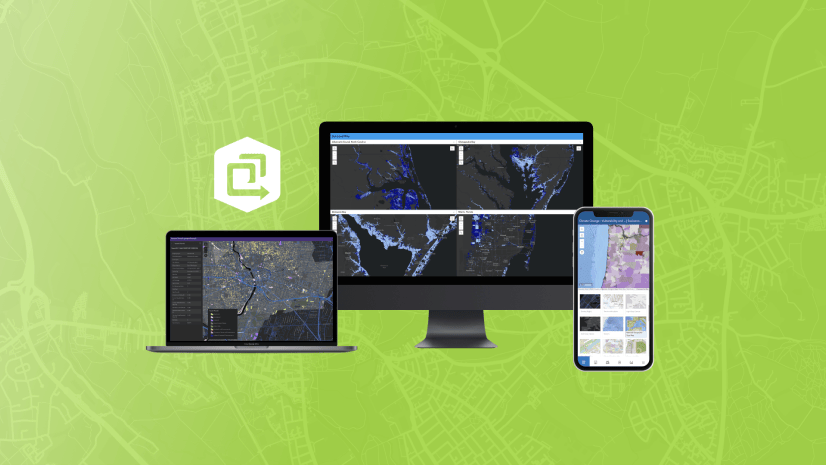
Visualize data at one or more locations using multiple maps and scenes with side-by-side or stacked layouts in the new Compare app template. Choose between two comparison modes to compare multiple maps at the same location or compare multiple locations of the same map. This app supports up to 4 maps, scenes, or a combination of both. Import bookmarks or slides, or create locations manually to compare areas of the same map or scene. The views can be synced or unsynced when using the app.
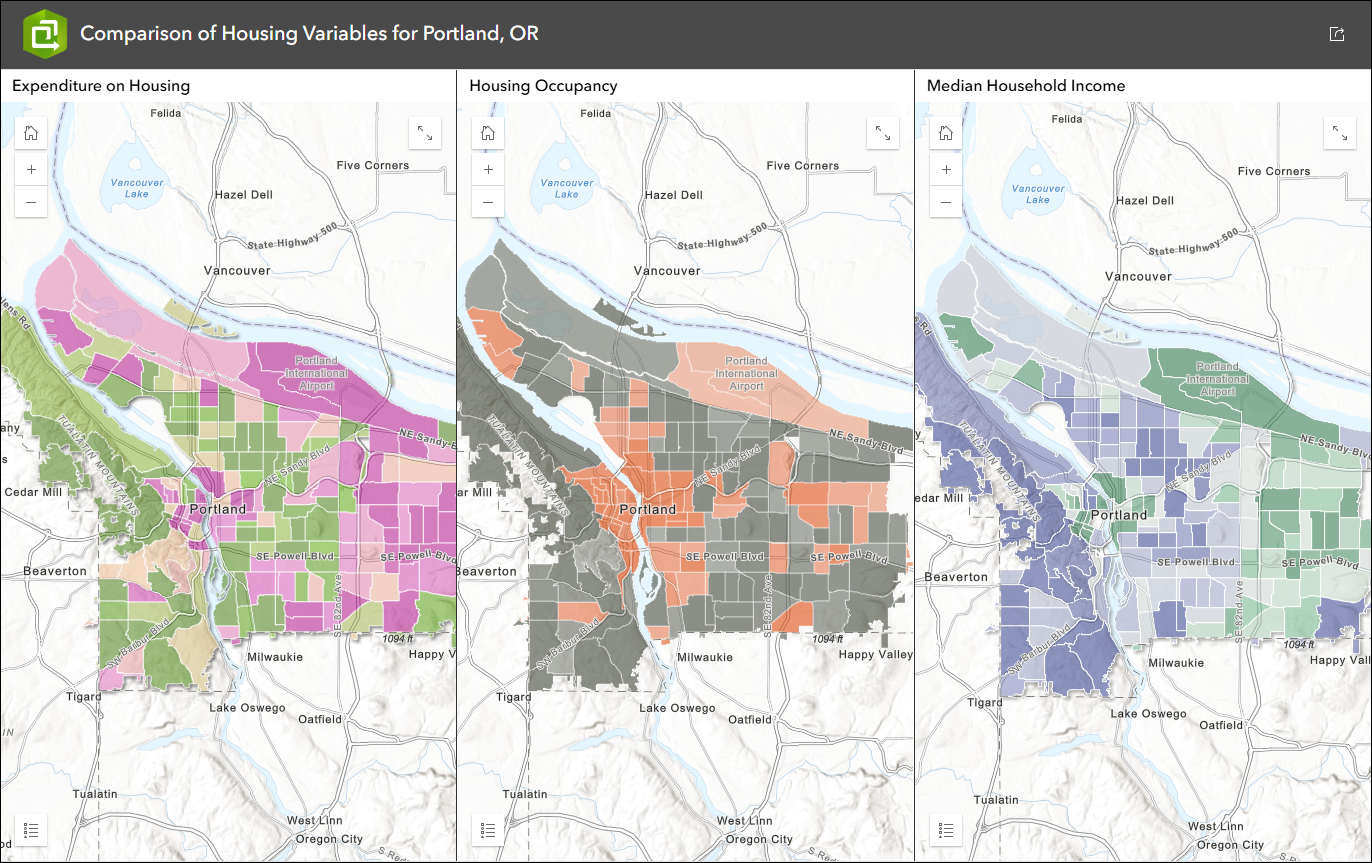
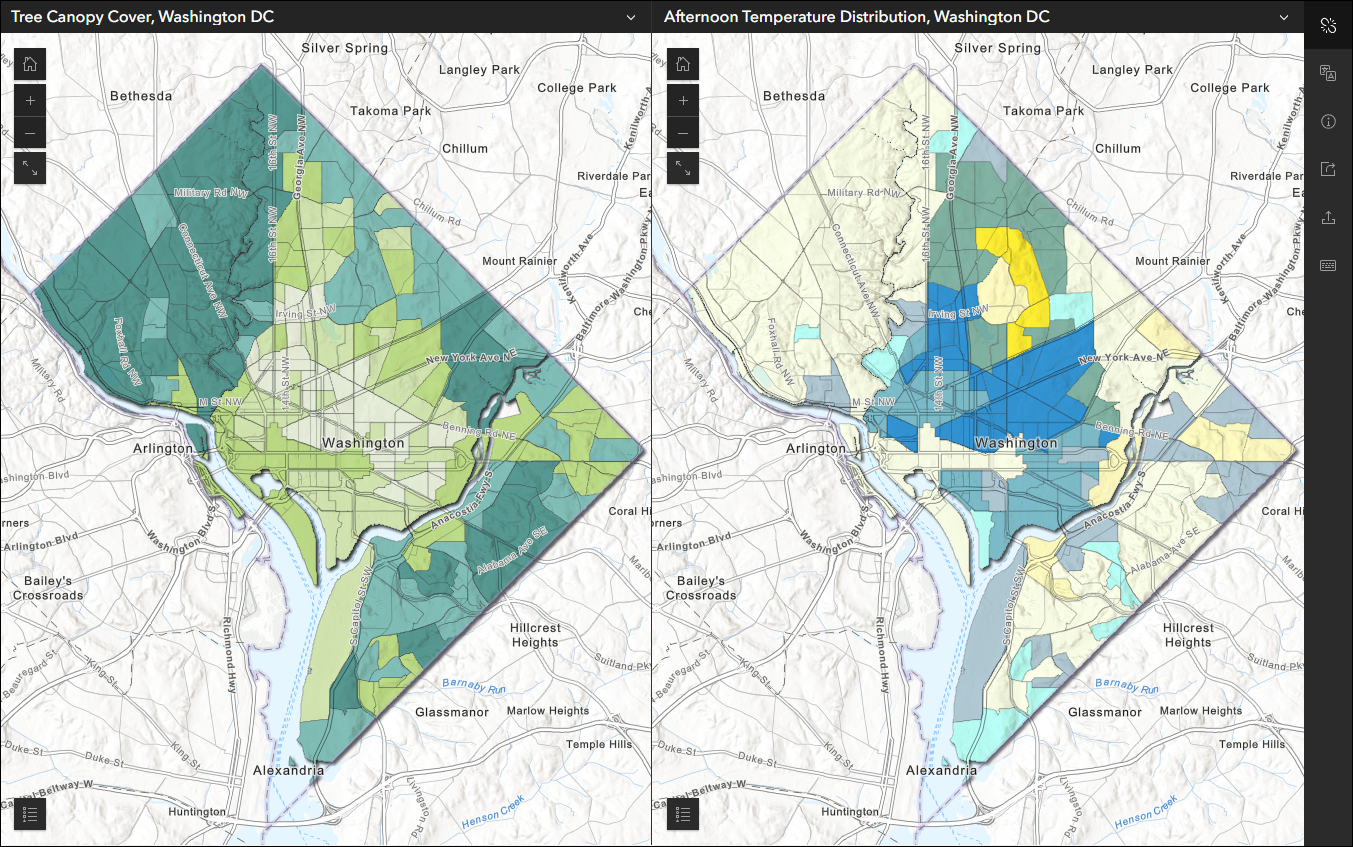
Use Multiple maps mode to compare different data at the same location such as housing cost, homeownership, and median income. Use the app configuration to choose each map containing the different data variables.
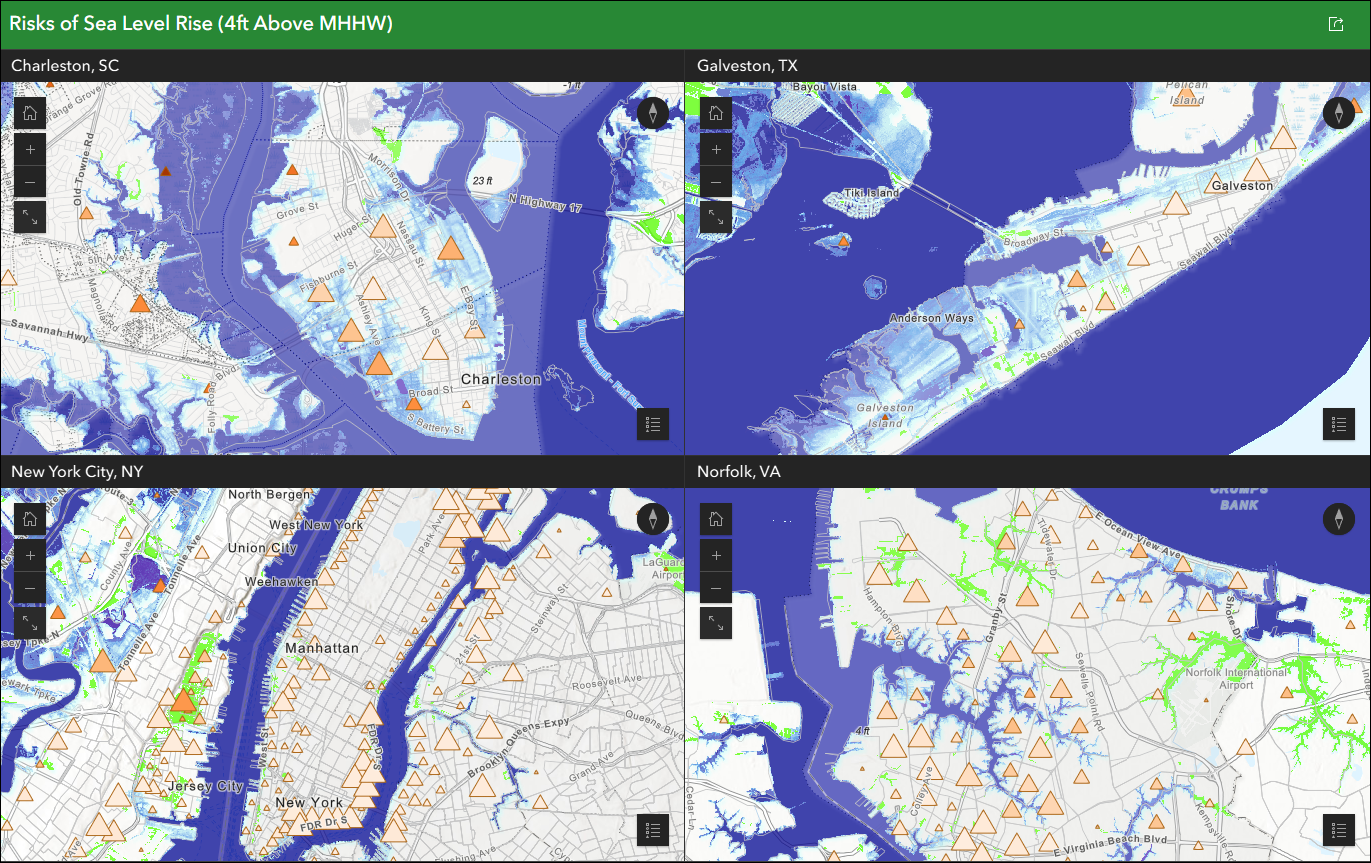
Use Single map mode to compare data at multiple locations, such as the impact of sea level rise for different global cities. Choose a map containing sea level rise data in the app configuration then create locations manually to add to the layout or import bookmarks to automatically create locations to compare.
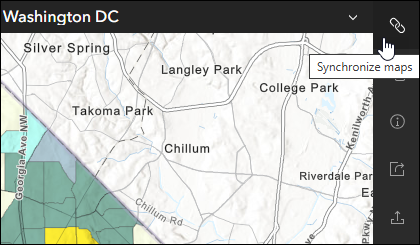
Map synchronization has been updated and simplified. Enable the “Synchronize maps” setting in the configuration to add a sync button to the app. The app viewer can use this button to enable universally synchronized map navigation across all maps or locations in the app. Enable the “Synchronize maps on load” setting in the configuration if you want the app to load with all maps or locations automatically synced. For simplicity reasons, this setting uses the extent of the map chosen as “Map 1” in the configuration.

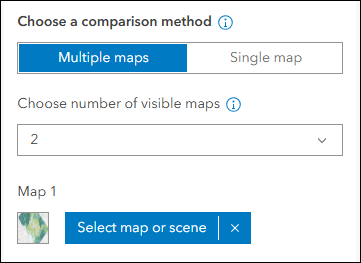
A new setting has been added to both comparison modes to let the app creator decide how many maps or locations are visible in the app layout. Use this setting to have control over the look and feel of the layout regardless of the number of maps included for comparison. For example, choose to have “2” visible maps in the layouts to preserve the side-by-side look but offer up to four different maps in the app to compare. The app viewer can access the additional maps using the drop-down menus on the title headers.
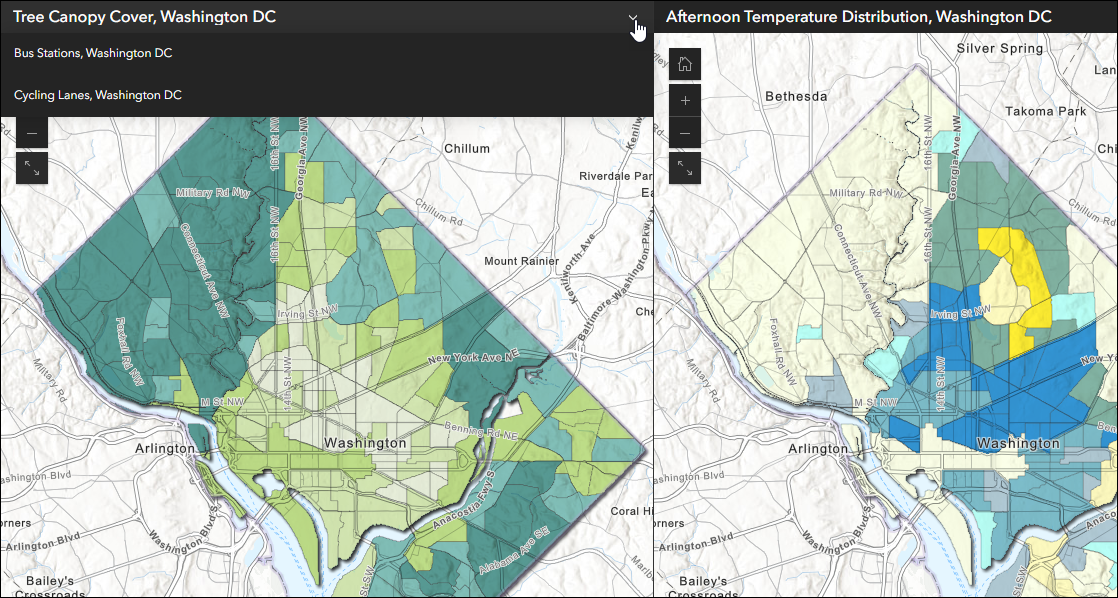
Also new is a right-side toolbar that contains universal tools. These are any tools that are universal to the whole app such as Synchronize maps, Language switcher, Share, etc. Note that this toolbar is conditional to the presence of the app header. When the app header is enabled, these tools will display in the header and the right-side toolbar is removed.
Take a look at our ArcGIS Instant Apps: Introducing Compare blog for a full introduction and information about how to take advantage of Compare’s most useful abilities and settings.
New app: Observer
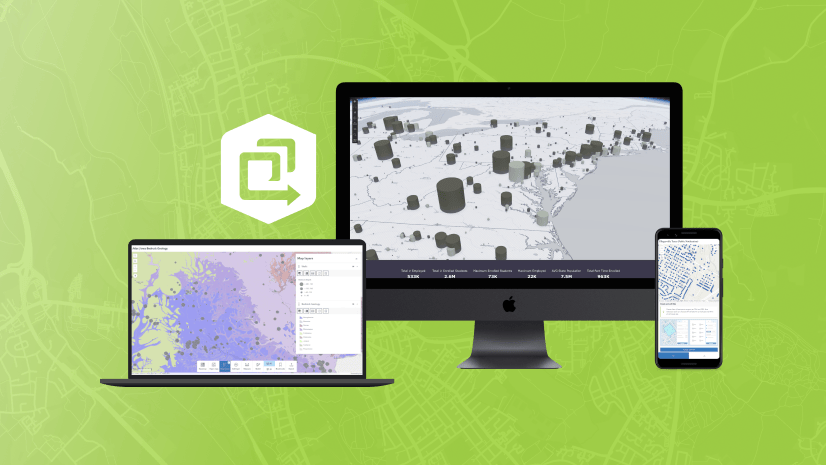
Summarize attribute information from data in a scene using a dynamic scoreboard with Observer. This new scene-based app allows you to include a basic set of scene exploration tools to help inspect locations and identify statistics that could be of interest to users. Set up the Statistics summary in the app configuration on the Observer tab to display statistics about features in the scene. Use operators such as average, count, sum, maximum value, and minimum value on feature attributes that will update dynamically as the extent of the scene in the app changes. For example, set up summary statistics to show key metrics about local trails such as the maximum gain and high point. Pan and zoom the scene to see these statistical values update for the visible extent of the data.
New with this release is the ability to set up attribute filters and support for time-enabled data. On the Interactivity > Attribute filter tab of the app configuration, set up filters that can be used in the app to further narrow down features that are displayed in the scene. Set up both predefined and user input filters while creating or configuring a new filter.
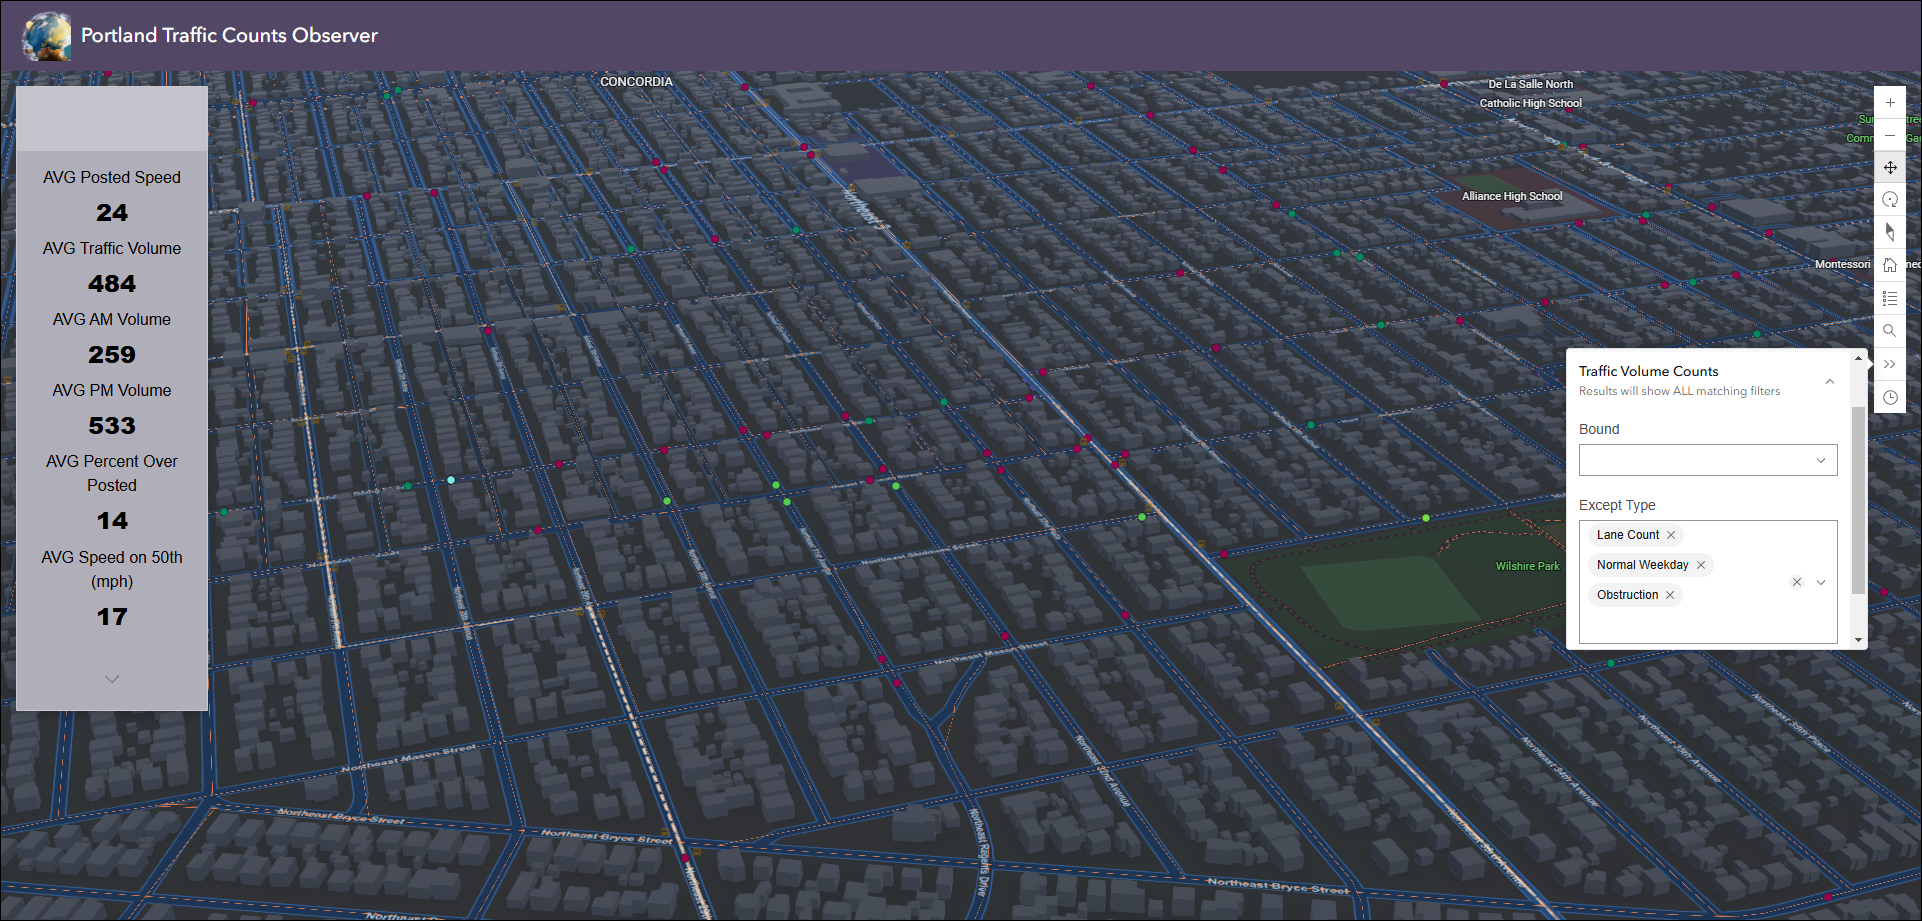
Use the settings on the Interactivity > Time tab of the configuration to set up how the app will display and support any time-enabled layers you have. This setting adds a time slider to the app with basic controls.
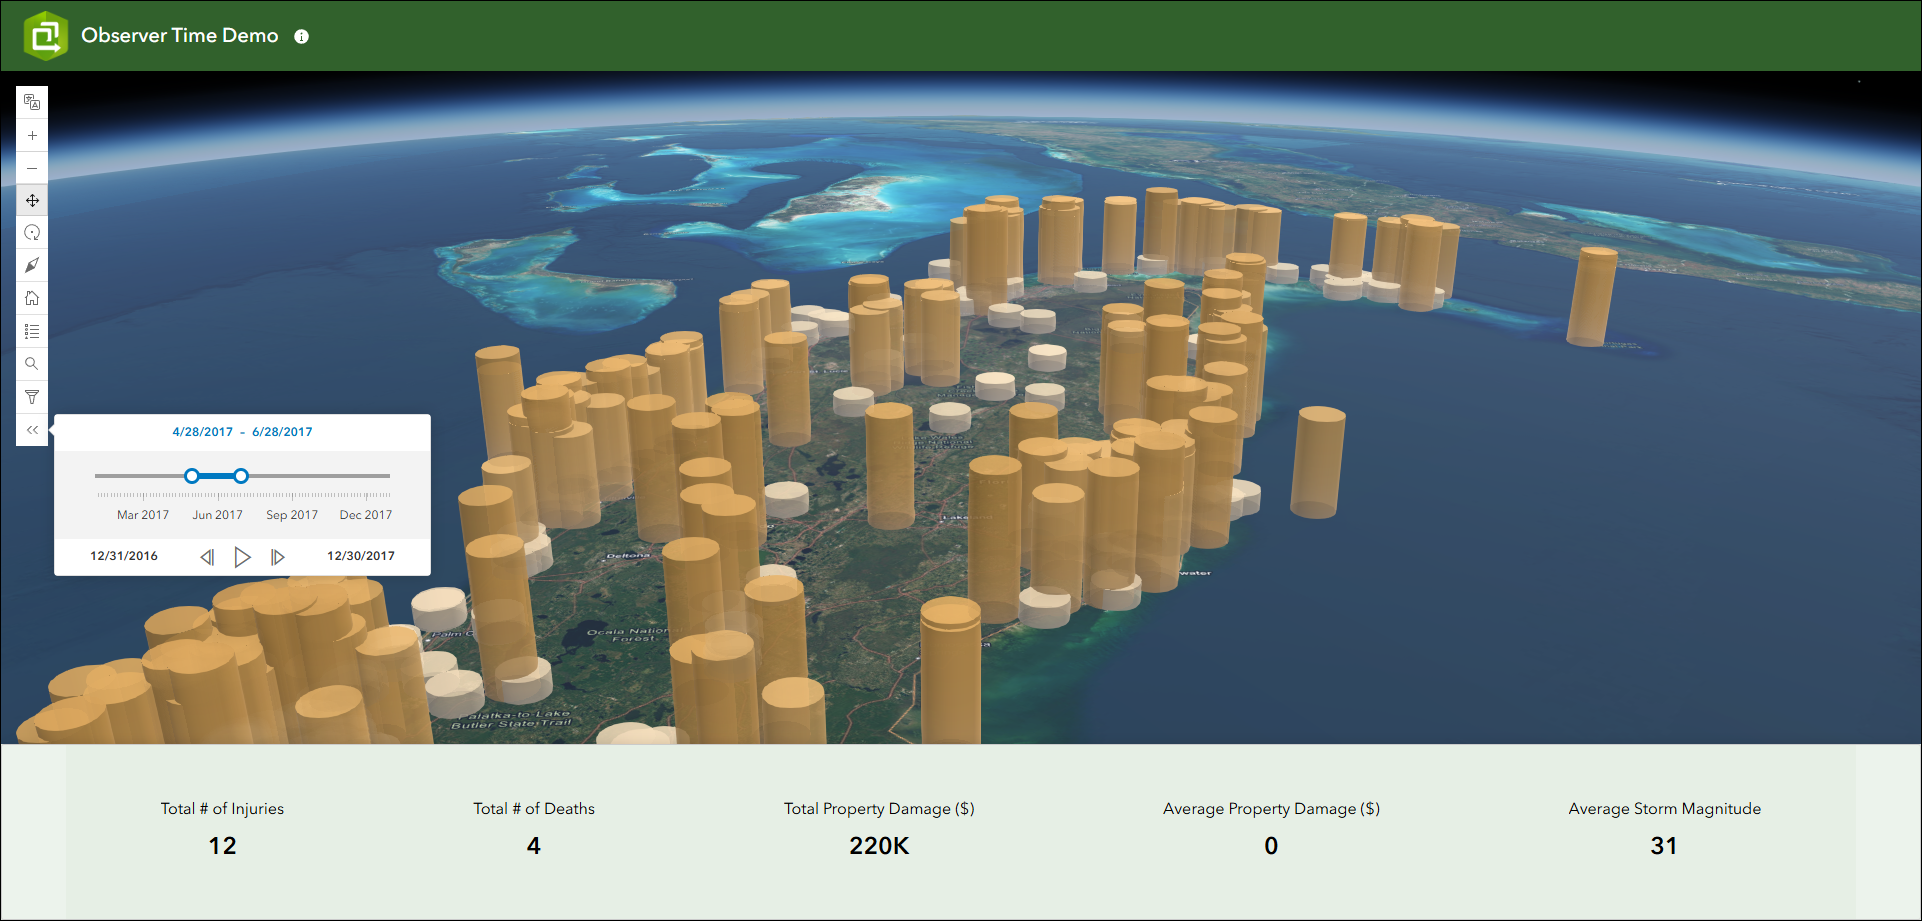
For more details, check out our ArcGIS Instant Apps: Introducing Observer blog.
New app: Streamflow Viewer
Interact with streamflow forecast data through a chart and time slider using the new Streamflow Viewer template. This app includes two different 10-day river forecast services, the GEOGLOWS Streamflow forecast service for global coverage from the European Centre for Medium-range Weather Forecasting (ECMWF), and the United States National Water Model service for US coverage from the National Weather Service.
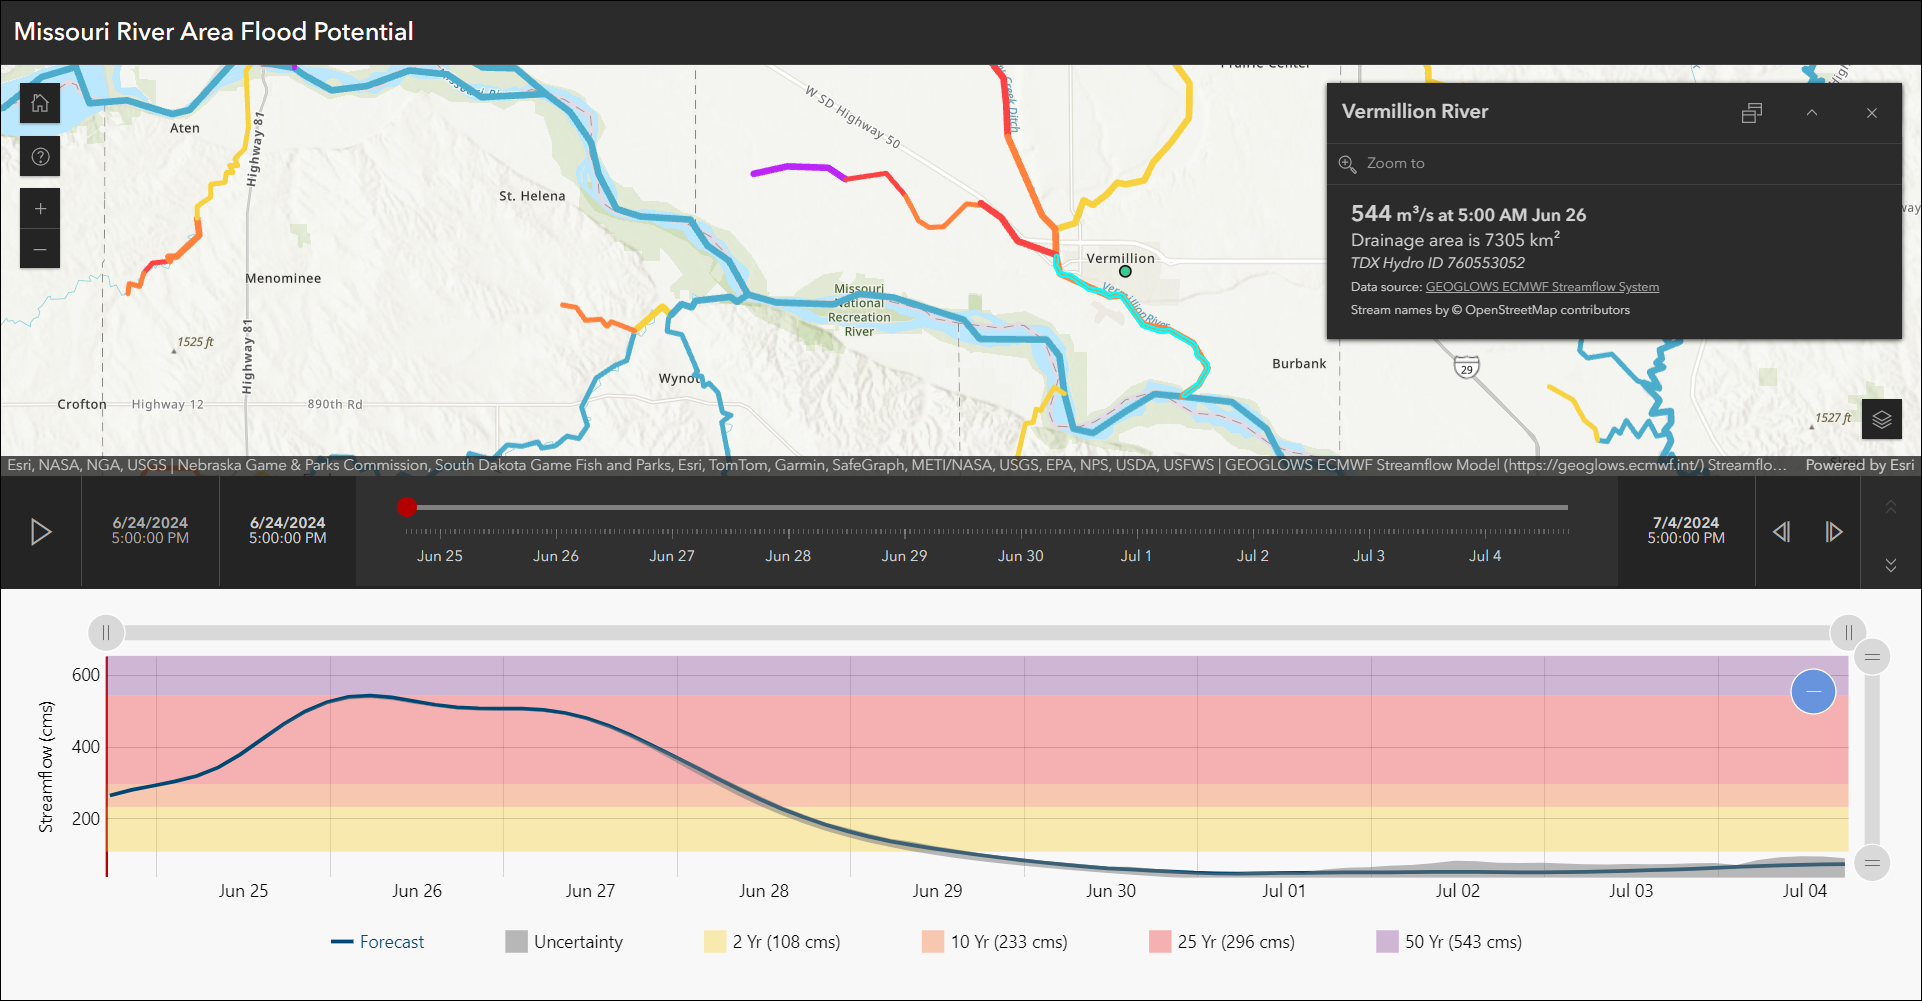
App creators can generate apps that help alert users about potential flood risks with a chart to compare historical data to currently forecasted streamflow data. Both models are updated once daily and are automatically added to your app when you choose a map or scene in the app configuration. The chart and time slider are both interactive and can be used to further explore the streamflow data in your area.
For all details with creating and configuring an app using Streamflow Viewer, check out our ArcGIS Instant Apps: Introducing Streamflow Viewer blog.
Language switcher updates
The Language switcher setting in the app configuration let’s you publish a multilingual app that combines your translated custom text and the UI translations for supported languages. Use the options available on the Language Switcher tab in the configuration to choose which additional languages you want to include, which specific texts will be translated and what those translations are, and what icon will be used in the published app for app viewers. Take advantage of machine translation to automatically translate your text with a few clicks.
Machine translations using the Translation assistant (Beta) now have partial support for languages previously unsupported. Fully supported languages will include translations of app-authored text and Esri UI text. Partial support languages only support translations of app-authored text. When selecting languages to add in the app configuration, the drop-down of choices is split into two sections showing Full support and Partial support. Chosen Partial support languages display in a lighter blue color to help identify them.
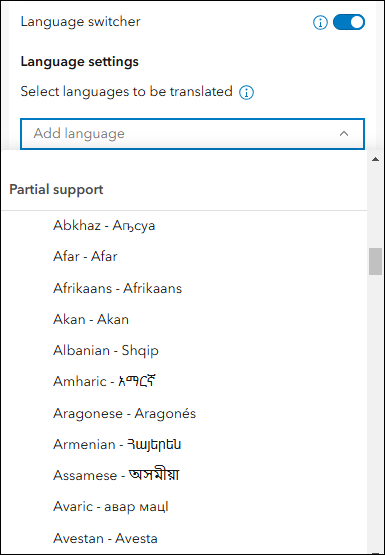
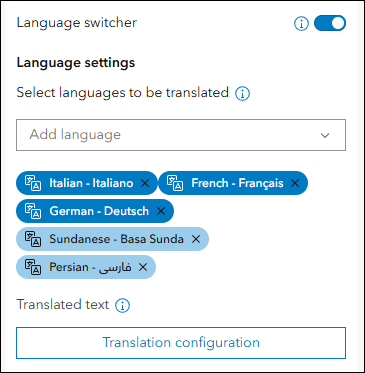
Note that some Partial support languages are unsupported in the Translation assistant (Beta). For more details on this, please check out the documentation page.
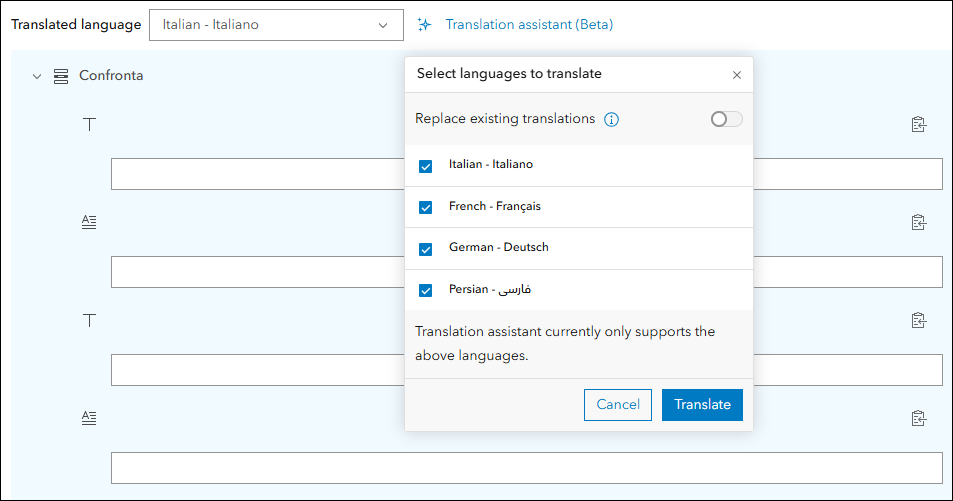
The Language switcher has been added to more apps this release including Compare, Countdown, Exhibit, Insets, Observer, and Reporter. Find this setting in Express mode or full setup of the app configuration on the Language Switcher tab. For a list of all apps that support Language Switcher, please refer to our detailed Language Switcher blog.
Note that the Translation assistant (Beta) feature will not be usable in app configurations if your organization has opted to block Esri apps and capabilities that are in beta. This is a setting that is controlled by the organization administrator. For more information on this, scroll to the very bottom section “Blocked Esri apps” on this documentation page.

Visit the Instant Apps: Create multilingual apps with the new language switcher component blog for all details and a much deeper dive into configuring and using the Language switcher.
Manager updates
Review and edit data from multiple maps and layers using the Manager app template. For example, review problems and feedback with new public transit stations that were collected using crowdsourcing. Use the app configuration to choose each map used in the project that you want included for review. A browser in the configuration lets you search and find any map you have access to so that there’s no need to rely on having everything contained inside a single group.
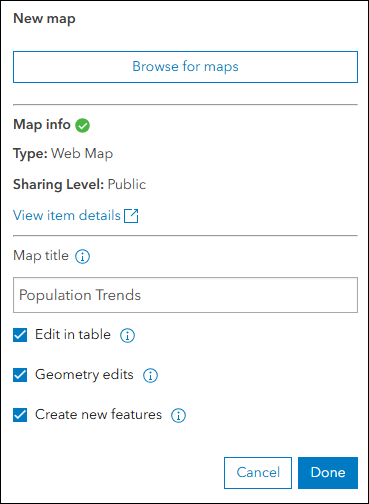
We have two new updates to announce with Manager. First, support for creating new features has been added. App viewers now have the ability to create brand new features in the map, edit existing features (both geometry and attributes), and edit attributes directly in the table. To enable these features in your app, enter the edit menu for a map on the Manager tab of the app configuration. At the bottom, enable the “Create new features”, “Geometry edits”, and “Edit in table” options.
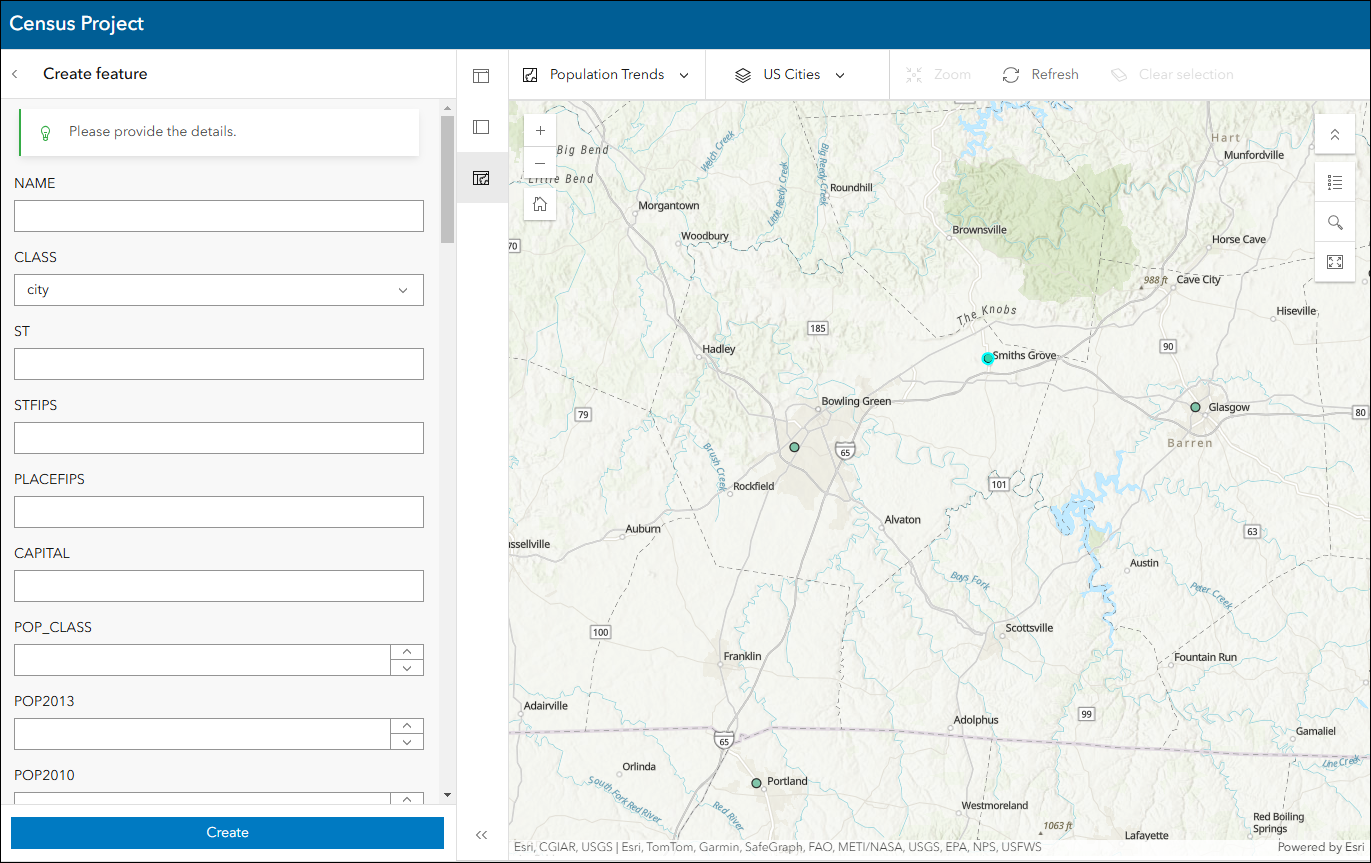
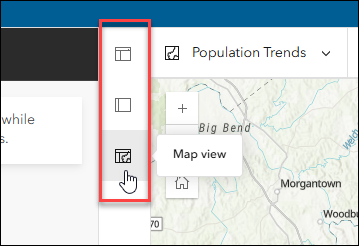
The second update is the ability to choose from a list of new layouts. Choose to show just the map, just the table, or a split view of them both. To make this choice when configuring your app, find the App layout setting on the Theme & Layout > Layout tab. The choices include “Split view”, “Map view”, and “Table view”. They are also presented as options in the app for the app viewer.
3D Viewer updates
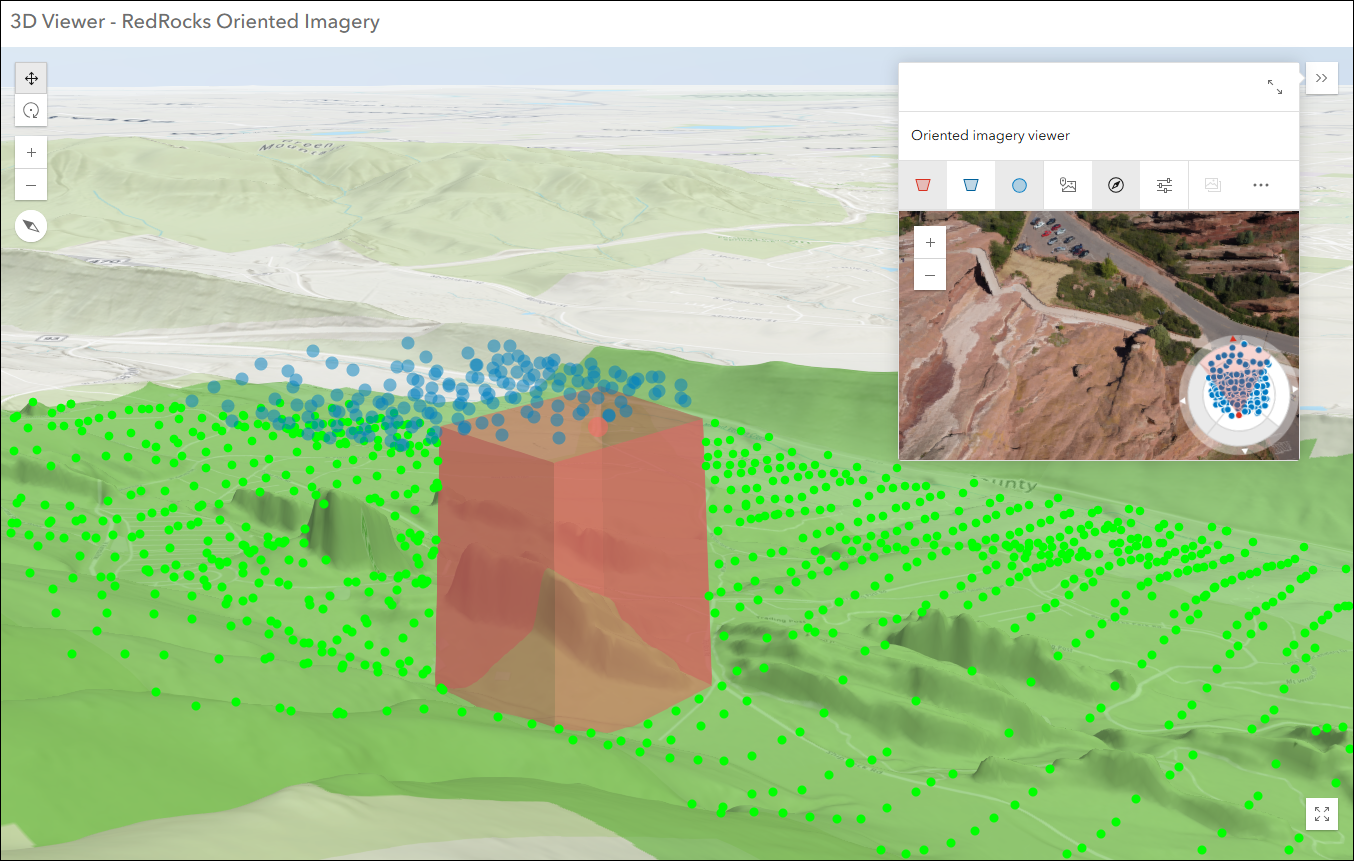
Present a 3D scene with a variety of exploration tools using 3D Viewer. We have added the Oriented Imagery Viewer as a new option that can be added to your app. This tool lets app viewers visualize and explore imagery taken from different perspectives (including street-level images, images from mobile devices, and 360 images) in the context of a web scene. This tool requires an oriented imagery layer, which can be published from ArcGIS Pro or using ArcGIS QuickCapture. To enable this in your app, find the “Oriented imagery” setting on the Interactivity > Explore/navigate tab of the app configuration.
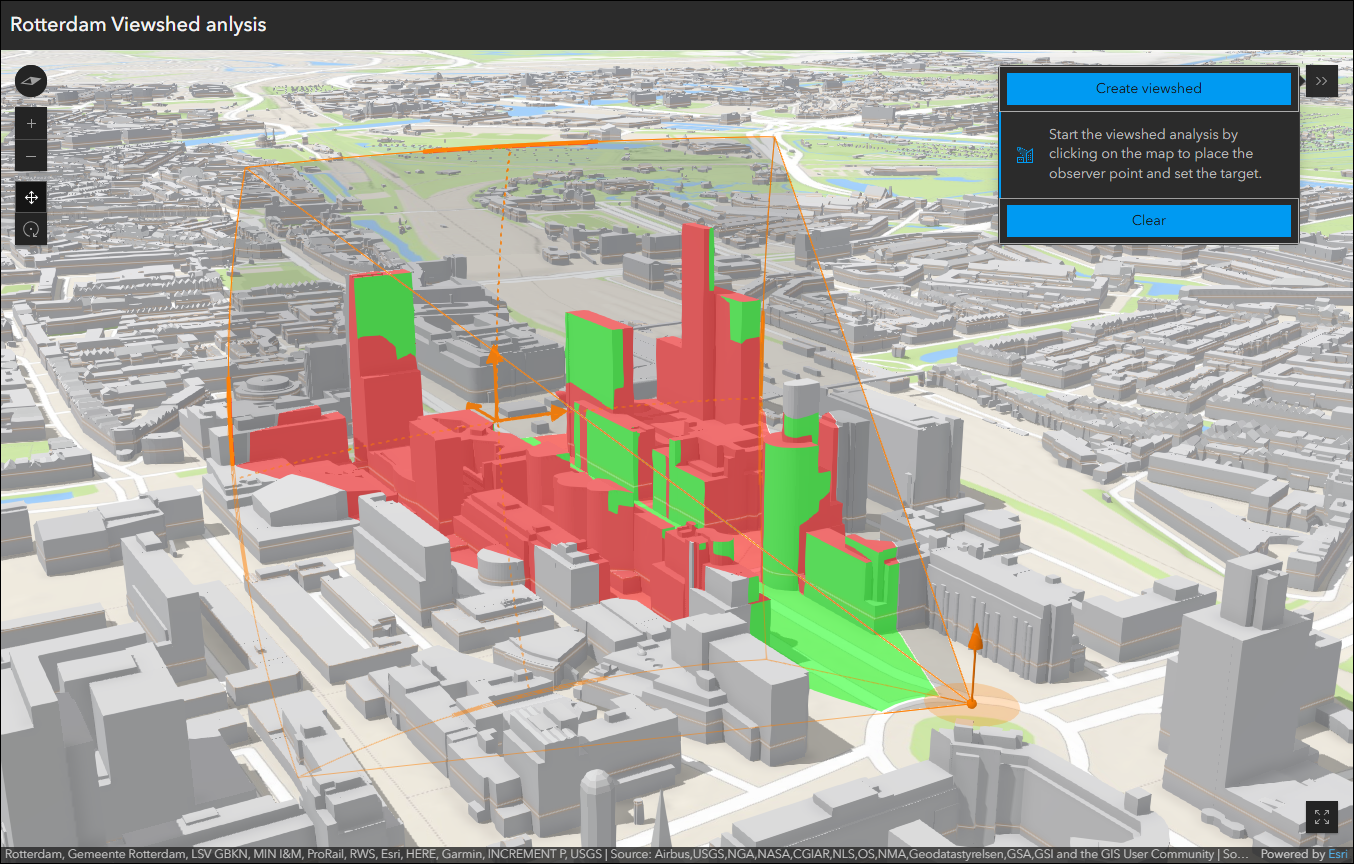
Also new is the Viewshed analysis tool. Use this tool to evaluate visible areas from an observer point in the scene. For example, analyze visible areas from a real estate property or visibility of important landmarks around a city. To add this tool to your app, enable the “Viewshed analysis” setting on the Interactivity > Modify tab of the app configuration. To use the tool in the app, open it then click “Create viewshed”. Click somewhere in the scene to place the observer point and then click to place the target. All field of view angles can be adjusted as needed. Try it yourself now using this live JavaScript API sample before adding it to your own 3D Viewer app.
Atlas updates
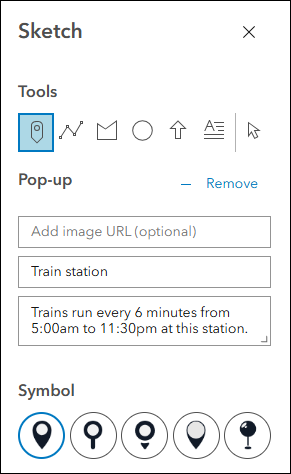
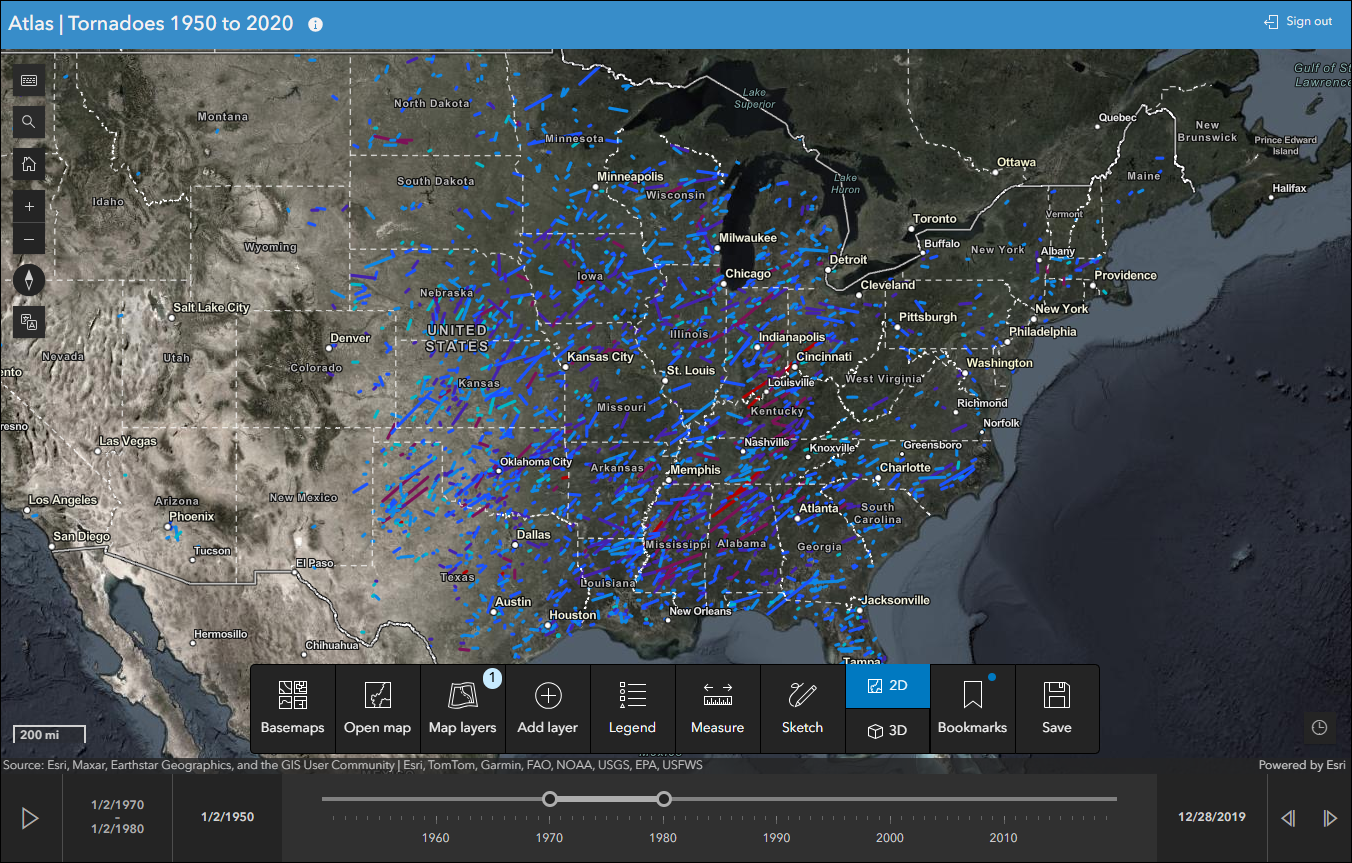
Atlas provides viewers with tools to explore maps and layers with light weight mapping and data exploration capabilities. Viewers can open a map and add individual layers to it. They can utilize measurement tools, generate an elevation profile, toggle the view between 2D and 3D, use a swipe tool and adjust transparency on layers, and view data as a table. When using the sketch tool to add sketches to the map, viewers can now create and include pop-ups with general information about that sketch. On the Sketch tool panel in the app, use the +Add button under the Pop-up section to supply information such as Title and Description, as well as an image URL.
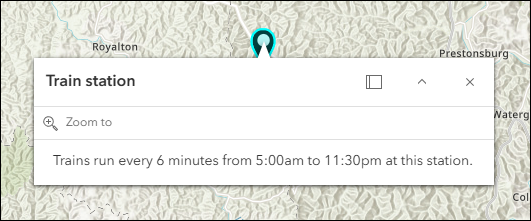
Atlas also now supports time-aware data. When viewing a map that includes time-aware data, the time slider will appear across the bottom of the app letting you play through the data or manually click and drag to see specific views of the data in time. There is no configuration needed in order to take advantage of this new feature, the app will display the time slider as long as time-aware data is present in the map.
To learn more about what you can do with Atlas, check out our Introducing Atlas blog.
Media Map updates
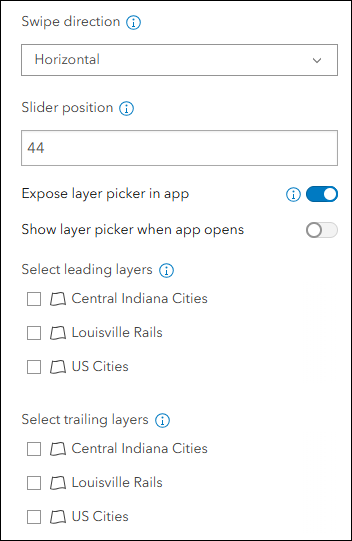
Media Map allows you to display an interactive map with basic tools and a set of options for limiting map navigation. It is designed to fit into small spaces on a web page or as a standalone app. Utilize the Swipe tool to compare different layers over the same area directly in the app. Now included is the ability to select which layers from your map are used in the swipe tool. In the app configuration, find these new settings on the Interactivity > Swipe tab. Use the checkboxes next to each layer to determine which ones are included in the leading view of the swipe, and which are included in the trailing view.
Zone Lookup updates
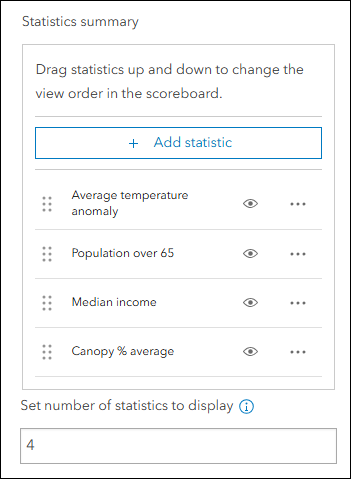
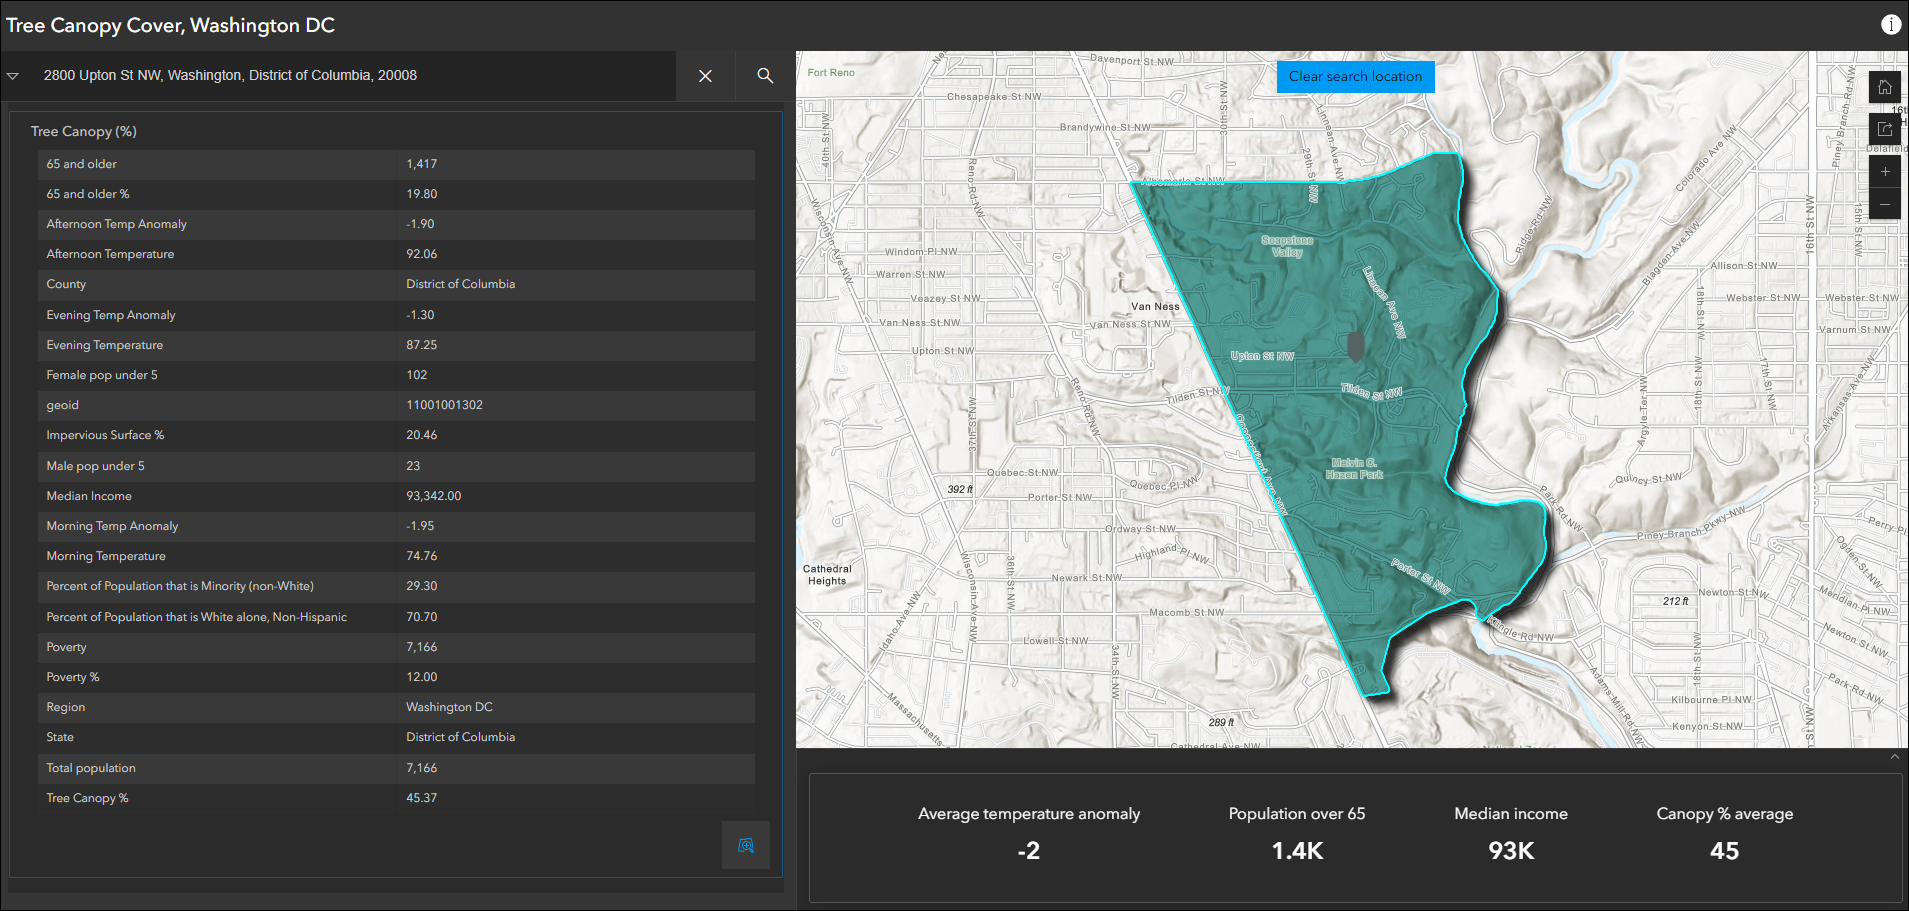
Discover locations within a zone or region to provide information using Zone Lookup. This app is great for identifying school districts, store regions, emergency evacuation zones, and more based on current location or a location provided by the app user. New with this update is the ability to generate statistics based on search results in the map using simple statistics such as count, sum, average, and min/max values. For example, say you want to find all of the train stations in a given search area and then determine the total number of riders per day for all of those stations, you can use the new statistics options in Zone Lookup. To set up statistics, find the Zone Lookup > Statistics tab in the app configuration. Configure your statistics as you’d like and choose to show up to 6 at once in the app.
Export tool updates
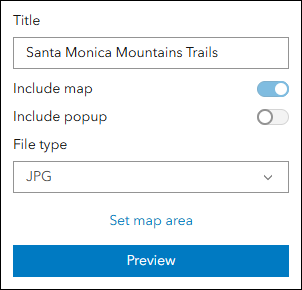
Including an Export tool in your app is a great way to allow app viewers to capture and share what they see. We’ve expanded the file type choices to now include PDF, JPG, and PNG. When exporting your map, the tool includes a drop-down to choose the desired file type. If your app uses a custom image for the app logo, this will also be included in the export. The Export tool can be added to most apps by enabling it in the app configuration on the Interactivity > Share tab.
Public Notification updates
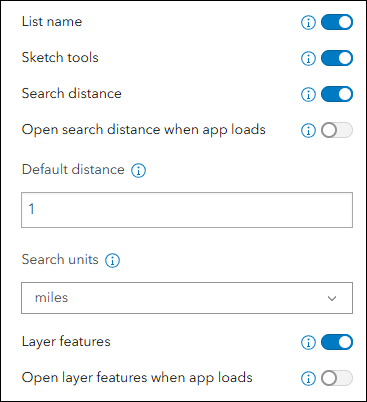
Create a list of features using a map that can be exported to CSV or PDF using Public Notification. Search for a single location or draw an area of interest using sketch tools to define a set of features. You can also use the geometry of an existing feature or apply a search buffer to expand the resulting features used to create the list. When configuring a list, take advantage of the newly added list tools found in the app configuration on the Public Notification > List tools tab. Customize the list by turning on or off things such as the list name, sketch tools, and search distance.
Instant Apps home page updates
The Instant Apps home page offers a centralized place to browse, choose, create, and manage ArcGIS Instant Apps. We’ve added more information to the Learn more panel that provides helpful tips and tricks about creating and managing Instant Apps. Find the new Getting started tab within the Learn more panel to access the new information. Find out how to utilize Suggestions for app selection, pick a map to help elevate compatible templates, and save copies of useful apps you find owned by members of your organization.
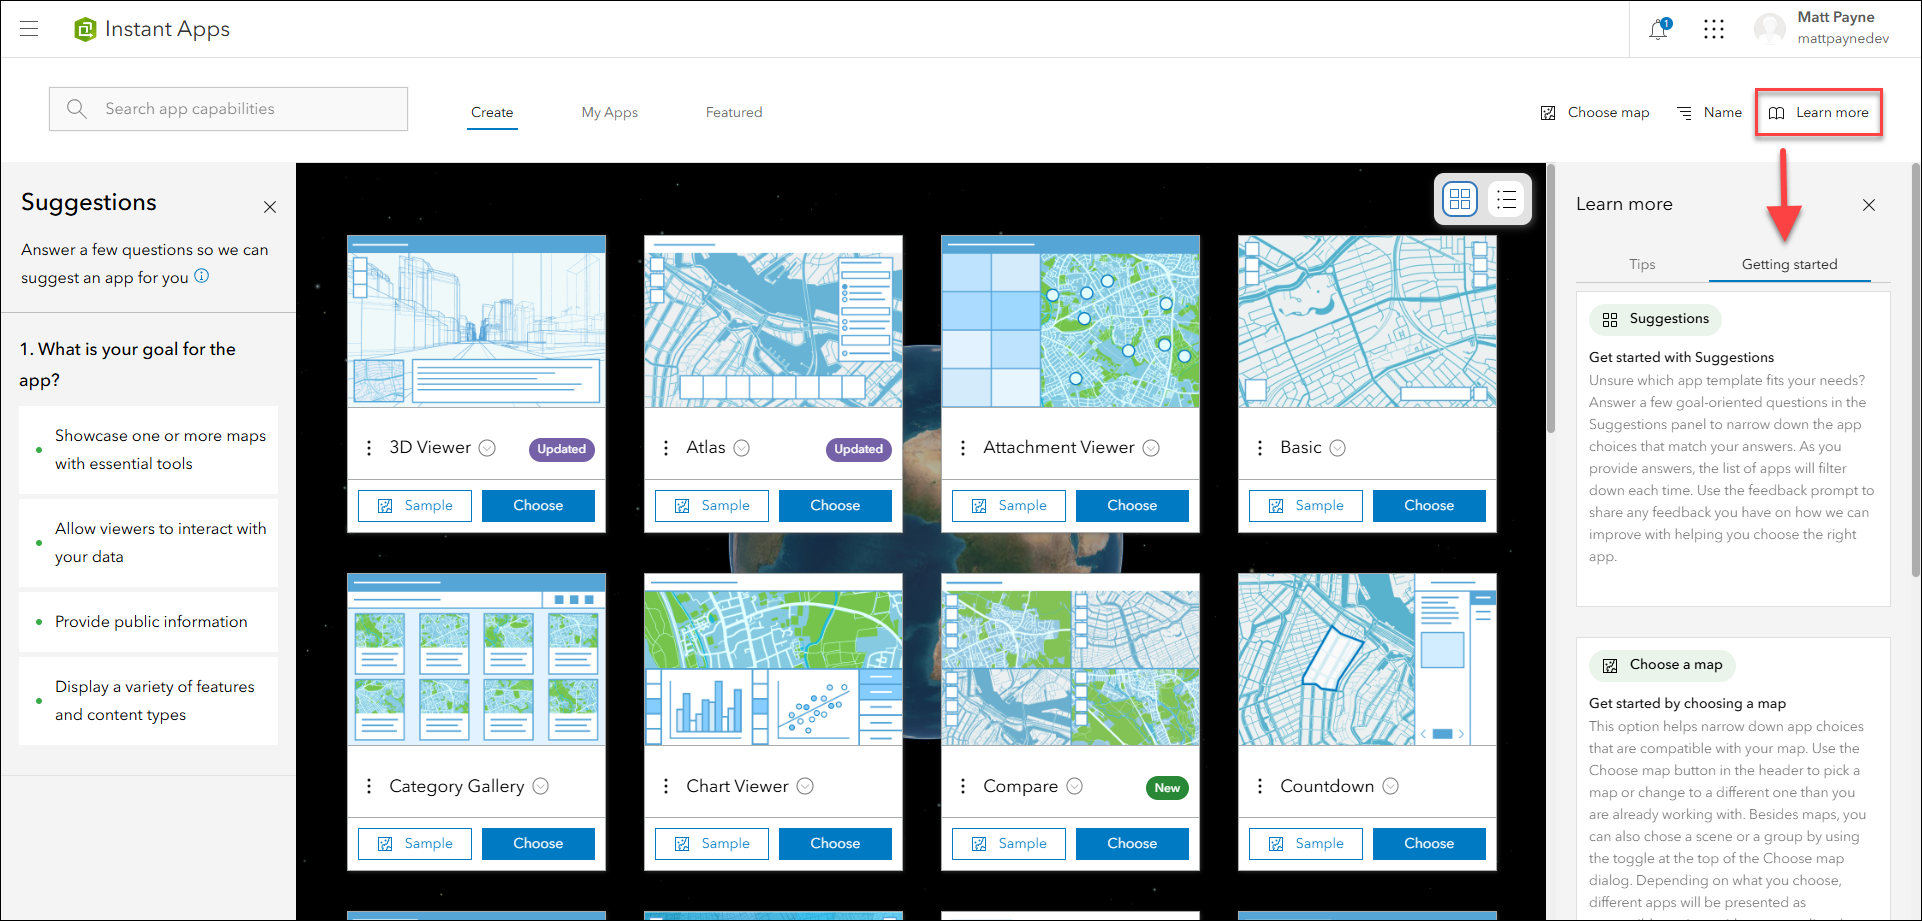
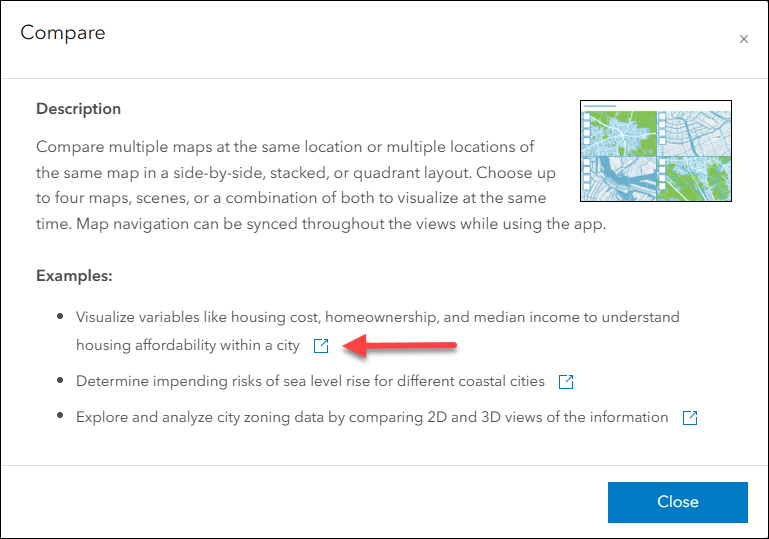
We have added more live example apps to the templates on the Create tab. You can now see live sample apps for every example listed. Check these out to see how a finished product for a given app template can look. In Gallery view, click the down arrow icon next to any template name to view its app description and see the examples. In Details view, the app description and examples are already shown by default in this view and the new live app hyperlinks for each template are as well. The toggle switch for Gallery and Details views can be found in the top right corner above the template choices.
Deprecation Notice for ArcGIS Configurable Apps
As of the June 2023 update of ArcGIS Online, a deprecation notice has been issued for ArcGIS Configurable Apps. Deprecation does not impact the availability, functionality, and Product Lifecycle Support phase of ArcGIS Configurable Apps.
ArcGIS Configurable Apps continues to be available until it is officially retired, but will not receive new features or other enhancements. Before retirement, users are still able to create apps using ArcGIS Configurable Apps templates and existing apps will continue to work.
Retirement of Configurable Apps is expected to happen towards the end of 2025. Please take a look at our detailed announcement blog: ArcGIS Configurable Apps Roadmap for Retirement.
More information
For more information please reference our documentation page where you can find details about getting started with creating and sharing ArcGIS Instant Apps.


In instant apps (i.e. Zone Look-up or Public Notification) are there any future plans to have the Export as CSV tool recognize custom attribute expressions in the pop-ups? For instance it seems that Zone-Lookup is not linked to the pop-up and includes all original attribute fields even if I had it hidden. The Public Notification App at least does not include hidden fields but it won’t export any user made attribute expressions. Wondering if it is possible in future updates to link the export tools to our attribute expressions? Thanks!