ArcGIS Online enables you to connect people, locations, and data using interactive maps. Using ArcGIS Online you can work with smart, data-driven styles and intuitive analysis tools that deliver location intelligence.
You can use ArcGIS Online as a standalone solution for your mapping and analysis needs. Or, because it’s an integral part of the ArcGIS system, you can use ArcGIS Online to extend the capabilities of ArcGIS Desktop, ArcGIS Enterprise, or build custom apps using ArcGIS Web APIs and SDKs. ArcGIS Online also provides access to the ArcGIS Living Atlas of the World, a vast collection of curated, authoritative, ready-to-use content from Esri and the global GIS user community.
Don’t have an ArcGIS account? See Create an ArcGIS Account.
October 2019 release
ArcGIS Online is updated regularly, and this latest release adds many useful new features and enhancements. This update introduces new and improved configurable apps, new and updated Living Atlas content, and lots more. For additional details see the What’s new help topic or view all posts related to this release.
Configurable apps
Configurable apps are template applications that you can configure easily, without any coding. They help you publish apps quickly and can be used to support a variety of users and workflows. Configurable apps are the fastest and easiest way to go from a map to a shareable app. New for this release:
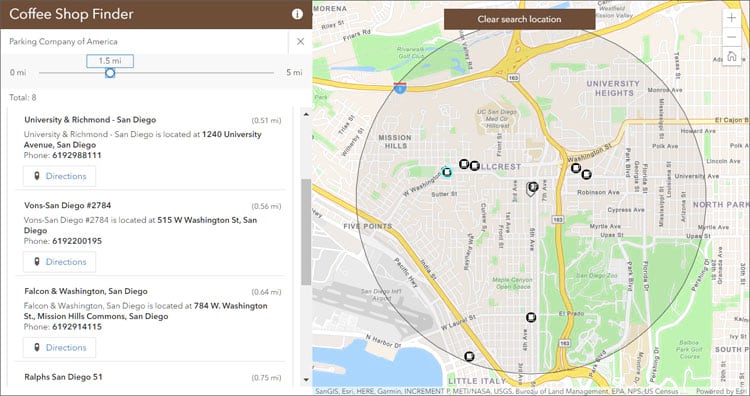
Nearby is a new configurable app that allows users to enter an address and search radius to find nearby locations. After selecting a location, the app can provide directions to it. By grouping the results by layer, app authors can configure the app to answer detailed questions. For example, a user could search for nearby schools and see them grouped by the school type, including middle schools, elementary schools, and universities. Nearby apps can also be configured to answer questions such as, Where is the nearest coffee shop?
Attachment Viewer has a new map layout option in addition to the existing photo layout. In the map layout, users will see a gallery of attachments based on the features within the map extent. Additional enhancements include multiple layer support, support PDFs as an attachment type, and hide features that do not have attachments.
Media Map provides a crisp and simple way to share maps. It has been updated to include an interactive time slider that animates data as it appears over time. This allows you to showcase data that is time enabled, for example weather patterns or demographic trends. Media also adds a swipe widget, for showing “before and after” type maps.
Category Gallery now includes a sign in button, a choice of which item details to show on gallery cards, and the ability to configure the filter pane to open by default.
For more information see What’s New in Configurable Apps (October 2019).
Data management
Vector tile layers
Update hosted vector tile layers in place using the new Replace Layer option. Replace Layer updates the tiles in the target hosted vector tile layer by replacing the entire tile cache with the layer selected as a replacement. As a result, existing apps and styles that reference the hosted vector tile layer continue to work without needing to be updated. For more information see Replace a hosted vector tile layer.
Arcade
Arcade is an expression language that can be used across the ArcGIS Platform. Whether writing simple scripts to control how features are rendered, or expressions to control label text, Arcade provides a simple scripting syntax to deliver these capabilities. Four new Arcade functions are now available in ArcGIS Online.
Use GroupBy to group features in a feature set by a field, and return statistics for each group.
DistanceGeodetic can be used to calculate the shortest distance between two points along a great circle.
FeatureSetByRelationship makes it easier to access features from layers that have relationships.
FeatureSetByPortalItem allows you to build pop-ups rich with data from any layer in ArcGIS Online and ArcGIS Living Atlas of the World without adding the layer to the map, using the layer’s Item ID to access the data without visualizing it.
Mapping and visualization
This release introduces the following new features and capabilities available in Map Viewer and Scene Viewer.
Map Viewer
Map Viewer is the built-in way for you to create and interact with online maps. Add layers, import features, and use Living Atlas content to make smart maps that inform and deliver information. Map Viewer also includes editing capabilities and analysis tools that extend what you can see.
New symbols
Map Viewer now includes updated symbols in the Public Safety symbol set.

Map Viewer Beta
A new version of Map Viewer is in development. The next generation Map Viewer will be available in beta soon after the ArcGIS Online October update. Because Map Viewer is the primary way you create and interact with your maps, the ArcGIS Online team is announcing the upcoming beta and encouraging you to take the opportunity to test and provide feedback about the design and functionality.
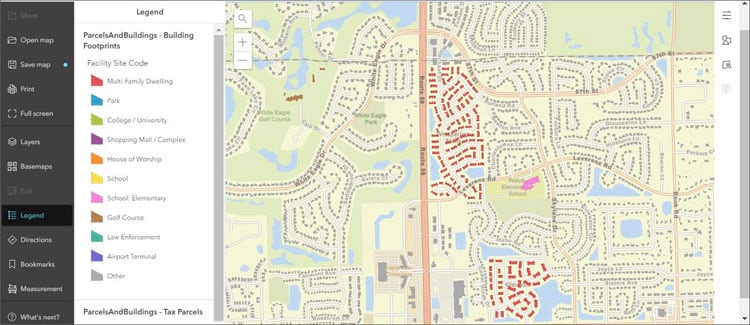
For more information see Map Viewer Beta: Coming Soon.
Scene Viewer
Scene Viewer lets you author, view, and share 3D scenes. With this release, Scene Viewer includes the following enhancements and new capabilities.
You can now define the visibility range of layers in a scene using the new scale range slider in the layer properties. Create a scene that alternates between layers showing countries, cities, and buildings while zooming in, for example.
You can now display pop-ups on point cloud scene layers. Individual points can be selected to inspect properties, such as the classification or elevation.
A new lighting and shading model adds contrast and more definition to your 3D content, when you choose Quality in the Settings tool. Additionally, Scene Viewer has improved transparency rendering for buildings and adjacent extruded polygons.
Scene Viewer performance has been enhanced, for example 3D scene layers now load twice as fast, and vector tile layers have increased rendering performance when navigating scenes.
Spatial analysis
Spatial analysis tools allow you to quantify patterns and relationships in the data and display the results as maps, tables, and charts. The spatial analysis tools empower you to answer questions and make important decisions using more than a visual analysis.
To learn more about accessing and running the tools, see Use the analysis tools. The analysis tools are arranged in categories for easy discovery and access.
Create Drive-Time Areas
Create Drive-Time Areas creates areas that can be reached within a specified drive time, drive distance, walking distance, and more. It measures out from one or many points (up to 1,000), along roads or walkways.

Create Drive-Time Areas has been updated with three new parameters to improve the tool’s capabilities, and enable you to do more with drive-time area analysis.
Travel Direction allows you to choose whether the drive-time areas are created away from your input locations or toward them.
Show unreachable areas as holes returns a detailed polygon where areas within the output that are not reachable through the road network are not included in the output polygon.
Include reachable streets creates an output layer that includes the streets used to create the drive-time areas.
Connect Origins to Destinations
Connect Origins to Destinations measures the travel time or distance between pairs of points. The tool can report straight-line distances; distances based on a travel mode, such as walking or driving; or trip durations based on a travel mode.

With this release, Connect Origins to Destinations includes a new parameter and enhanced abilities to create multiple connections.
Route shape can be used when a travel mode is chosen as the measure between origins and destinations.
Follow streets creates a shape based on the underlying street network and is best when you want to generate the routes between origins and destinations.
Straight line creates a straight line connecting the origin-destination pair and is best when you want to generate spider diagrams or desire lines (for example, to show which stores customers are visiting).
In addition, you can now connect more than one origin to multiple destinations. For example, if you have three stores and 50 customers from each store, you can now connect all stores with all of their customers.
Enrich Layer
Enrich Layer delivers demographic and landscape data for the people, places, and businesses associated with your point, line, or area data locations. It uses the ArcGIS GeoEnrichment Service.

Enrich Layer has been enhanced to allow users to select variables from different datasets, or all available datasets for specific countries. Data availability will depend on the location of your features. When multiple datasets are available for the selected country, extra drop-down options are available in the Data Browser.
Living Atlas
ArcGIS Living Atlas of the World is the foremost collection of geographic information from around the globe. It includes curated maps, apps, and data layers from Esri and the global GIS user community that support your work. Visit the ArcGIS Living Atlas of the World website where you can browse content, view the blog, and learn how you can contribute. Here’s what’s been recently released, new at this release, or coming soon.
Living Atlas apps
Living Atlas includes a collection of featured apps that enable you to unlock Living Atlas content to use it more effectively and gain understanding. Highlighted apps can be found by going to the Apps tab at the Living Atlas website. Two new apps have been added.
Sea Ice Aware
Areas of the ocean that have frozen are considered “sea ice,” and can vary from slushy, barely solid areas to sheets of ice that are meters thick. Since the late 1970s, satellites have been used to monitor both the extent and concentration of sea ice around the world, and the National Snow and Ice Data Center (NSIDC) generates a sea ice extent analyses from this data.
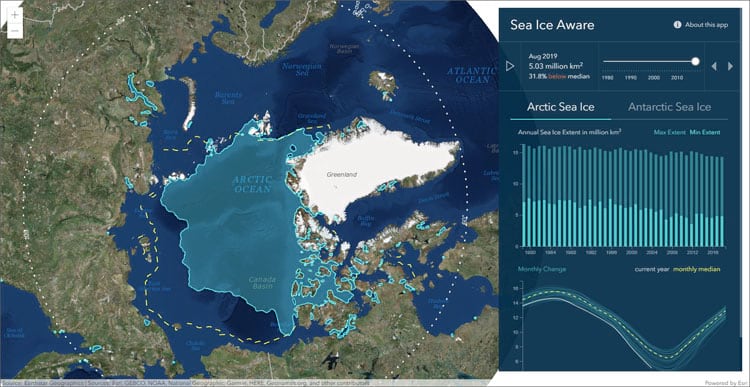
Sea Ice Aware displays the monthly mean sea ice extent for the Arctic and Antarctic along with the historical median extent. Additionally, graphs are used to visualize the minimum and maximum extent for each year (top), and the monthly time series for each year (bottom). Use the top graph to select specific years to display in the map.
Hurricane Aware
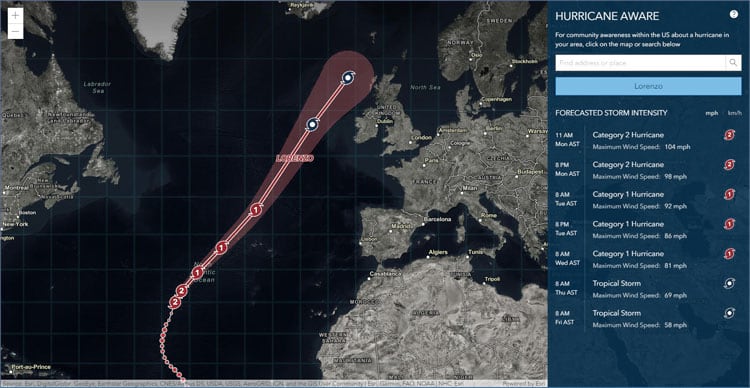
Hurricane Aware is intended to provide information about the potential impacts of tropical storms in the United States. The data shown here from the Living Atlas are authoritative U.S. government sources, including National Weather Service forecasts for hurricanes, precipitation, and wind gusts, and derived American Community Survey demographic data from the U.S. Census.
New and updated content
Living Atlas content is continually updated. The following are recent additions or enhanced content.
USA NLCD impervious surface time series represents urban impervious surfaces as a percentage of developed surface over every 30-meter pixel in the United States. The layer is organized into a time series from 2001 to 2016, for the lower 48 conterminous US states. For more information view the item details.
Critical habitat layers have been updated with recent data. View a list of habitat layers.
World Database on Protected Areas (WDPA) layers have recently been added. This content represents the most comprehensive global database on terrestrial and marine protected areas. View the list.
USA Federal Lands layers have been updated with more recent information. The updated layers include:
- USA Federal Lands
- USA Fish and Wildlife Service Lands
- USA Forest Service Lands
- USA National Park Service Lands
- USA Bureau of Land Management Lands
Arctic Sea Ice Extent and Antarctic Sea Ice Extent were published in mid-June. These services include content from the the National Snow and Ice Data Center (NSIDC) showing sea ice concentration and extent analyses from a variety of microwave satellite data sources.
New USA Protected Area layers have been added, extending the collection of previous layers. The USGS Protected Areas Database of the United States (PAD-US) is the official inventory of public parks and other protected open space. With more than 9 billion acres in more than 350,000 holdings, the spatial data in PAD-US represents public lands held in trust by thousands of national, State and regional/local governments, as well as non-profit conservation organizations.
The Oceans Hybrid Coordinate Ocean Model (HYCOM) layers are now out of beta. View a list of HYCOM layers.
Demographic maps for Canada, Germany, Japan, Netherlands, and South Africa have been updated. For more information, see What’s new in Esri Demographics.
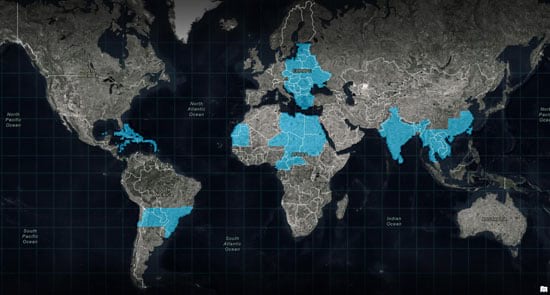
The World Imagery basemap has been updated with the latest Maxar EarthWatch Vivid imagery covering all of India and the Caribbean, as well as parts of Europe, Africa, Southeast Asia, and South America.
Community Maps updates
The Community Maps Program works with authoritative GIS data contributions to build the ArcGIS Living Atlas of the World basemaps, including Imagery, Streets, Topographic, and Ocean maps.

Over 140 organizations worldwide have recently contributed their content to update, enhance, and extend world referential basemap layers and imagery. In addition, new workflows make sharing your content easier than ever.
Learn more about the community and what you can share, and how you can share it at the Community Maps website.
World geocoding service
The World Geocoding service now includes point address data from BuildingFootprintsUSA. This improves the service with new locations, and increased rooftop matches across the US.
Living Atlas Learn ArcGIS path
Learn ArcGIS is a website containing timely and engaging guided lessons that are based on real-world problems, covering the entire ArcGIS platform. A new Learn ArcGIS path focused on the Living Atlas is now available. View the hands on lessons that will help you gain more from the Living Atlas.
ArcGIS Companion
ArcGIS Companion makes it easy to use ArcGIS from your mobile device. In addition to the mobile browser option (just use your URL), you can now connect to ArcGIS using this companion mobile app for iOS and Android. Access ArcGIS anytime, anywhere, to explore content, view groups, edit your profile, and more.
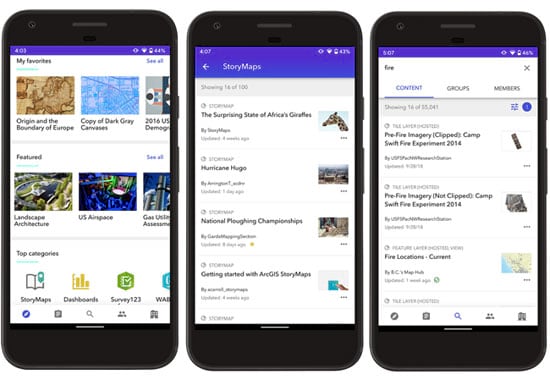
ArcGIS Companion has added more features and enhancements since the previous ArcGIS Online update. Highlights include access to Living Atlas content and support for public accounts. In addition, group content now includes filters and administrators can now delete members.
For more information, see What’s new in ArcGIS Companion.
ArcGIS Hub
ArcGIS Hub is an easy-to-configure cloud platform that organizes people, data, and tools to accomplish initiatives and goals. With sites, events, configurable apps, and other solutions, ArcGIS Hub enables your team to create and share maps, apps, and initiatives that align collaborators across organizations and communities with the information and content they need to manage projects and drive desired outcomes. For examples, view the ArcGIS Hub Gallery.
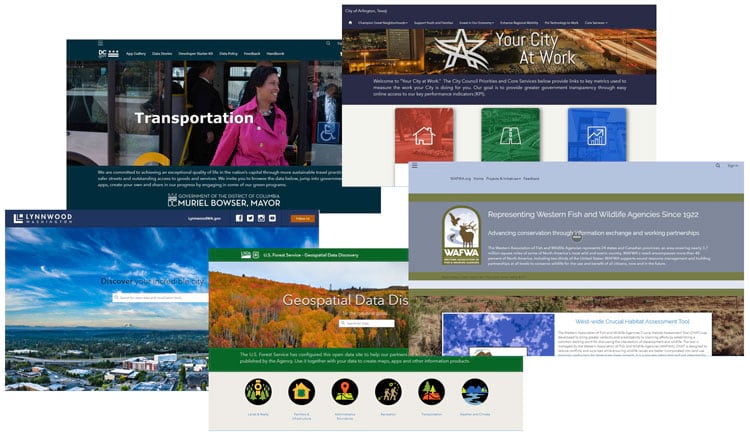
ArcGIS Hub has improved how you build sites and pages, share content, and connect with your community. Recent enhancements include the following:
A new community followers experience that provides easy email messaging to your initiative followers. ArcGIS Hub administrators and initiative core team members can now use the new rich-text editor to send welcome messages, meeting invites, links to surveys, and more, to individual followers or everyone on the list.
A new app card that makes it easy to add Web AppBuilder apps to your sites, without having to iFrame them in.
An upgraded map card that allows you to add both 2D maps or 3D web scenes to your sites and pages. Scenes can provide interactive 3D models for showcasing a variety of scenarios on your hub site, like proposed development, underground utilities, and more. Just open a site, drag-and-drop a map card, then choose the scene you want to add.
Hub Overview now includes new features and styles. Editing metadata from the Hub Overview, is now possible. Just click Content Library and you can see all of the content shared with your organization’s sites. Clicking the Edit Pencil from the dataset page will link you directly to the item in ArcGIS Online, so you can quickly change title, description, and tags.
ArcGIS Hub isn’t just for sharing public data. Now, you can easily create private sites and initiatives for sharing internal content with your team or organization. For example, you can create a data portal for other members of your organization so that they have a single point for accessing authoritative content. Simply share your private items to a group that’s shared with a team or organization, and add it to your site or initiative using these steps. For more information, see Welcome to the Content Library.
For more information see What’s new in ArcGIS Hub.
StoryMaps
ArcGIS StoryMaps continue to evolve with new features to enhance your experience when telling stories with maps.
You can now drag and drop media to re-order content within sections of your story. Move images, videos, maps, embeds, and cards by dragging the handle that appears when hovering over them.
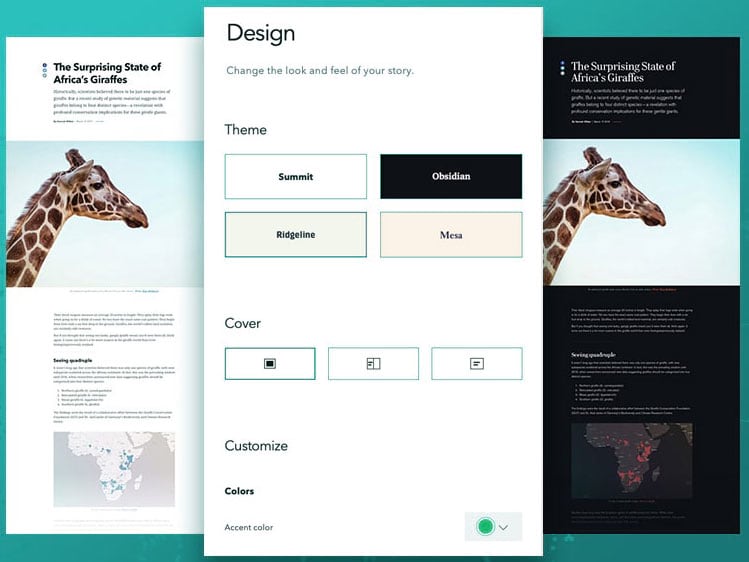
Two new story themes have been added, which include a set of colors, fonts, and express map basemaps so you can quickly change your story. The Ridgeline theme is great for telling stories about the environment. The Mesa theme is inspired by print maps in historic literature.
Collections are still in Beta, but using them you can curate your own page with a group of stories on a topic, or assemble a set of stories by the same author.
For the full list of enhancements from the latest release, see the StoryMaps articles on the ArcGIS Blog.
StoryMapper of the Year
The StoryMapper of the Year contest deadline has been extended to December 15—so you can open the builder, take the new enhancements for a spin, and then submit your story to win $5,000 for a cause of your choice.
App Builders
App builders let you easily create custom apps, no coding required, and you don’t have to be a designer, or even a map expert. App builders have been updated with the following enhancements.
Web AppBuilder
Web AppBuilder for ArcGIS delivers a way for you to easily create web apps that run on any device, using a gallery of ready-to-use-widgets. You can customize the look of your apps with configurable themes and can host your apps online or on your own server. Multiple widgets have been improved for this release.
- With Group Filter, you can now define filter values using a URL parameter.
- The Near Me widget has configurable buffer input options to search with a precise distance.
- You can configure the Public Notification widget to add field names in the CSV download.
- Smart Editor has several enhancements, such as supporting relative dates and the use of a URL parameter to define a preset value.
- The Screening widget allows you to hide the summary table in the report.
In addition, more widgets have been enhanced for accessibility. For more information, see What’s new in Web AppBuilder for ArcGIS.
Apps for field operations
ArcGIS apps for field operations help you use the power of location to improve coordination and achieve operational efficiencies in field workforce activities.
ArcGIS QuickCapture
ArcGIS QuickCapture is the fastest way to collect field observations. With this simple app, you can quickly record field observations from vehicles, conduct aerial surveys, or assess damage. Data can be sent back to the office for analysis in real time, eliminating time spent manually processing handwritten notes. ArcGIS QuickCapture is integrated with ArcGIS, so new data from the field can be used instantly for better decision-making.
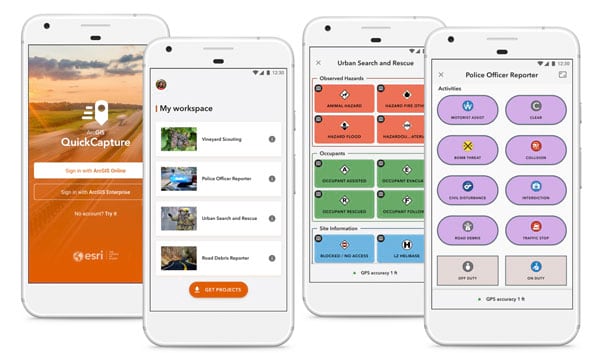
With recent updates, QuickCapture designer has been included in the App Launcher, making it easier to start building your own QuickCapture projects. QuickCapture designer has also been enhanced to make it easier to configure your projects.
The mobile app includes new capabilities to streamline data capture, with configurable offline basemaps, exclusivity groups, better user inputs, point collection in continuous mode, and many other important features.
The latest 1.2 version is now available in the Apple and Google Play app stores. You can also download the Windows version. To learn more, check out new tutorials and posts in the QuickCapture GeoNet Place, or What’s new in QuickCapture.
Survey123 for ArcGIS
Survey123 for ArcGIS is a simple and intuitive form-centric data gathering solution that makes creating, sharing, and analyzing surveys possible in just three easy steps.
Survey123 for ArcGIS 3.6 shipped earlier in September. This latest version introduces support for polygon and line features in both the web and field apps. You can now build surveys on top of existing polygon layers, and leverage smart forms to update their attributes and (if needed) their geometry. Sketching tools and more advanced feature creation tools can be enabled in the Survey123 map to define new features.
Survey123 Feature Report is now an ArcGIS Online Premium service. It consumes 2.5 credits for every survey report you generate. Other new capabilities in this release include support for the new range question, selections through image maps and support for single choice grids. For more details see the 3.6 release announcement.
Navigator for ArcGIS
Navigator for ArcGIS is a professional mobile navigation app for Android and iOS that enables you to provide optimized routes to your field workforce. It comes with hundreds of global maps or add your own custom map. Define travel modes, route on your own roads, and search your assets.
The new release of Navigator for ArcGIS (coming soon) delivers enhanced location intelligence. Users can now share route layers with drivers directly in the Navigator app, delivering time savings and assurance that even when connectivity is not available, access to routes will not be compromised because they are stored on drivers’ local devices.
Multi-stop routes can now be paused without canceling routes entirely. Drivers are now able to fully interact with features on their Navigator maps to see complete attribute information, including media and attachments.
Watch the Navigator GeoNet page for more information about these enhancements and more in the upcoming release.
Apps for the office
ArcGIS Apps for the office enable operations managers and analysts to visualize data in a geographic context to gain location-based insights and make decisions that save money and time. Some apps for the office have been updated. Here are a few highlights.
ArcGIS Insights
ArcGIS Insights is analysis software that fuses location analytics with open data science and business intelligence workflows. Answer questions you didn’t know to ask, analyze data completely, and unlock new insights. Using Insights, you can empower analysts of all skill levels across departments, to directly connect data, perform advanced analytics, and take results into third-party party systems.
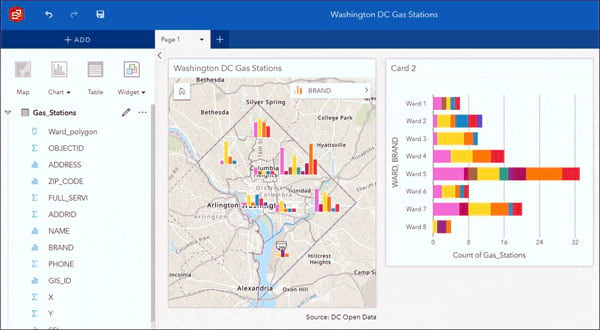
Insights 3.4 is now available, with features valuable for your analytic understanding and sharing of information products. Some of the highlights include new chart types, analysis improvements, and data management enhancements. A complete list with more details is available within the help documentation.
Highlights for this release include:
- Better understand your data using improved stacked bar charts, combo chart and the new, point chart.
- Using regression analysis, quickly understand how a model performs and if it’s trustworthy by looking at new statistical outputs such as F statistic, t-value, p-values, and confidence intervals.
- Easily save data from different sources in your workbook to avoid the limitations of remote datasets.
- Add an existing script to your Workbook and, ‘Run’, ‘Open’, ‘Share’, ‘Download’ or ‘Remove’ scripts directly from within Insights.
- Did you know? Scripting is now out of beta.
For those needing to work offline and connect to relational databases, a new Insights Desktop is available in public preview. Please note, Insights Desktop will release in mid-October. Once released, you can download Insights Desktop.
ArcGIS Earth
Explore any part of the world with ArcGIS Earth. Work with a variety of 3D and 2D map data formats, including KML. Display data, sketch placemarks, measure distances and areas, and add annotations
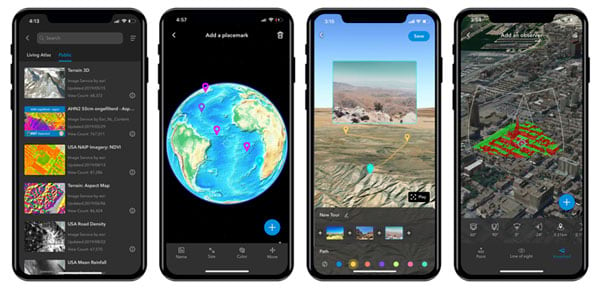
The mobile version of ArcGIS Earth enables users to access content, tools, and analysis from anywhere, whether it’s online or offline. ArcGIS Earth introduces three methods to add data on mobile devices – Add data from Portal Content, Add local files, and Add data by Url. When connected with a network, you can add web scenes, map services, image services, scene services, and feature services. You can also browse rich content provided in the Living Atlas.
ArcGIS Earth supports intermittent connectivity by allowing you to add local files including mobile scene packages (MSPK), KML, KMZ, tile packages and scene layer packages (SLPK).
Users can collect placemarks as point KMZ files, perform 3D interactive analysis, as well as create and share your memories with geotagged photos. To get ArcGIS Earth for mobile, visit the Google Play or App Store on your supported mobile device. Learn more about the release.
Coming soon
ArcGIS Earth 1.10 and the next version on mobile devices are coming soon this autumn. ArcGIS Earth desktop 1.10 will provide a full package of KML editing capability, support mobile scene packages (MSPK), and offer an enhanced symbology feature. With the coming releases, users will have a collaborative workflow across platforms, and be able to add data to ArcGIS Earth on mobile by scanning a QR code generated by ArcGIS Earth on desktop.
ArcGIS Maps for Power BI
ArcGIS Maps for Power BI helps you unlock the power of location in your business intelligence with ArcGIS Maps for Power BI, available inside Microsoft Power BI. Create map visualizations that surface patterns and trends in your data, gain context with ArcGIS maps and demographic data, and make better business decisions.
ArcGIS Maps for Power BI is updated regularly. In the October 2019 preview version, support for ArcGIS Enterprise 10.7.1 in an online environment is added. A final release with complete ArcGIS Enterprise support will follow soon.
A new sign-in workflow makes it easier to connect to your Free, Plus, ArcGIS Online, or ArcGIS Enterprise account. And map authors can now map up to 3,500 locations per map for free. ArcGIS Online and ArcGIS Enterprise users can map up to 10, 000 locations per map. For more information, see What’s new in ArcGIS Maps for Power BI.
ArcGIS Solutions
ArcGIS Solutions are free templates that configure ArcGIS to perform industry specific workflows. There are two new ArcGIS Solution templates that can be deployed into an ArcGIS Online organization.
Conservation Easement Monitoring is a new solution template that deploys into an ArcGIS Online organization a set of pre-configured apps to inspect, manage, and monitor conservation easements.
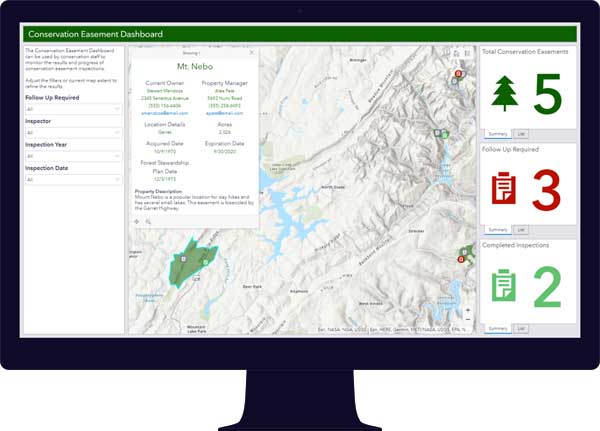
For more information
For more information and additional details, see the What’s new help topic or view all posts related to this release.

Commenting is not enabled for this article.