ArcGIS Online lets you better understand the world around you by connecting people, locations, and data using interactive maps. Work with smart, data-driven styles and intuitive analysis tools that deliver location intelligence. Make maps and apps to share your insights with your organization or to the world. ArcGIS Online can be used as complete, cloud-based solution, or use it to extend and complement the capabilities of ArcGIS Pro and ArcGIS Enterprise.
Don’t have an ArcGIS account? See Create an ArcGIS Account.
June 2020 release
ArcGIS Online is updated regularly. This release adds many new features and enhancements including new home page customization capabilities, improvements to Map Viewer Beta, a redesigned organization profile experience, and more.
Other related products are released on independent timeframes, but are part of the online ecosystem. This article also summarizes related product development that has occurred since the March 2020 ArcGIS Online release. For additional details, see the What’s new help topic or view all posts related to this release.
Quick links
Use the links below to jump to topics of interest.
ArcGIS Online
Core and featured products
- ArcGIS Living Atlas of the World
- Esri Maps for Public Policy
- ArcGIS StoryMaps
- ArcGIS Hub
- ArcGIS Solutions
- ArcGIS Business Analyst Web and Mobile
- ArcGIS Urban
- ArcGIS Analytics for IoT
- ArcGIS Dashboards
- ArcGIS Indoors
App builders
Apps for the field
- ArcGIS Collector
- ArcGIS QuickCapture
- ArcGIS Survey123
- ArcGIS Tracker
- ArcGIS Explorer
- ArcGIS Workforce
- ArcGIS Field Maps
Other apps and information

Featured in this release
New home page editor
The home page is the landing page of your organization’s website and serves as the primary gateway for your user community. It’s the visible face of your organization, and the context for finding and using maps, apps, and other resources. The home page is the primary destination that provides helpful resources and content for organization members and (if you allow access) for public visitors.
With this release, organization administrators and those with appropriate privileges can now design and build a modern and responsive landing page for their ArcGIS Online website using a new component-based home page editor.
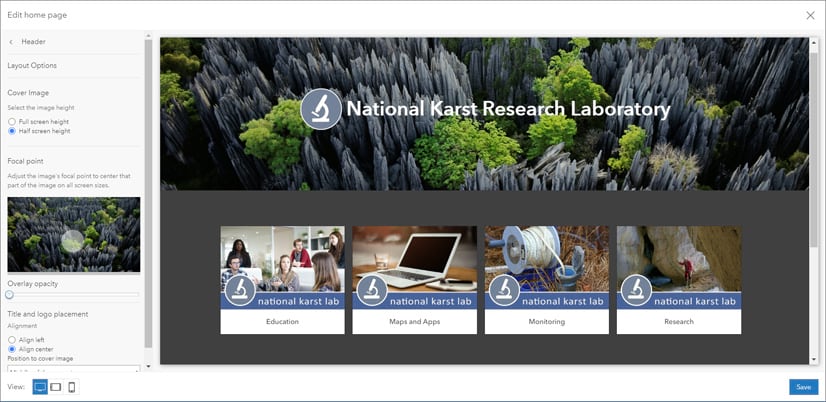
The new editor allows you to quickly create a a modern and professional-looking home page that reflects your organization’s branding and mission. Configure your home page using ready-to-use components and add item galleries and text blocks to showcase the content that is important to your community. Minimal customization options help your page work well on all devices, while branding your organization using an immersive cover image and item thumbnails.
New ArcGIS Online organization will experience the new capabilities by default. Existing organizations can smoothly transition from their current home page configuration to the new experience when ready.
For more information, see Configure home page.

ArcGIS Notebooks
ArcGIS Notebooks is no longer in beta and is available for all ArcGIS Online organizations. ArcGIS Notebooks provides a Jupyter notebook experience within ArcGIS Online to create, share, and run administrative, data management, and spatial data science workflows.
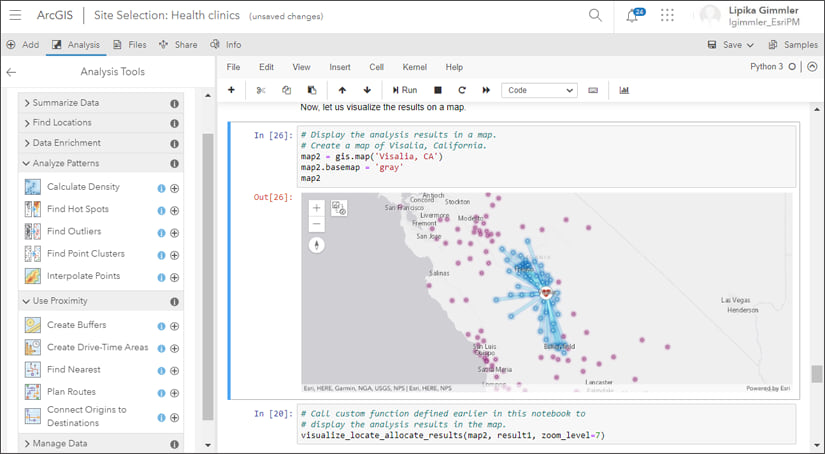
Using ArcGIS Notebooks you can:
- Use advanced analytics to arrive at statistically significant results with spatial algorithms and open-source Python libraries.
- Prep your data using spatial and open-source libraries to isolate an area of interest and identify anomalies.
- Train and perform inference on models using built-in tools with machine learning and deep learning frameworks.
- Leverage the built-in ArcGIS Python libraries to automate repetitive administrative tasks in your Web GIS.
- Explain your analyses by combining Python with interactive visuals and descriptions.
ArcGIS Notebooks is offered in several versions:
Standard: Includes ArcGIS API for Python and open-source Python libraries; ideal for administrative tasks, data engineering, and light analytics.
Advanced: Includes ArcPy plus everything in Standard; ideal for large scale data engineering, advanced analytics, and machine learning workflows.
Advanced with GPU: Includes GPU (increased memory and compute) resources plus everything in Advanced; ideal for computationally intensive workflows such as big data analytics, model training, and model inferencing.
Beta program participants should save any data that has been uploaded into their ArcGIS Notebooks local workspace, or to their ArcGIS Online organization. Data created during the beta will be removed as ArcGIS Notebooks is phased out of the beta program. Note that credit consumption rates will be applied based on the Notebook type.
For more information, see ArcGIS Notebooks.

Express setup for configurable apps
Configurable apps are template applications that you can configure easily, without any coding. They help you publish apps quickly to support a variety of users and workflows. Configurable apps are the fastest and easiest way to go from a map to a shareable app.
A new configuration experience is available for some ArcGIS Configurable Apps, including Nearby, Minimalist, Zone Lookup, and Attachment Viewer. These now include an express setup that presents a streamlined way to go from your map to an app in just a few clicks. A full setup option is also available for those wanting more detailed configuration options.
In addition, Category Gallery, one of the configurable apps for groups, now allows you to open the gallery to a specific category or subcategory via the URL. This enhancement makes it easy to share content of specific interest with others.

Accounts and administration
Administrators can create detailed reports of their ArcGIS Online organization’s members and items. These asynchronous reports can be exported for further review and analysis and are saved as items in your organization for future reference. For more information, see New Reports for Administrators.
Administrators can now set up OpenID Connect logins to allow members to sign in to ArcGIS Online using the same user name and password they use to sign in to their organization’s OpenID Connect-based login system.
In addition to Facebook, Google, and GitHub, a new social login option is available in ArcGIS Online. You can now sign in or sign up using your Apple account credentials.
Administrators can now bulk transfer items owned by one or more organization members to a new owner. This is useful when you need to delete members from the organization but want to keep their content in your site.
A new setting gives organizations more control over app downloads. Administrators can now prevent licensed members from downloading ArcGIS Pro from their settings page.

Other enhancements
Map Viewer
Using Map Viewer, you can create and display your imagery on the web. As the author of a map, you decide how the imagery in the map is presented. When you add an imagery layer to a map, the map initially uses the default display settings of the image service, however you can change the appearance and ordering of images. With this release, Map Viewer adds two new renderers for dynamically displaying imagery.
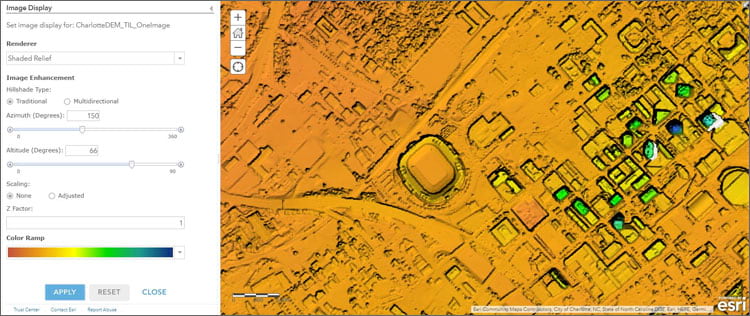
Shaded Relief is supported on imagery layers representing elevation data. The Shaded Relief renderer generates a colorized representation of the terrain by applying a color ramp to a hillshaded elevation layer using a traditional or multidirectional hillshade.
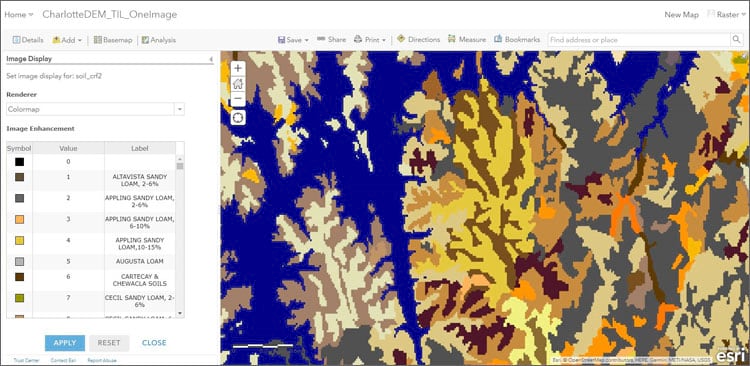
Colormap applies a predefined colormap to a single-band image to display a colorized red, green, and blue image. You can assign labels for each color to generate a new legend.
For more information, see Display imagery.

Map Viewer Beta
Map Viewer Beta is the next generation map authoring app for ArcGIS Online and ArcGIS Enterprise. It’s designed to inspire experimentation and creativity while providing an enhanced experience for map authoring workflows.
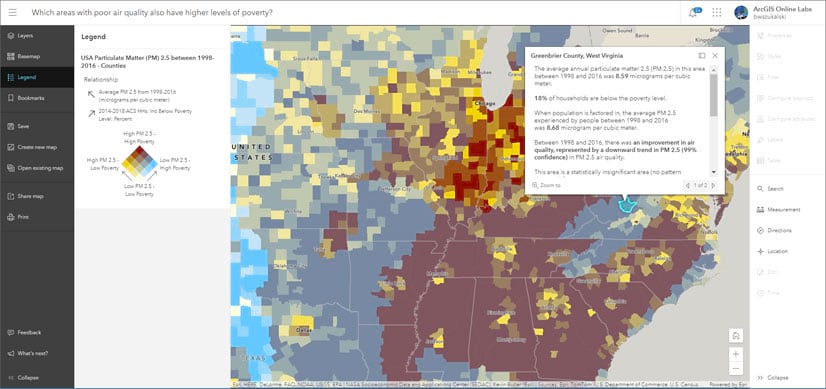
With the next update to Map Viewer Beta in ArcGIS Online (coming soon), several enhancements have been added including the following:
Using group layers you can organize layers in your map or app into groups. You can toggle groups of layers on and off and quickly, and reorder them to suit your needs.
Cluster labeling lets you add labels to clusters, including the number of features that are in each cluster.
Symbology has also been improved with vector point symbols that look sharp at all scales levels and enable changing colors.
Custom 2D vector collections published with ArcGIS Pro 2.6 are now available for styling point features.

Spatial analysis
The Join Features tool will transfer attributes from one layer or table to another based on spatial and attribute relationships. Optionally, statistics can be calculated for the joined features. The tool now has a new Keep all target features parameter. When the option is turned on, the tool returns all features in the target dataset, even if the features do not match any features in the join dataset (a left outer join). When it’s turned off, only matching features are returned (an inner join).

3D visualization
Water displays reflections of mountains, buildings, and other 3D objects when you select the Quality mode in the Scene Viewer Settings. Waves are now more visible from top-down views. You can adjust the look of wave animations with wave size and direction options in the Water style.
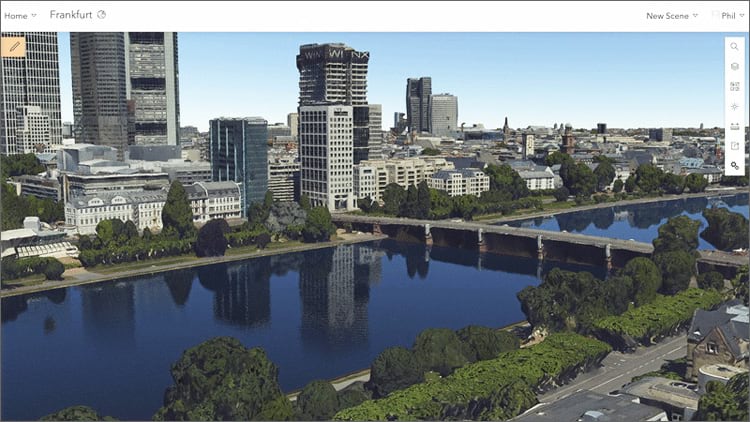
Integrated mesh scene layers now display modifications, such as flatten or mask, that are published from ArcGIS Pro. Developers can also access this functionality using the ArcGIS API for JavaScript.
Label callouts are available to style polygon feature layers and 3D object scene layers.
For more information, see the What’s new in Scene Viewer blog article.

Public authoritative items
If an organization is verified, public items that are marked as authoritative display the organization name as the item owner. Clicking the item owner link for public authoritative items shared by verified organizations now displays a pop-up with information about the organization and links to its Home page and gallery. The gallery provides easy access to resources, or showcases featured apps or stories.

Data management
Layer owners and administrators now have more fine-grained control over what types of updates editors can make. You can allow edits to feature geometry and attributes on some layers and allow only attribute edits on other layers within the same hosted feature layer, giving them more fine-grained control over what types of updates editors can make.
When you publish a hosted feature layer from a CSV file, you can now choose to include a subset or all locator output fields available from the ArcGIS World Geocoding Service service. These fields help you better understand the placement of features.
Layer owners and administrators can manage details for individual layers in a multilayer feature layer. Anyone with access to the layers can view the details of individual layers. For hosted feature layers, the layer owner or an administrator can create hosted feature layer views and publish other layers from individual layers.
ArcGIS Online includes several enhancements and new functionality for ArcGIS Arcade. You can now use template literals to simplify the manipulation of text strings. This update also offers new functions for working with geometries. For more information, see the Arcade release notes.

Geocoding
The World Geocoding service is changing the default response location for geocode requests. The current response provides the routing location (side of street), and now the service will provide the address location (rooftop/parcel). This change provides a more accurate and appropriate location for an address, and will be applied across address geosearch capabilities. Users who have implemented locator views for their organizations in the past and users of the routing and directions widget will not be impacted by this change.

ArcGIS Online Security Advisor
ArcGIS Online Security Advisor provides a full run-down of your organization’s security settings at the click of button, eliminating the need to review settings one-by-one administratively. Security Advisor also delivers recommendations based on your current settings.
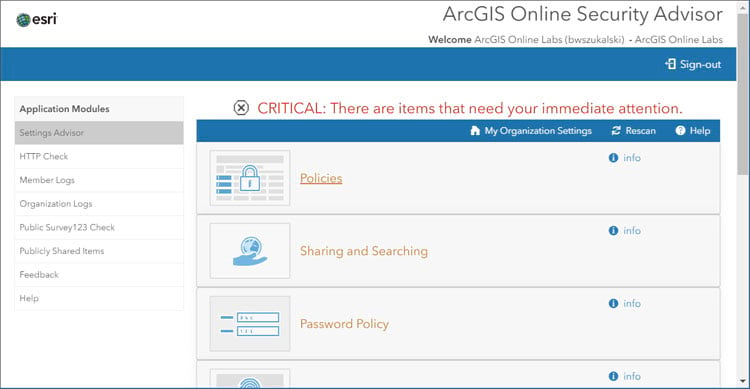
Enhancements in this update (v2.3.0) include the following:
HTTP Check will scan up to 10,000 items within an organization. Dashboards, Hub Sites, StoryMaps (and classic Story Maps), maps, scenes and apps created using Web AppBuilder and Experience Builder now offer editor links to make updates directly. These changes will assist organizations that still use non-secure URLs complete their updates by December, 2020, when HTTPS only will be enforced in ArcGIS Online.
Additional release notes can be viewed by clicking the version number in the lower right of the Security Advisor sign in page.
For more information, see the ArcGIS Trust Center, ArcGIS Online Security Advisor, or visit Esri Software Security and Privacy on GeoNet.

ArcGIS Living Atlas of the World
ArcGIS Living Atlas of the World is the foremost collection of geographic information from around the globe. It includes curated maps, apps, and data layers from Esri and the global GIS user community that support your work. Visit the ArcGIS Living Atlas of the World website where you can browse content, view the blog, and learn how you can contribute. Here’s what’s new, been recently released, or is coming soon.

Basemaps
Esri vector basemaps continue to be updated regularly with data from commercial, open, and community sources. The following summarizes recent changes and additions.
The localized vector basemap galleries are expanded and include creative styles with translated map content. Danish, Portuguese (Portugal), Norwegian, and Romanian have been added, bringing the total to 24 localized language basemaps. Localized basemaps automatically appear depending upon your organization’s language and locale setting. See all localized content.

Places, such as restaurants, stores, businesses, and other points of interest, are now included in Esri vector basemaps. These include several million places in the United States using SafeGraph Places as the source. Millions of HERE Places were added in many countries outside the United States.
The Places layer will be available in many of the styles available for the Esri Vector Basemaps and has first been added to beta styles of Streets and Imagery Hybrid maps. For more information, see New places in Esri vector basemaps.

OpenStreetMap (OSM) vector basemaps continue to be updated regularly and are available in a variety of styles. A new OSM Dark Gray Canvas style is also now available, and is designed to match Esri’s Dark Gray Canvas using thinned content from the full OSM data.
View more creative vector basemaps in the Creative Vector Tile Layers and Maps group, or search the Living Atlas website.

OpenStreetMap layers (beta)
A number of OpenStreetMap layers are now hosted in ArcGIS Online and available in the Living Atlas. Each layer is a feature layer view which references the OSM data in ArcGIS Online. The layers are updated at frequent intervals ranging from 1 to 15 minutes.
These feature layers allow you to access the latest OpenStreetMap data, such as buildings, highways, and amenities, created and edited by OpenStreetMap contributors. OSM layers can be used with any basemap, can be combined with other layers, and can be used for both visualization and analysis.

Recently the set of layers have expanded to include North America, Africa, Central America and Caribbean, Australia and Oceania, with additional layers and regions to be added soon.
To learn more and view the available layers, visit the OpenStreetMap Layers (Beta) group.

Community Maps
For many years, Esri has maintained a Community Maps Program through which the user community can share their local, authoritative data with Esri to be used in maps and services. Esri is now offering a new Community Maps Data Sharing option for contributors to have Esri share their data with selected Esri partners and other organizations (e.g. OpenStreetMap) that maintain popular mapping platforms.
In addition, you can enhance the geocoding experience by contributing your most recent, accurate, and comprehensive point or polygon address data to the ArcGIS World Geocoding service. New and existing Community Map contributors have already added over 3 million unique address points (view map). For more information, see Esri’s Community Addresses. You can contact the Community Maps team directly at communitymaps@esri.com.

Imagery
World Imagery content is continually updated, with many improvements and enhancements. To learn more about the latest updates, see What’s new in World Imagery (June 2020).
World Imagery Firefly has been enhanced using bumpification – a technique and style that includes terrain to accentuate and add elevation context to imagery. Bumpification applies a topographic texture to imagery at broad scales to convey the tactile surface of the earth that isn’t necessarily apparent in imagery alone.
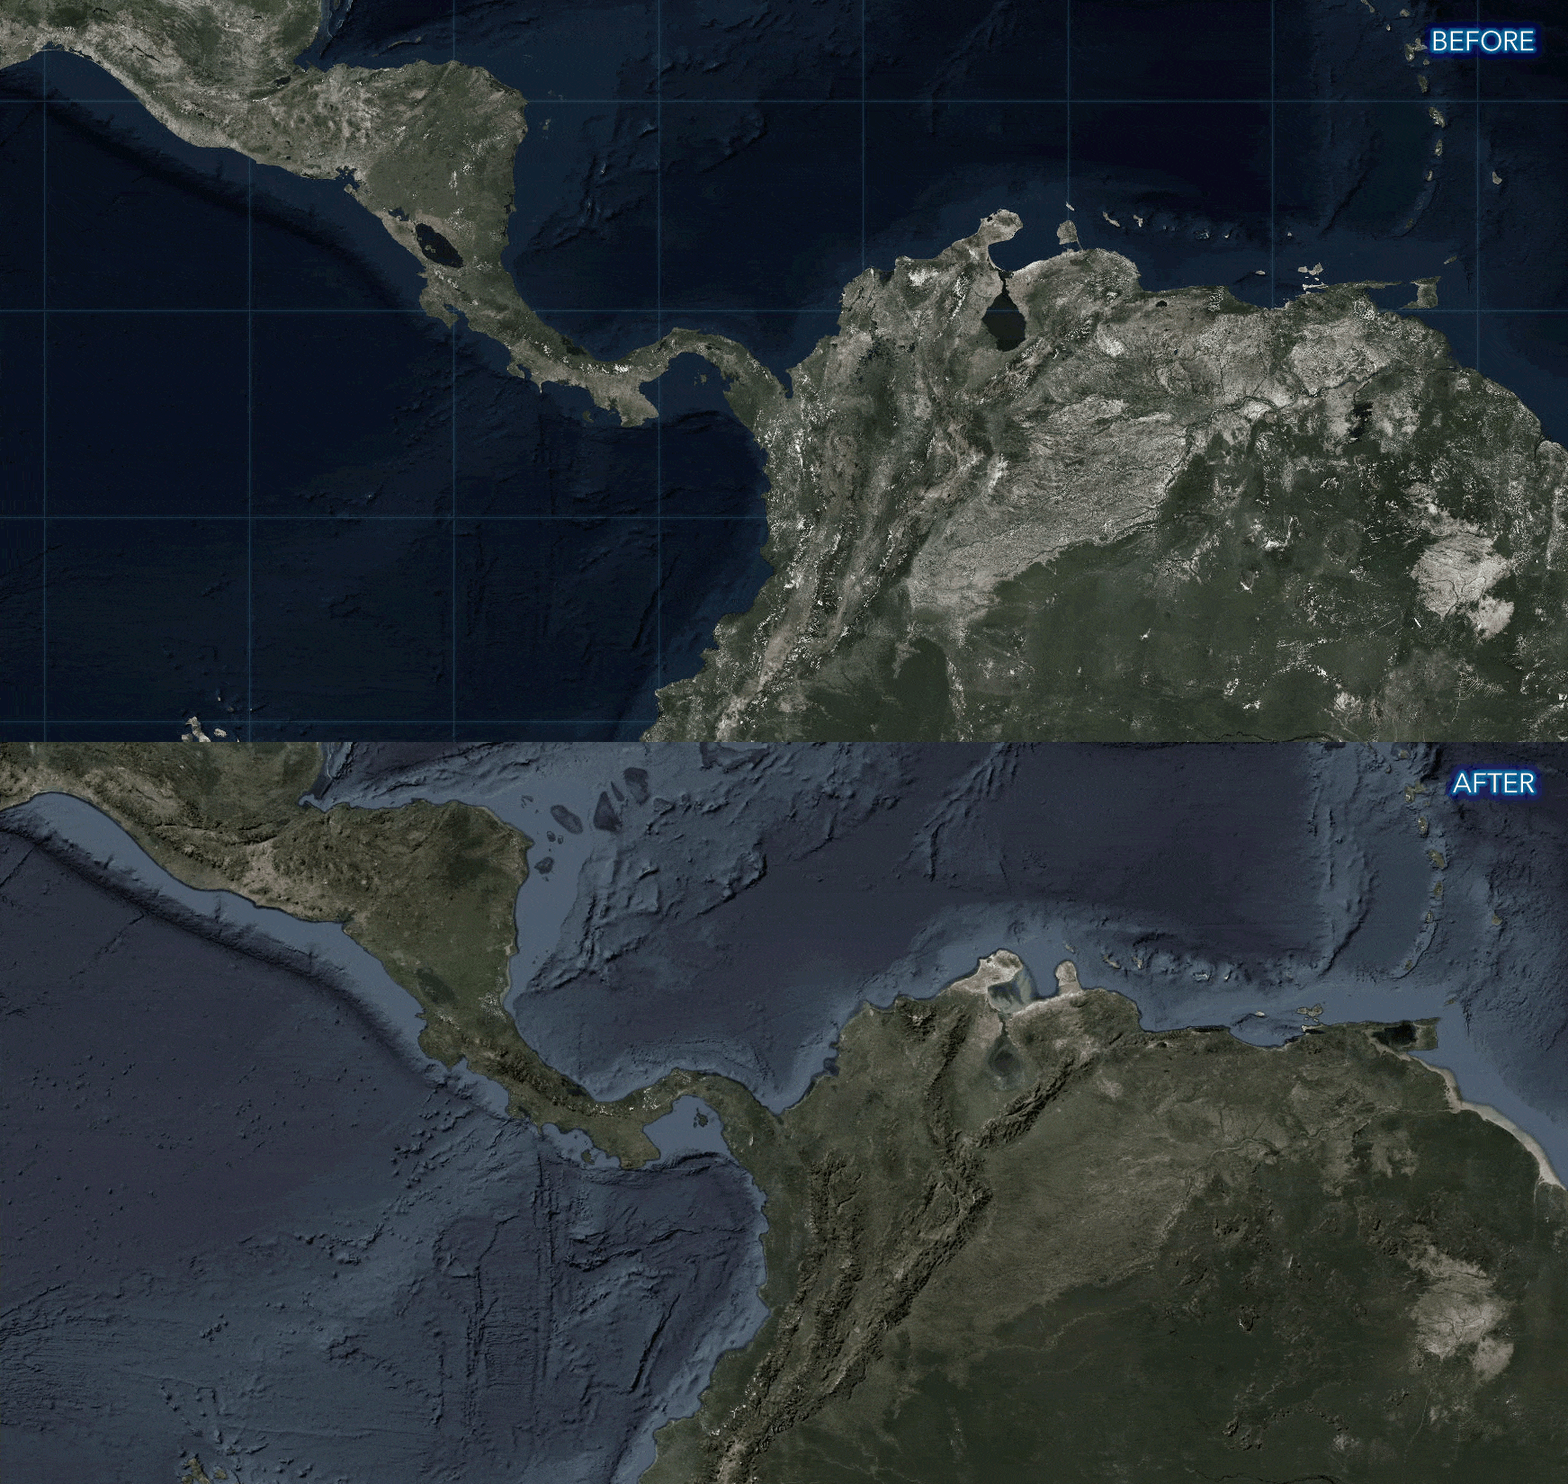
In addition, the graticules that used to appear as part of the Firefly basemap are now independently controlled, providing additional options in configuring the appearance of the Firefly basemap. For more information, see Firefly imagery updates.
Imagery metadata has been improved. When World Imagery is loaded as a layer in your map, as you pan across different geographic locations, and zoom in and out through different levels of World Imagery, you will encounter different sources of imagery.
Previously, when clicking a location in the map, the pop-up returned multiple records, including information about imagery above and below your current zoom level. Now, the pop-up will only return the metadata for the imagery currently visible at your geographic location of interest. See Learning more about the World Imagery basemap for more information.
National Agriculture Imagery Program (NAIP), featuring recent high-resolution imagery from the USDA Farm Services Agency, will soon be offered as a tile layer the Living Atlas. Living Atlas NAIP imagery has been visually enhanced and published for optimal display performance. The NAIP Image Service will continue to be maintained for anyone needing image analysis. Look for more information on the new tile layer in the coming weeks.

Environment
Satellite (VIIRS) Thermal Hotspots and Fire Activity is a new layer which presents the most frequently updated and most detailed global remotely sensed wildfire information from VIIRS satellites for the last seven days. This layer is updated hourly using the aggregated live feed methodology. The layer shows the location of thermal hotspots as a time-enabled service so that the progress of fires can be reproduced as an animation. Fire points in the layer are generally available within 3 ¼ hours after detection by the VIIRS satellite.

USA Current Wildfires is a new layer presenting the best-known point and perimeter locations of wildfire occurrences within the United States over the past seven days sourced from Integrated Reporting of Wildland-Fire Information (IRWIN) and National Interagency Fire Center (NIFC). Points mark a location within the wildfire area and provide current information about that wildfire. Perimeters are the lines surrounding land that has been impacted by a wildfire. This layer is updated every 15 minutes using the aggregated live feed methodology. This layer is also accessible through the USA Wildfire Activity App.

Recent Conditions in Air Quality (PM25) is a new layer that shows the latest PM2.5 value from the OpenAQ Community. PM2.5 represents particles of 2.5 micrometers or less which are a health hazard because they can get deep into respiratory system and damage delicate tissues. Activities such as driving, burning coal for electricity, wildfires, and running factories release such particles into the air. The exposure of populations to high levels of PM2.5 increases the risk of respiratory and cardiovascular illnesses. This layer is updated every hour using the aggregated live feed methodology.

Anti-Shipping Activity Messages is a new layer presenting the locations and descriptive accounts of specific hostile acts against ships and mariners, also known as Piracy. These reports are useful for recognition, prevention and avoidance of potential hostile activity. This layer is updated weekly using the Living Atlas aggregated live feed methodology.
USA Crop Frequency layer has been updated with 2019 data.
USA Cropland time-enabled imagery layer has been updated with 2019 data for the default view and all of its processing templates.
USA Federal Lands image layers and feature layers have all been updated. Each of the six agencies in the collection have various data vintages. See individual layers for more information.
Image Layers: USA Federal Lands, USA Bureau of Land Management Lands, USA Bureau of Reclamation Lands, USA Department of Defense Lands, USA National Park Service Lands, USA Fish and Wildlife Service Lands, USA Forest Service Lands
Feature Layers: USA Federal Lands, USA Bureau of Land Mangement Lands, USA Bureau of Reclamation Lands, USA Department of Defense Lands, USA National Park Service Lands, USA Fish and Wildlife Service Lands, USA Forest Service Lands
USA Historic Sites image layer and feature layer have been updated with PADUS 2.0 data, from September 2018.

Elevation
Living Atlas provides foundation elevation layers and tools to support analysis and visualization across the ArcGIS platform. These layers are updated quarterly with high-resolution elevation data from various sources and the Community Maps Program. Recent updates include the following:
World Elevation tiled layers (World Hillshade, World Hillshade (Dark), Terrain 3D, and TopoBathy 3D) are enhanced with high resolution elevation datasets from the USGS 3D Elevation Program (3DEP) at 1-meter resolution, Madrid 1-meter data, and Vienna 1-meter data.
World Elevation dynamic image service layers (Terrain and TopoBathy ) received 1-meter updates from the USGS 3D Elevation Program (3DEP), 5-meter updates from 3DEP for Alaska, and 1-meter updates for Australia (from Geoscience Australia and Moreton Bay regional council). These layers are suitable for analysis and visualization.

See High resolution data updates to Living Atlas world elevation layers for more information.

Other Living Atlas additions
U.S. Bureau of Labor Statistics (BLS) unemployment figures spanning the most recent 14 months is updated monthly, and is offered at the nationwide, state, and county levels. Layer attributes specify which month is associated with each statistic. This layer is used to author a collection of Living Atlas web maps for those wanting ready-to-use content for dashboards and StoryMaps. For more information, see County-level unemployment layer updated monthly now in ArcGIS Living Atlas.

You can now investigate annual air quality patterns in the United States with new maps and layers that have been recently added to Living Atlas. Topics include trends over time and impacts on populations.
USA Particulate Matter (PM) 2.5 between 1998-2016 is a recently added layer that shows particulate matter in the air sized 2.5 micrometers of smaller (PM 2.5). The data is aggregated from NASA Socioeconomic Data and Applications Center (SEDAC) gridded data into state, county, congressional district (116th) and 50 km hex bins. Each layer has been enriched with a set of 2019 US demographic attributes (excluding Puerto Rico) apportioned to the geography in order to map patterns alongside each other. For more information, see Explore Air Quality with New Layers and Maps in ArcGIS Living Atlas.
Over 100 race and ethnicity layers and maps are available, using current and past data, to help understand your community. Visit the Racial Equity GIS Hub for resources, content, and help in getting started.

Living Atlas continues to include daily updates to layers, maps and related StoryMaps on COVID-19 trends by country and by US county, sourced from Johns Hopkins University. Related maps, apps, and layers can also be viewed at the Urban Observatory’s COVID-19 Trends Gallery.

For more information about ArcGIS Living Atlas of the World see the Living Atlas blog or Living Atlas website.

Esri Maps for Public Policy
Esri Maps for Public Policy is a collection of expertly crafted and expressive Living Atlas maps that have been chosen because they reveal important community facts. Use the Policy Maps web app to browse and view the collection of maps that combine a variety of topics to help gain insight about demographics and more. Use the app to view and share single maps, or create collections of content that can be shared with anyone.
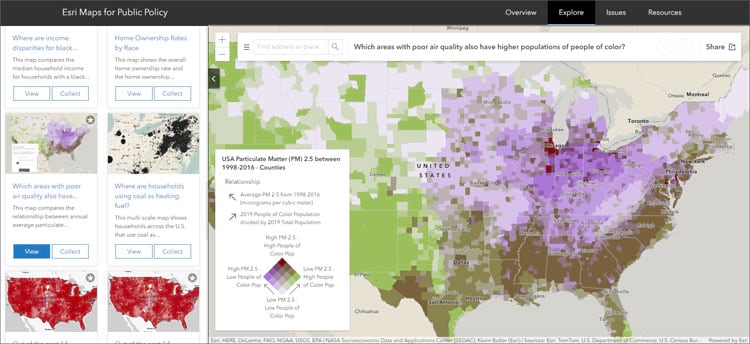
Esri Maps for Public Policy is continually updated and now includes maps crafted from the latest data, including U.S. Census Bureau’s American Community Survey (ACS) and U.S. Bureau of Labor Statics (BLS). Esri Maps for Public Policy now includes more environmental content, such as air quality and solar potential, as well as other topics important for policy discussions.
Some collection examples of newly added maps can be explored below:
- Unemployment
- Air quality and demographics
- Race and ethnicity maps for your community
- COVID-19 trends
These collections are only a sample of the available policy maps. To learn more, and explore and create your own collections, visit Esri Maps for Public Policy.

ArcGIS StoryMaps
ArcGIS StoryMaps make it easy to create inspiring, immersive stories by combining text, interactive maps, and other multimedia content. Publish and share your story with your organization, or with everyone around the world. ArcGIS StoryMaps continues to evolve with improvements to enhance your experience when telling stories with maps. The following new features and capabilities have been recently added.

Audio
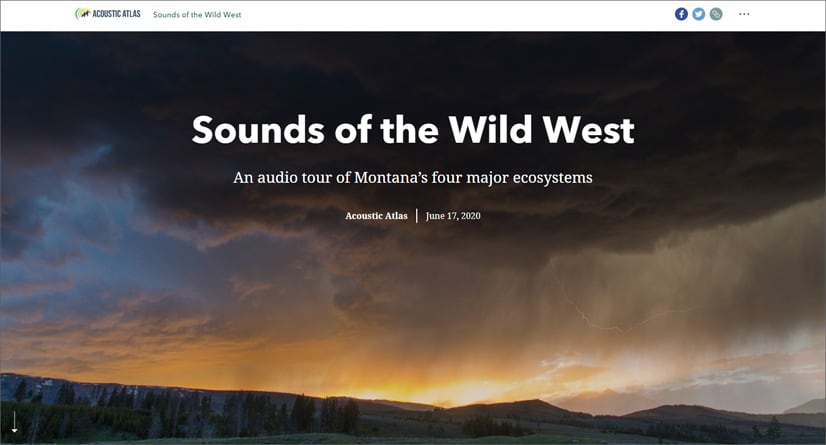
Add a new dimension to your stories by adding audio (beta). You can add inline audio clips within your narrative or add ambient sound to set the mood for your readers with background audio in a sidecar block. An unmute button will be shown on the first slide with background audio. Once the reader clicks this button, background audio will be unmuted everywhere in the story.
Inline and background audio both support MP3 and WAV files. Inline audio also supports embedding third-party audio hosting services such as SoundCloud.
Hear for yourself by viewing Sounds of the Wild West, a story that uses both inline and background audio.

Swipe
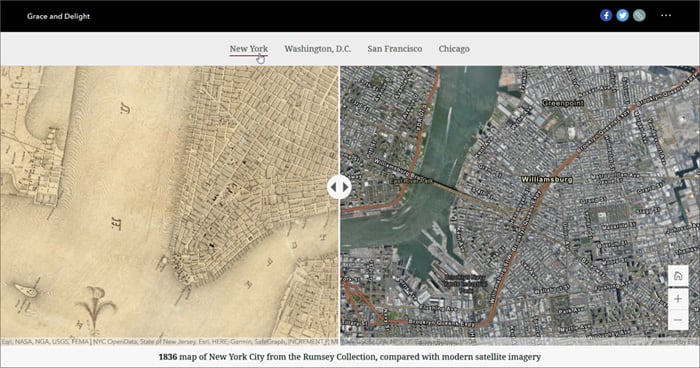
Easily compare two maps using the new swipe block. The swipe block includes options such as the ability to disable navigation, or show map legends. Click the navigation links found at the top of the main story body of Grace and Delight to view examples of swipe.

Collections
Two new navigation options are now available for collections: tabbed and bulleted. Reminiscent of the classic Story Map Series template, these new layouts are useful for driving presentations, grouping several stories together as chapters of a longer narrative, or bundling a set of ArcGIS apps and other resources together.

Other enhancements
Immersive sections such as sidecar, guided tour, swipe, and slideshow blocks can now be repositioned using drag and drop. Hover to reveal the handles, and reposition as desired.
If you do not want your readers to pan or zoom in a map, you now have the option to disable navigation on any express map, web map, or web scene.
Express maps and guided tours now offer a choice of more than a dozen Living Atlas vector basemaps. Or, you can use one of your own web maps in a guided tour. The tour will inherit the basemap and other layers from your web map.
Other new features include express map point groupings, new sidecar panel size and style options, helpful embed tools, click to enlarge an image, accessibility updates, and more. In addition, ArcGIS StoryMaps will be available to ArcGIS Enterprise users in the upcoming 10.8.1 release.

For more information see What’s new in ArcGIS StoryMaps (June 2020) or What’s new in StoryMaps (July 2020).

ArcGIS Hub
ArcGIS Hub is a cloud-based engagement platform that helps organizations work more effectively with their communities. It is available at two license levels: Basic and Premium. ArcGIS Hub Basic is included with ArcGIS Online and delivers data sharing and site creation capabilities. ArcGIS Hub Premium includes additional features and capabilities for working with teams of people, including members of the community at-large.
The following new features were released between March and June of this year:
You can now create new apps (StoryMaps, Experience Builder, Survey123, Dashboards, Web Maps, etc.) directly from ArcGIS Hub, eliminating the need to move back and forth between your ArcGIS Online and ArcGIS Hub environments.
A new language translation tool lets you more easily create multilingual sites and pages. Site visitors can choose the language they prefer with a simple click of a button.
New initiative templates are available to both Hub Basic and Hub Premium users: Coronavirus Response, Coronavirus Business Continuity, and Grocery Store Inventory-COVID-19.
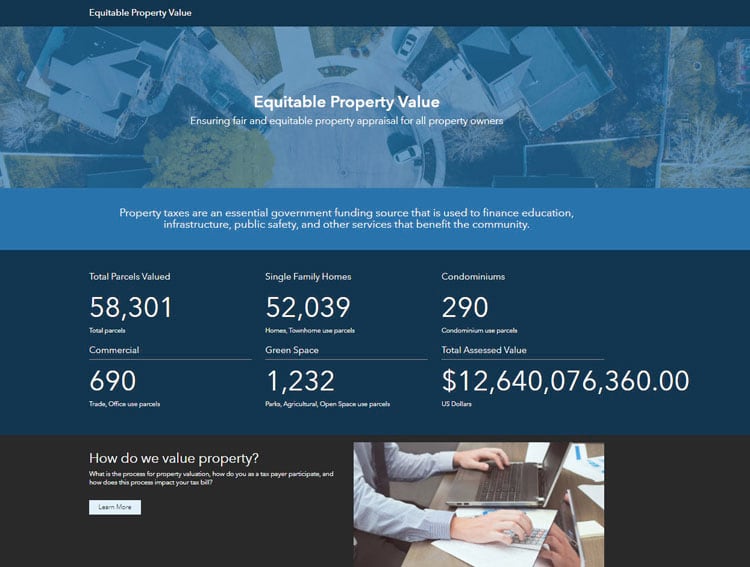
Hub Premium customers have access to even more new initiative templates: Equitable Property Value, Citizen Problem Center, Coronavirus Recovery, Emergency Response, and Promoting Transparent Elections.
Site performance has been increased using new mobile-specific options and lazy loading images.
New user guides have been added to each initiative template. Hub Premium customers now also have a new and easy way to convert your initiative and its contents (sites, apps, surveys, etc.) into a template for others to deploy.
A new Hub Status page lets you view the Hub health dashboard. Similar to the ArcGIS Online Health Dashboard, this page provides updates on service availability and allows you to submit an issue if you notice delays or outages.
More information
If you’re interested in trying out the freely accessible Grocery Store Inventory template, see Crowdsource resource availability using ArcGIS Hub. And if you are interested in learning more about the Coronavirus Recovery template, see Coronavirus Small Business Recovery Solution Released.
To get started with ArcGIS Hub, you can view new ArcGIS Learn lessons, sign up for an upcoming webinar, and sign up for the Hub newsletter. For other information, see the ArcGIS Hub website.

ArcGIS Solutions
ArcGIS Solutions are a collection of focused maps and apps that help address challenges in your organization. Part of the Esri Geospatial Cloud, ArcGIS Solutions leverage your authoritative data and are designed to help you improve operations, gain new insight, and enhance services.
The new ArcGIS Solutions app is now available in the App Launcher for all ArcGIS Online users making it easy to deploy solutions in your organization. At this release the app includes more than 25 solutions for State and Local Government, Conservation, Public Safety, Utilities, Defense, and Business ArcGIS users.
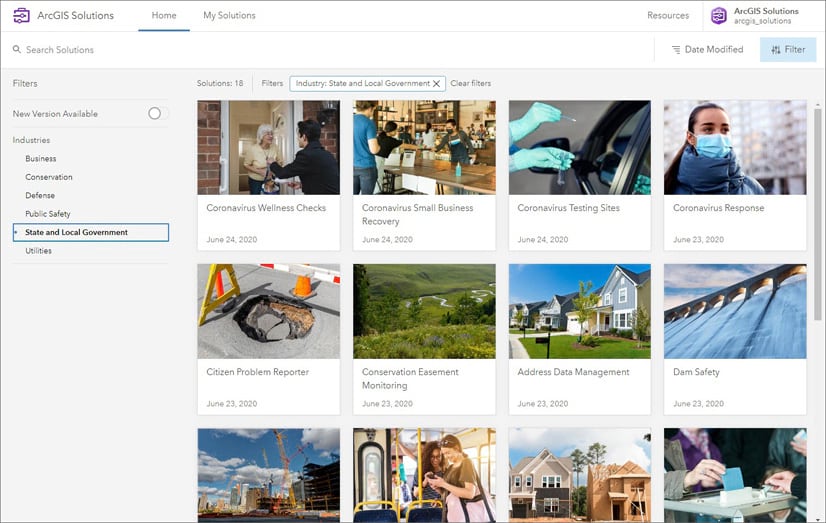
When you launch the app, you can browse a gallery of solutions, learn more about the capabilities provided with each solution, and even deploy the solution with a single click. The ArcGIS Solutions app will then create a new Solution item in your ArcGIS organization and all the maps, apps, groups, and layers required to fully utilize the solution.
The new Solution Item allows you to quickly see which maps and layers are used by a given map or application. It also provides an easy way to access and configure the individual items provided with the solution.
For more information, and to view the full catalog of over 400 solutions, visit solutions.arcgis.com.

ArcGIS Business Analyst Web and Mobile Apps
See people and opportunities clearly using ArcGIS Business Analyst. Through desktop, web, and mobile apps, ArcGIS Business Analyst provides location-based intelligence for planning, site selection, and customer segmentation. Combine demographic, lifestyle, and spending data with map-based analytics for accurate reports and dynamic presentations.
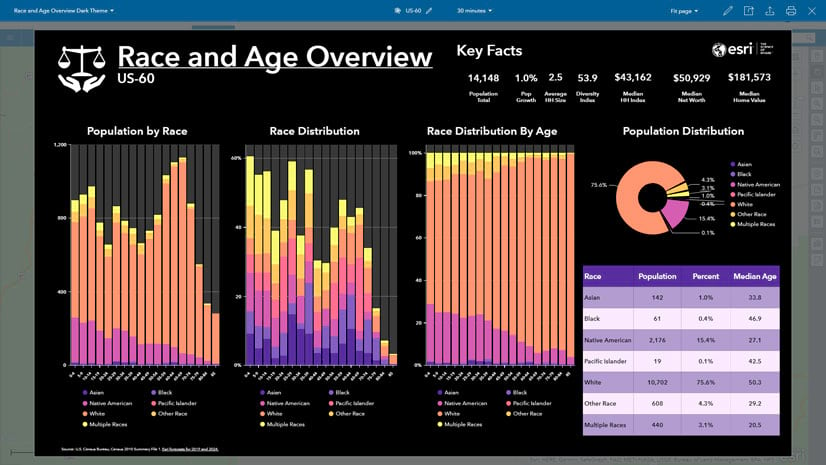
The June 2020 release of ArcGIS Business Analyst Web and Mobile includes the following new features and capabilities:
Batch infographics
Side-by-side comparisons to view a single infographic for up to ten areas were introduced in March. These capabilities have been expanded, and now you can run multiple infographics for multiple areas at once, then export up to 100 at a time as a Zip file. An option has been added so you can export your infographics without having to first run them individually.
Void analysis normalization
Normalization variables have been added to the void analysis workflow, including population, households, or consumer expenditure for better insight into where gaps exist. Adding normalization variables provides additional context to determine if a true gap exists, or if there are simply fewer identified businesses because fewer people live or work in the analysis area when compared to the reference area.
Standard geographies in custom data setup
A new option allows you to set up layers as standard geographic boundaries, such as county and state. These layers can be combined with Esri data in infographics, reports, and analysis workflows.
Enhanced map reports
Exported PDF map reports have a new and improved appearance. You can now generate professional-quality map reports using vector basemaps for better detail and higher resolution.
New infographic report templates
There are many new infographic templates available with this release, including Coronavirus (COVID-19) Impact Planning Report and the Race and Age Overview. These infographic templates are both informative,(populated with data like population with no health insurance and population distribution) and visually stunning.
Customizable My Facts tab
In addition to the Standard Facts tab in Business Analyst Mobile, a fully customizable My Facts tab has been added to highlight the variables that you’re interested in.
2020/2025 Esri U.S. Demographic Data updates
Updates made to Esri’s U.S. demographics and data are now available directly in ArcGIS Business Analyst Web. This release adds Esri 2020 to 2025 demographic forecasts, including U.S. population, income, households, consumer spending, Tapestry Segmentation, and more.
For more information, see ArcGIS Business Analyst resources or What’s New in ArcGIS Business Analyst Web App (June 2020).

ArcGIS Urban
ArcGIS Urban is an immersive 3D experience designed to improve urban planning and decision-making. You can visualize projects in your local context and leverage location intelligence to drive better decisions, be more proactive and less reactive in your planning process, and simplify project collaboration across internal agencies and public stakeholders.
The June release of ArcGIS Urban adds support for land use planning by introducing a set of tools to help you plan the development of land use over large areas. The grid tool allows you to easily divide up large parcels or dissolve many smaller parcels into a conceptual grid. With the paint tool, you can paint over parcels to apply zoning or land use types more efficiently.
Public feedback gathered from citizens or other stakeholders has been improved. You can now configure and schedule public feedback by plan and project and add categories in order to contextualize the comments and analyze the results.
Project editing has been added as a new capability which allows you to quickly sketch buildings, place trees, vehicles, street furniture and ground visualizations.
Skyplanes is a newly added zoning parameter that lets you create and visualize plausible building and zoning envelopes. This new parameter is set based on the parcel edge, often slicing the zoning envelope at an angle which results in buildings getting thinner with increasing height.
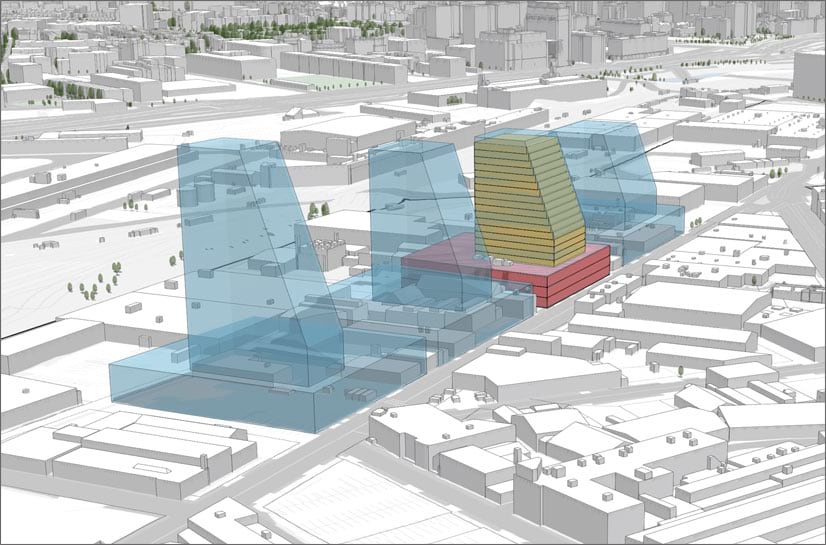
A new and improved data model allows users to better collaborate on plans and projects. Please note that already existing urban models need to be migrated in order to make use of these new features, a guided migration is available to walk you through the process.
Other enhancements include:
- The list of capacity metrics has been expanded to include parking, emissions, and other metrics that are calculated automatically and can be exported for further analysis.
- A line of sight analysis tool has been added.
For more information, see What’s New in ArcGIS Urban (June 2020).

ArcGIS Analytics for IoT
ArcGIS Analytics for IoT enables you to easily connect to sources of streaming sensor data, analyze it for incidents and patterns, and take actions and send notifications. Combine powerful out-of-the-box analysis tools into automated workflows whether you are working with data in real-time, in near real-time, or over time.
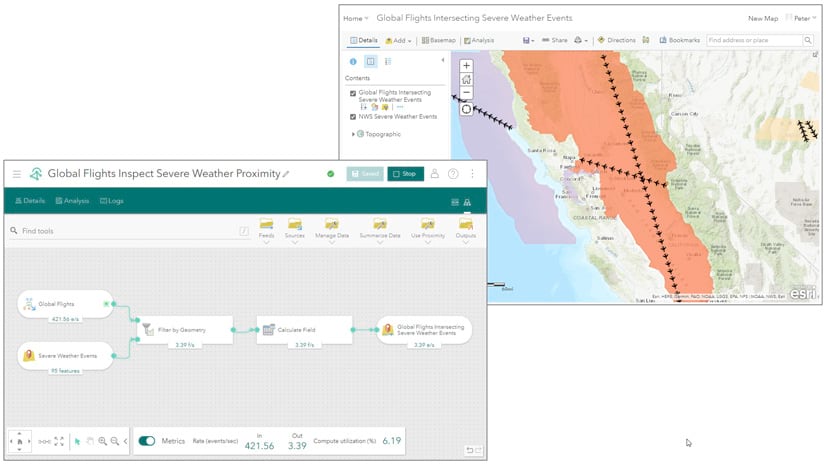
The June 2020 release of Analytics for IoT contains new features and enhancements including:
- The ability to configure analytics to send text messages as notifications using the new Text Message output.
- Insight into additional feed metrics including event velocity, attribute velocity, and data size.
- For feeds that poll a website for data you can enter URL parameters with new inline variables to utilize the current polling timestamp in queries to always request the latest data from any API.
- New Find Similar Locations big data analytic tool that identifies features most similar or least like a set of reference features.
- Metrics for running analytics. Real-time analytics display information about incoming and outgoing data velocity, and big data analytics report information on the number of features ingested and produced in the result.
- Enhanced subscription utilization metrics for administrators.
- The Analytics for IoT application now supports full internationalization including translation.
Analytics for IoT is licensed as an additional subscription on top of ArcGIS Online. For additional details on Analytics for IoT, see What is ArcGIS Analytics for IoT, the ArcGIS Learn discovery path, and product blogs.
For more information, see What’s new in ArcGIS Analytics for IoT.

ArcGIS Dashboards
ArcGIS Dashboards enables users to convey information by presenting location-based analytics using intuitive and interactive data visualizations on a single screen. Every organization using the ArcGIS platform can take advantage of ArcGIS Dashboards to help make decisions, visualize trends, monitor status in real time, and inform their communities.
You can try ArcGIS Dashboards Beta by choosing Dashboards Beta from the app launcher. The beta has the same functionality as ArcGIS Dashboards but includes new features and an enhanced user experience, including support for Arcade in dashboard elements, new statistic types, additional data source support, and more. For more details, see What’s new in the ArcGIS Dashboards Beta on GeoNet.

ArcGIS Indoors
With this release, ArcGIS Indoors is now available for purchase and use with ArcGIS Online.
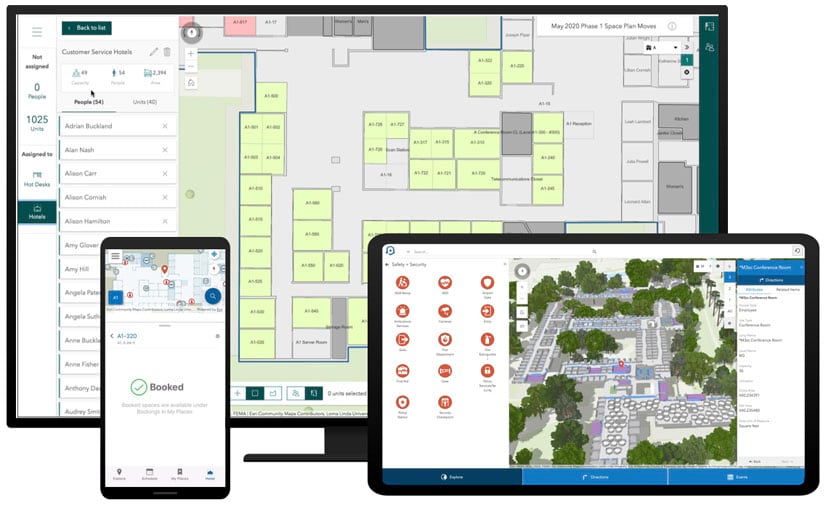
ArcGIS Indoors provides:
- A web and mobile occupant experience for workspace reservation, location sharing, facility incident reporting, and way finding.
- Support for facility operations through problem reporting, asset management, and mapping for safety and security.
- A new app template for space management called Space Planner, that supports office assignments, space allocation, and office hoteling
- Data management tools to aggregate CAD and BIM floor plans into a geodatabase to build indoor maps.
In addition, ArcGIS Indoors offers device tracking to support finding and tracking people indoors, and offers integration with Microsoft Office 365. For more information, see the ArcGIS Indoors product overview or view ArcGIS Indoors: An Introduction.

App builders
App builders let you easily create custom apps, no coding required. App builders have been updated with the following enhancements.

ArcGIS Experience Builder
ArcGIS Experience Builder empowers you to quickly transform your data into compelling web experiences for a variety of audiences, across browsers and all devices, with no coding required. Experience Builder provides complete control over the layout and design elements, supporting both mapcentric and nonmapcentric apps via fixed or scrolling screen, on single or multiple pages. Provided templates and widgets help you get started quickly, and can be extended with your own.
ArcGIS Experience Builder introduces new Bookmark, Card, and Divider widgets, configurable windows for splash screens, alerts, and confirmations, and data views to control what appears in connected widgets by applying filter and sort criteria to feature layers.
A total of eight new templates have been added, including two supporting multi-page apps.
You can now choose from a variety of animation styles for visual effects and widget appearance, such as fly in, fade in, box, and cube.
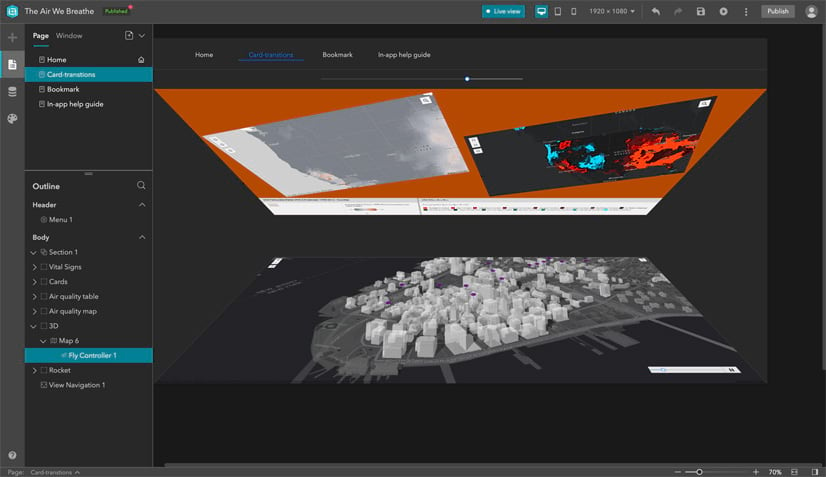
Other highlights include:
- More data types are supported.
- Image widgets can be populated from feature layer attachments.
- You can duplicate widgets to copy and paste across pages.
- New settings have been added supporting styles for filter widgets.
For more information, see What’s new in Experience Builder.


ArcGIS Web AppBuilder
ArcGIS Web AppBuilder delivers a way for you to easily create web apps that run on any device, using a gallery of ready-to-use-widgets. You can customize the look of your apps with configurable themes and can host your apps online or on your own server. For this release, two widgets have been improved in ArcGIS Web AppBuilder.
- Parcel Drafter has added support to configure and edit attributes.
- Smart Editor has new configuration options to honor web map settings and expand related records on load. It now provides an option to enable a value picker for Intersection Attribute Actions intended to provide choices for multiple intersecting values.
- When specifying attribute actions presets, you can now select date values from the data.
For more information, see What’s new in ArcGIS Web AppBuilder.


ArcGIS AppStudio
ArcGIS AppStudio lets you turn your maps into beautiful, consumer-friendly mobile apps ready for Android, iOS, Windows, macOS, and Linux. With AppStudio, any organization can build cross-platform native apps easily. Any Creator or GIS Professional user type can create native apps and share them with members of an organization using AppStudio Player. And with an AppStudio Developer Edition license you can publish your apps to all major app stores.
In the upcoming release, the Map Viewer template includes support for enhanced html popups and Arcade expressions. The Map Viewer template also adds a new sketching tool to quickly draw shapes, arrows, and text on a map. The map sketches are then available to quickly send to others through email, text, chat and other methods supported by your operating system’s sharing capabilities. Additionally, with this release the ArcGIS Runtime for Qt has been updated to version 100.8, and Android 10 Google Play requirements for secure storage are supported. There are also new samples and updated templates demonstrating both new and improved components.
To try these changes now join the Early Adopter Program, and keep an eye on What’s new in AppStudio and the AppStudio GeoNet Place for the pending release.

Apps for the field
ArcGIS apps for the field help you use the power of location to improve coordination and achieve operational efficiencies in field workforce activities.
Note that product names have been adjusted to reflect a tighter alignment with the ArcGIS platform.

ArcGIS Collector
ArcGIS Collector is a mobile data collection app that makes it easy to capture accurate data and return it to the office. Fieldworkers use web maps on mobile devices to capture and edit data. ArcGIS Collector works even when disconnected from the Internet, and integrates seamlessly into ArcGIS.
Recent updates to Collector on the Android platform include high accuracy updates that achieve parity with the Classic version as well as support for signing in using PKI. On the iOS platform, support for attaching PDFs, Excel documents and Word documents to observations has been added along with the ability to use app links to update existing feature attributes.
For more information, see What’s new in ArcGIS Collector.


ArcGIS QuickCapture
ArcGIS QuickCapture is the fastest way to collect field observations. With this app, you can quickly record field observations from vehicles, conduct aerial surveys, or assess damage. Data can be sent back to the office for analysis in real time, eliminating time spent manually processing handwritten notes. ArcGIS QuickCapture is integrated with ArcGIS, so new data from the field can be used instantly for better decision-making.
In version 1.6 you can share projects from your device via a link or QR code, record and play back a NMEA log so that you can demonstrate your project anywhere and as a project author, disable whether locations can be edited once captured. You can also share your own templates with your organization, and collaborate with others to configure a project. A new sample project for roadkill removal is available.
Download QuickCapture or to learn more, see Whats new in QuickCapture, visit the QuickCapture GeoNet Place, or view What’s New in Quick Capture 1.6.


ArcGIS Survey123
ArcGIS Survey123 is a simple and intuitive form-centric data gathering solution that makes creating, sharing, and analyzing surveys possible in just three easy steps.
The upcoming release (version 3.10) includes many enhancements throughout the product. In both the field and web apps there are new question types and a survey can be launched by links for capture, editing or viewing.
Survey123 Connect supports organization basemaps. Authors can configure how surveys are updated and managed in the field app. In the field app you can now use webmaps, mobile map packages, and vector tile packages.
In the website organization administrators can manage surveys and feature reporting has been expanded to include aggregation and summary sections.
Join the Early Adopter Program to try these changes now. For additional information, keep an eye on Whats new in Survey123 and the Survey123 GeoNet Place.


ArcGIS Tracker
ArcGIS Tracker is a mobile solution that enables organization to capture tracks of field staff, monitor where they are, and analyze where they have been. Tracker includes a mobile app for iOS and Android devices that efficiently runs in the background to capture location tracks. It also includes a Track Viewer web app that administrators can use to view tracks.
Tracker recently updated on both the iOS and Android platforms. The latest update brought support for signing in using PKI on Android devices.
For more information, see What’s new in ArcGIS Tracker.


ArcGIS Explorer
Take your maps with you everywhere you go with ArcGIS Explorer, a mobile app for iOS and Android, and now available on Windows 10. Take your GIS with you in the field, work offline, and add shareable notes and markup.
Explorer recently updated on all platforms. The Windows and Android platforms now support signing in using PKI. For more information, see What’s New in ArcGIS Explorer.


ArcGIS Workforce
ArcGIS Workforce is a mobile app solution that uses the power of location to coordinate your field workforce. It integrates work management to reduce reliance on paper and provides everyone with access to the authoritative data they need. ArcGIS Workforce is designed to help you reduce errors, boost productivity, and save money.
The next release of Workforce will support offline workflows, enabling your mobile workers to complete assignments in the field whether or not they have an internet connection.
Updates in the next release also include:
- User experience updates.
- Get directions from any navigation app on your device.
- Toggle layer visibility with the layers tool.
- View tracks from ArcGIS Tracker (iOS only).
Join the ArcGIS Workforce open beta program to try these capabilities now.


ArcGIS Field Maps (beta)
ArcGIS Field Maps is Esri’s new premier field mapping app available on iOS and Android devices.
Field Maps will combine the following capabilities into a single app that is easy to use and simple to deploy:
- Simple map viewing and markup
- High accuracy field data collection and inspection
- Battery-optimized location tracking
- Work planning and task management
- Turn-by-turn navigation
Capabilities will be released in 3 phases and the first phase of ArcGIS Field Maps is in beta now. Please join the early adopter program to learn how ArcGIS Field Maps will transform the way you do field work.

ArcGIS Maps for Adobe Creative Cloud
ArcGIS Maps for Adobe Creative Cloud enables innovative professionals to access and design with data-driven maps inside Adobe Illustrator and Photoshop. Quickly find and add geographic content to your work as editable vector layers and high resolution images.
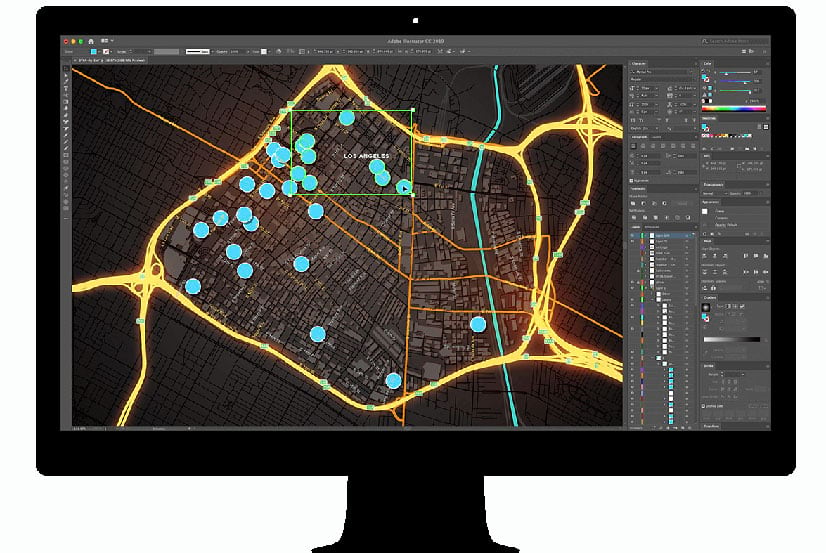
The latest release of ArcGIS Maps for Adobe Creative Cloud includes new features and a redesigned interface for finding content and running processes. New features and enhancements include:
A new Join Lines process lets you join the endpoints of segmented paths to improve the appearance of linear features such as roads.
You can now open exported maps and layouts from ArcGIS Pro (2.5 or later) in Illustrator when you sign in to the Maps for Adobe extension with an ArcGIS Online account. Once opened in Illustrator, the file can be used for graphic design or map finishing workflows and accessed across other Adobe Creative Cloud applications.
To learn more about the new workflows, watch What’s New in ArcGIS Maps for Adobe Creative Cloud 2.0.

Learn ArcGIS
Learn ArcGIS is a website containing timely and engaging guided lessons that are based on real-world problems, covering the entire ArcGIS platform. Whether you are new to GIS, or are a seasoned analyst, Learn ArcGIS has resources to help you build your GIS skills. Learn at your own pace based on your needs and interest.
Learn ArcGIS has grown to 187 lessons, plus dozens of articles, StoryMaps, videos, and learning paths. You can find the lessons in the Lesson Gallery. Use filters to quickly find resources.
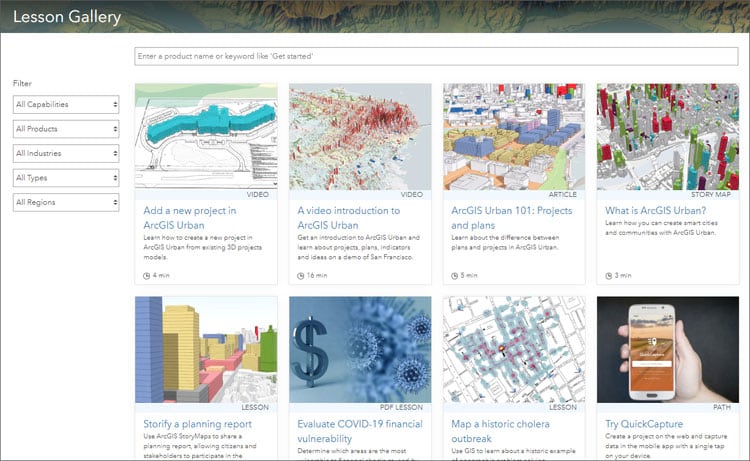
To support response efforts related to COVID-19, new Learn lessons have been added, including a learning path of twelve ArcGIS Insights lessons. See Use ArcGIS Insights for understanding and responding to COVID-19.
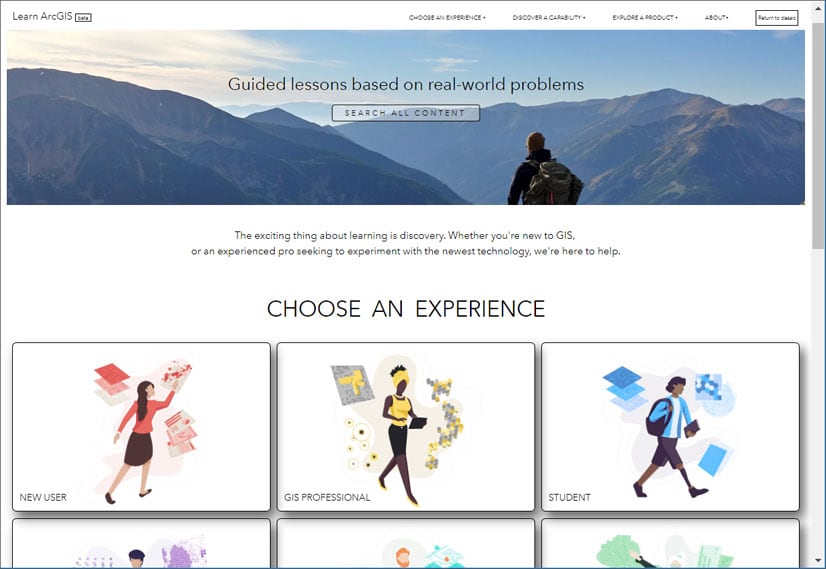
Learn ArcGIS Beta is a new ArcGIS Hub site that allows you to explore Learn ArcGIS content by choosing one of six roles, including new user, GIS professional, student, data scientist, teacher, and professor. Each offers a set of Learn content and other resources curated for people who choose that role.
The site also includes sets of lessons grouped by capability for mapping, field operations, spatial analysis and data science, imagery and remote sensing, real-time visualization, and 3D visualization.

More information
For more information and additional details about this release, see the What’s new help topic or view all posts related to this release.

Commenting is not enabled for this article.