ArcGIS Online lets you understand the world around you by using interactive maps to connect people, locations, and data. You get smart, data-driven styles and intuitive analysis tools that deliver location intelligence. ArcGIS Online gives you the ability to make maps and apps to share your insights with your organization or the world. It can be used as a complete, cloud-based solution, or use it to extend and complement the capabilities of ArcGIS Pro and ArcGIS Enterprise.
Don’t have an ArcGIS account? See Create an ArcGIS Account.
Quick links
Use the links below to jump to topics of interest.
ArcGIS Online
Core and featured products
- ArcGIS Living Atlas of the World
- ArcGIS StoryMaps
- ArcGIS Urban
- ArcGIS Hub
- ArcGIS Velocity
- SiteScan for ArcGIS
- ArcGIS Solutions
App builders
Apps for field operations
Other apps and information
- ArcGIS Maps for Adobe Creative Cloud
- ArcGIS GeoPlanner
- Esri Redistricting
- ArcGIS for Power BI
- More information

Featured in this release
Home page configuration
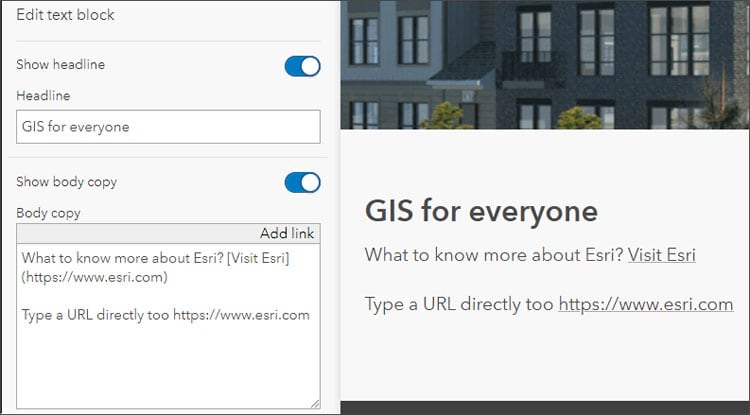
The home page configuration experience has been enhanced. Organization administrators can now include website and email links in body text and in item gallery summaries using markdown. Markdown syntax allows you to specify hyperlinks in text blocks without the security risks of using HTML tags. The syntax looks like:
[Visit Esri](https://www.esri.com)
The link text is in brackets and the URL in parentheses. The text can be typed in directly, or you can click Add link to automatically format the text.
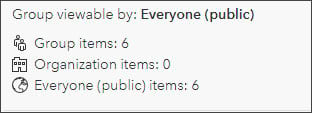
When item galleries are configured, you can now display specific item types, for example, maps, layers, or apps. When configuring an item gallery, the configuration panel now shows additional information about the shared state of the group and items inside it. This lets you ensure that the item gallery is visible to the appropriate audience, whether members of your organization or the public.
The home page footer has has also been enhanced by letting editors add custom text and links. You can also provide feedback about the home page editor and experience using a new feedback link.

Member profile improvements
Member profiles have been updated making it easy to showcase your content and yourself. You can now control which items are listed in the item galleries linked to your profile. Use the item picker to select the items you want to display in your profile gallery, then order the items by dragging and dropping them in place. For more information, see Brand yourself with the new user profile page.

ArcGIS Notebooks
ArcGIS Notebooks provides a Jupyter notebook experience within ArcGIS Online to create, share, and run administrative, data management, and spatial data science workflows.
ArcGIS Notebooks now has a new and improved home page experience, letting you have a comprehensive view of all of the notebooks you’ve created, notebooks shared with you within your organization, and curated notebook samples that are available for you to quickly start your own automation and analysis workflows. A new notebook search feature lets you quickly find the notebooks that you are looking for by entering the notebook name.
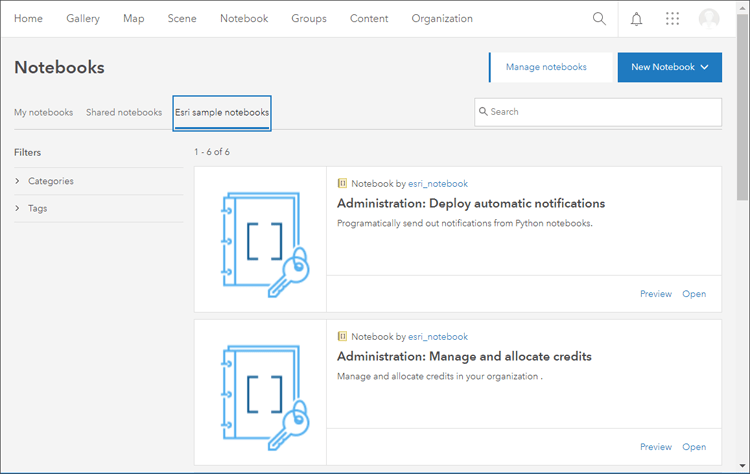
You can now select the type of notebook environment needed based on the type of task you want to perform – whether it is automation, lightweight analysis and data engineering, or advanced analysis that would need larger compute resources. Administrators can also view and manage all running notebooks in their organization.
For more information, see Get started with notebooks.

Configurable apps
Configurable apps are template applications that you can configure easily, without any coding. They help you publish apps quickly to support a variety of users and workflows. Configurable apps are the fastest and easiest way to go from a map to a shareable app.
A new configuration experience is available for Category Gallery and 3D Viewer (formerly named Scene with Inset Map). Build your apps using the express setup or configure them using the full setup, and see your changes as you make them. Apps that use the new configuration experience can now be enabled for Google Analytics tracking. For more information, see What’s new in Configurable Apps.

3D visualization (Scene Viewer)
New context-aware navigation helps you move around your scenes by detecting an area of interest. For example, you can interact more intuitively with underground earthquakes or power lines made of point cloud data.
You can search for features in building scene layers. Scene Viewer queries the associated feature layer in a building scene layer allowing you to search for individual features of BIM (Building Information Modeling) data.
Scene Viewer extends support for scene layers with associated feature layers. Applied edits that haven’t been updated in the i3s cache are now accounted for and rendered. In addition, pop-ups show attribute values coming from related feature tables.
Transparent objects are rendered independently of the camera position. The new order-independent transparency (OIT) distinguishes multiple layers of glass or the back side of transparent buildings and other 3D symbology.
Local scenes can now load and visualize more datasets by supporting additional custom coordinate systems defined by a Well-Known Text (WKT) string.
For more information, see What’s new in Scene Viewer (December 2020).

Other enhancements
Map Viewer Beta
Map Viewer Beta is the next generation map authoring app for ArcGIS Online and ArcGIS Enterprise. It’s designed to inspire experimentation and creativity while providing an enhanced experience for map authoring workflows.
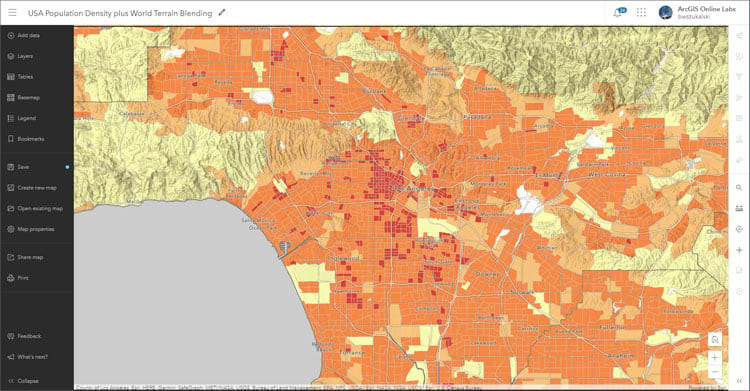
Several enhancements have been added to Map Viewer Beta since the last ArcGIS Online update. Highlights include adding layers from the web and blend modes. For more information, visit the Map Viewer Beta GeoNet community.

Data management
If you enable attribute edits on a hosted feature layer or hosted feature layer view, you can further control edits by enabling or disabling editing on individual fields. The toggle can be found in the feature layer Data tab by selecting Fields, then editing the setting.
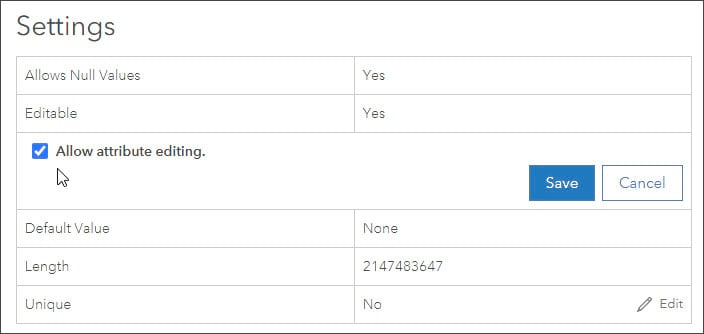
When you create a hosted feature layer view, field properties are inherited from the source hosted feature layer. You can alter the display name, description, field value, and editing properties for fields in the hosted feature layer view without affecting the properties on the source hosted feature layer. For more information, see Settings inherited from the hosted feature layer that you can change.
Beginning with ArcGIS Pro 2.7, you can publish a building scene layer with an associated feature layer to ArcGIS Online.
New Arcade functions have been added to make working with arrays easier.
The total storage size of all files attached to a hosted feature or table layer is displayed separately from the layer size in the Details section on the Overview tab of the layer’s item page.

Organization management
Organizations now have more control over the Esri apps that members can use. Administrators can block members’ access to applications included with user types that cannot be controlled through licenses, settings, or privileges. Blocking access to the app removes it from the member’s app launcher and the open in drop-down menus for items, and also prevents members from opening the app from a URL.
When purchasing an ArcGIS Online organizational subscription, you can now choose Asia-Pacific as the region where your geospatial data will be stored. The regional data hosting location is displayed for new and existing organizations on the Overview tab of the organization page.
Administrators can now change the order in which different login methods appear on the organization’s sign-in page.

Organization monitoring
Some administrative reports have been improved. The credit reports, which provide a detailed breakdown of weekly or monthly credit usage per member, now includes creation of ArcGIS Notebooks in addition to other credit-consuming activities such as geocoding, routing, and analysis.
The activity reports which lists all events (changes made to an organization’s members, groups, credit allocations, and content) can now be run for a specific day in addition to weekly or monthly.
A new Feature Data Store chart shows administrators how much of the organization’s allotted storage is being used. For organizations that use Premium Feature Data Stores, an additional chart displays the percent usage of database resources over time.

ArcGIS Companion
ArcGIS Companion makes it easy to use ArcGIS from your mobile device. In addition to the mobile browser option (just use your URL), you can now connect to ArcGIS using this companion mobile app for iOS and Android. Access ArcGIS anytime, anywhere, to explore content, view groups, edit your profile, and more.
For the latest 3.2 release, Companion received the following updates:
- Added Field Maps app to the Field Apps bundle.
- Notifications are sent to end users if ArcGIS Companion is blocked by the administrator.
- User interface and localization improvements.
ArcGIS Companion is available via Google Play, Apple App Store, and Amazon.

ArcGIS Security Advisor
ArcGIS Security Advisor provides a full run-down of your organization’s security settings at the click of button, eliminating the need to review settings one-by-one administratively. Security Advisor also delivers recommendations based on your current settings.
With this release, ArcGIS Online now enforces the use of HTTPS. Security Advisor’s HTTP Check will scan up to 10,000 items within an organization, including Dashboards, Hub Sites, StoryMaps, classic Story Maps, maps, scenes and apps created using Web AppBuilder and Experience Builder, and identify those needing attention. Security Advisor now offers an editor to assist in making HTTPS updates. For more information, see Security Advisor editor for HTTPS updates.
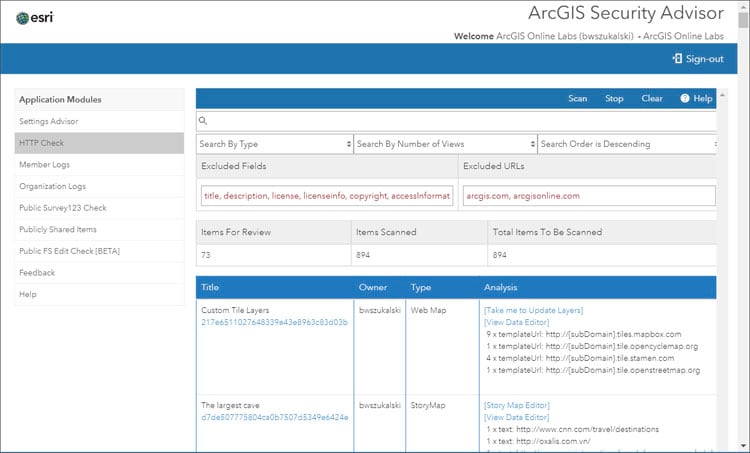
For more information, see the ArcGIS Trust Center, ArcGIS Online Security Advisor, or visit Esri Software Security and Privacy on GeoNet.

Other changes
ArcGIS Online now enforces the use of HTTPS, which ensures that all data is encrypted, improves confidentiality, and secures sensitive data. Any remaining HTTP only URLs are no longer accessible. For more information, see the Technical Support FAQ.
In accordance with Microsoft’s official retirement of Internet Explorer 11 and Edge Legacy, ArcGIS Online no longer supports these browsers. You will not be able to receive support for issues related to Internet Explorer 11 or Microsoft Edge Legacy. We recommend using the latest version of Google Chrome, Mozilla Firefox, Apple Safari, or Microsoft Edge to avoid any issues.

ArcGIS Living Atlas of the World
ArcGIS Living Atlas of the World is the foremost collection of geographic information from around the globe. It includes curated maps, apps, and data layers from Esri and the global GIS user community that support your work. Visit the ArcGIS Living Atlas of the World website where you can browse content, view the blog, and learn how you can contribute. Here’s what’s new, been recently released, or is coming soon.

ArcGIS Living Atlas apps
Content from ArcGIS Living Atlas of the World is used to make valuable apps for visualization and analysis. These apps can be found under the apps tab at the Living Atlas website.
World Imagery Wayback
Wayback imagery is a digital archive of the World Imagery basemap, with more than 100 different versions of the map archived over the last 6 years. The World Imagery Wayback app lets you browse for changes in your area of interest and lets you make a map with versions of interest. Swipe mode is a newly added capability that makes it easy to compare selected imagery.
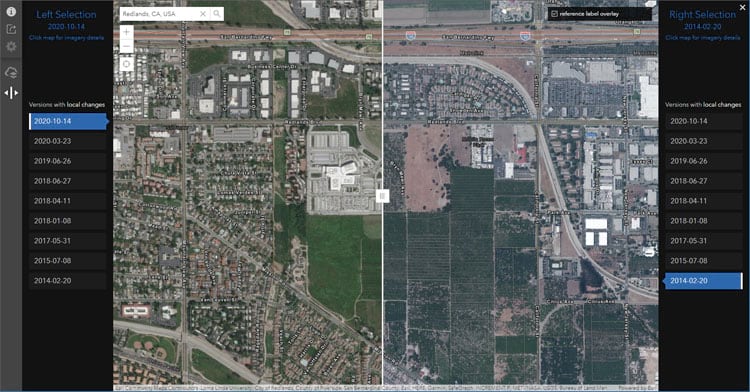
When in swipe mode, you can click share to copy and paste the URL to save the selected imagery and geographic location with others. For example:
- View change over time in Las Vegas, Nevada
- View change over time at Beijing Daxing International Airport
For more information, see Do the Wayback swipe.
CovidPulse
CovidPulse visualizes the rates of COVID-19 cases and deaths in the United States as compact trend lines that are updated daily. CovidPulse shows the trends of the epidemic for all 50 states (including the District of Columbia) and all 3,000+ counties.
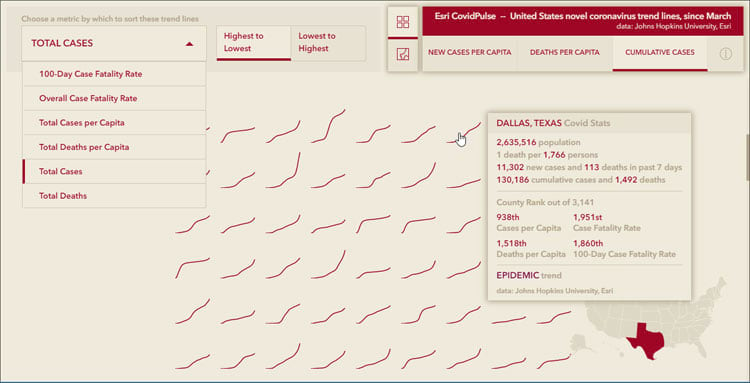
CovidPulse has been updated to include a grid view, providing additional context and value for those looking for local and national trends in the ongoing pandemic. CovidPulse illustrates the local rises and falls of Coronavirus throughout the pandemic via sparkline map symbols at state and local levels, but now it more readily provides a comparative sense of local rates using various grid view options.
For more information, see CovidPulse update: Grid view.

Policy Maps
American Community Survey (ACS) updates
The Living Atlas Policy Maps team maintains a collection of 104 layers containing a wealth of data from U.S. Census Bureau’s American Community Survey (ACS). ACS is an ongoing survey by the U.S. Census Bureau that provides vital information on a yearly basis about our nation and its people.
On December 10, 2020, ACS released the newest data values for their 5-year estimates. Within days of that release, existing Living Atlas ACS layers were updated with the newest 2015-2019 data. Along with the updated layers, a subset of 2010-2014 layers were added to Living Atlas to allow for comparison over time for many ACS topics.
For more information, see What’s new with Census ACS Living Atlas layers (Fall 2020).
New maps based on ACS
A new set of maps has been produced based on ACS data and are available in the Living Atlas as well as Esri Maps for Public Policy.
Where were native persons (US citizens at birth) born relative to current residence?
What year did foreign-born population most commonly naturalize?
Where do Black or African Americans not have an internet subscription at home?
Where are youth who don’t have access to internet?
Where are youth who don’t have access to a computer?
Where are children with a single working mother?
What is the relationship between households without internet or vehicles?
What is the relationship between households without internet or smartphones?
Do Black or African Americans own or rent their housing?
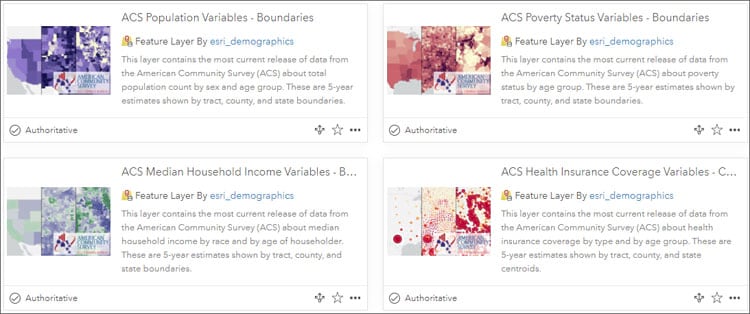
View the entire collection of ACS content in the Current-Year ACS Map and App Examples group, or view all ACS layers in Living Atlas.
Census 2020 self-response rates
Were self-response rates higher for the 2010 or 2020 Census? The layers in this feature layer are updated daily from the Census API to display Census 2020 self-response rates, with a useful set of attributes to explore and utilize.
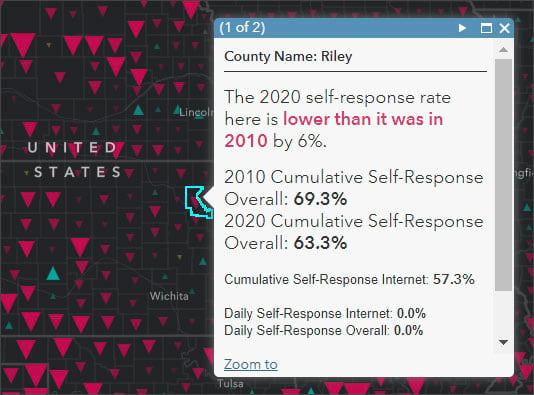
For more information, view the self-response rates item details.
Centers for Disease Control and Prevention (CDC)
The Centers for Disease Control and Prevention (CDC) recently contributed the most recent county-level hospitalization and mortality rates for both heart disease and stroke from the CDC Interactive Atlas of Heart Disease and Stroke to ArcGIS Living Atlas, as well as high blood pressure medication nonadherence rates. High blood pressure is a key risk factor for heart disease. Newly released layers include the following:
- U.S. Heart Disease Mortality Rates, 2016-2018
- U.S. Heart Disease Hospitalization Rates, 2015-2017
- U.S. Stroke Mortality Rates, 2016-2018
- U.S. Stroke Hospitalization Rates, 2015-2017
- U.S. High Blood Pressure Medication Nonadherence Rates, 2017
For more information, see Most recent hospitalization and mortality data for heart disease and stroke now available.
Broadband
Broadband is on the minds of many policy makers and others who need it for work or school. Who has it? How are the speeds? Where are the areas with no access to broadband, or very limited access to it?

A collection of layers and maps in ArcGIS Living Atlas is available to help your maps, dashboards, and apps advocate on behalf of the students, seniors, workers and others who find themselves caught in the “digital divide.” The latest map assigns a broadband score to every county in the U.S. For more information, see the item details.
Other Living Atlas policy maps
Regular updates continue for US unemployment data from the Bureau of Labor Statistics (updated monthly) and COVID-19 layers, maps, and apps (updated daily or weekly).
Esri Maps for Public Policy
Policy maps clearly show where there is an opportunity to intervene. Esri Maps for Public Policy provides instant access to useful maps that illuminate areas where your work can make a difference. Free to the public to view and use, these policy maps give your team a head start understanding the people, organizations and issues in your community.
Use the Policy Maps web app to browse focused, useful maps on specific topics about your community. Use the app to view maps and click Collect to add a map to your collection. Then share your collection of maps with anyone via email or social media, so they see the exact maps you want them to see.

OpenStreetMap
For the past few years, Esri has published an OpenStreetMap Vector Basemap that is available to ArcGIS users and developers. This vector basemap is built by Esri using OpenStreetMap (OSM) data and is updated every few weeks with the latest OSM data edits. OpenStreetMap vector basemaps continue to be updated regularly and are available in a variety of styles.
Esri has recently added to the OpenStreetMap offerings available in ArcGIS Living Atlas. This includes additions to the OpenStreetMap layers group with several new feature layers,such as buildings and roads for Europe and Asia, which completes the global coverage of these OSM layers.
A new OpenStreetMap Daylight map (beta) is now available, based on the latest version of Facebook’s Daylight Map Distribution that includes enhancements to the OSM data made in collaboration with Facebook and Microsoft.

Explore the map using the OpenStreetMap Daylight app, or visit the OpenStreetMap Daylight group. For additional details, see Dawn of OSM Daylight in ArcGIS.

Imagery
World Imagery content is continually updated, with many improvements and enhancements. In 2020, more than 1,200 metropolitan areas were updated with 30cm resolution Maxar imagery. Many additional areas were updated with high resolution imagery through the Community Maps Program. Check the World Imagery Publication Summary app for recent or pending updates for your location of interest.

Three new VIIRS imagery layers, featuring imagery captured daily by the NOAA-20 satellite, will soon be available. For more details, see all of the MODIS and VIIRS layers available in Living Atlas. The layers are the result of collaboration with NASA’s Global Imagery Browse Services (GIBS) team.
The Arctic Imagery basemap will be updated to include TerraColor NextGen Imagery, along with a new black background styling.

World elevation
Living Atlas provides foundation elevation layers and tools to support analysis and visualization across the ArcGIS platform. These layers are updated quarterly with high-resolution elevation data from various sources and the Community Maps Program.

World Hillshade tiled layers (World Hillshade, World Hillshade (Dark)) and elevation tiled layers (Terrain 3D and TopoBathy 3D) have been enhanced with Natural Resources Canada’s HRDEM 1 m, Värnamo Kommun’s (Sweden) 0.5 m, and IGN Spain 2m resolution data. TopoBathy 3D was updated with GEBCO_2019 15 arc sec (~ 464 meters) global dataset, which enhanced the bathymetry resolution 2x for oceans.
To see the coverage extents of each source comprising World Elevation services, check out the Elevation coverage map.

Environment
NOAA Storm Events
NOAA Storm Events Database 1950-2019 is a new feature layer of all severe weather reported to the National Weather Service for the United States from 1950-2019. The storm reports are aggregated and archived by NOAA’s National Centers for Environmental Information. With over 1.5 million records over 70 years, the Storm Events Database is the most comprehensive, official record of severe weather in the U.S.

Standardized Precipitation Index (SPI)
Standardized Precipitation Index (SPI) and Standardized Precipitation Index (SPI) 1981 – Present are new layers which are used to characterize meteorological droughts. The Standardized Precipitation Index estimates the deviation of precipitation from the long-term probability function at different temporal periods, such as 1, 3, 6, 9, and 12 months. Both of these layers are calculated from Climate Hazards Center InfraRed Precipitation with Station (CHIRPS) data from the Department of Interior, and provide users with the most current condition or a time series of past years, going back to 1981.
USA Fire Burned Areas
USA Fire Burned Areas 1984 – 2018 is a new layer sourced from the Monitoring Trends in Burn Severity (MTBS) program that displays unplanned wildfires, intentionally ignited prescribed fires, and wildland use fires, which are naturally ignited to accomplish a specific management objective.

In addition to showing the impacted area of the fire, this layer also provides information about when the fire started and the cause, going all the way back to 1984. Since this layer is a time series, users can view a time progression by enabling time animation on the map. This archive is a joint effort from the United States Geological Survey (USGS) and U.S. Forest Service.
Other environment
Updated symbology on the GEOGloWS ECMWF Streamflow System (6 Day Forecast) layer makes the stream reaches with higher than normal streamflow stand-out and get the attention they deserve against a dark or light base map. This layer has the ability to animate, so you can visualize the movement of high flows down the stream network which is not only interesting, but also quite effective for flood preparedness planning across the world.
Live Stream Gauges move to a hosted feature layer, and now include gauges from the United Kingdom, Canada, and Brazil. Older map services (Live Stream Gauges, Live Stream Gauges (Flooding), Live Stream Gauges (Feature Service) will be deprecated, and the new feature layer should be used instead.
A new Hawaii Land Cover Imagery Layer, created from the NOAA Office for Coastal Management Coastal Change Analysis Program (CCAP), has been added. The layer displays 2.4m cell size land cover data covering the major islands of the State of Hawaii. Landcover classes include vegetation type, development density, agricultural use, and areas of barren lands and water are also included. This layer will be featured in an upcoming Learn ArcGIS Lesson.
USA Flood Hazard Areas layer is updated using the August 31, 2020, version of FEMA’s Flood Insurance Rate Maps. The imagery layer, hosted feature layer, and hosted tile layer have all been updated with the most current information from FEMA.
The National Land Cover Database (NLCD) layer has been updated using 2016 data. The USA NLCD Tree Canopy Cover Imagery layer updates can be seen across the United States, while the USA NLCD Land Cover Imagery layer only has updates in Alaska and Hawaii.

Basemaps
Esri basemaps are updated regularly with data from commercial, open, and community sources. All vector basemaps have been updated using data from Here, SafeGraph Places, and content contributed to the Community Maps Program. Esri Vector Basemaps and OpenStreetMap basemap are updated on a regular basis, typically every three weeks.

Community Maps
The Community Maps Program enables community contributions of authoritative data to help build the ArcGIS Living Atlas. You can provide feedback, create detailed features, and share data layers and services, contributing to Esri basemaps that anyone can use.

The Community Maps Editor lets you edit parts of the Esri Community Maps basemap to add detailed features for universities, schools, parks, landmarks, and other special areas of interest. The editor has been updated with new features and capabilities. For more information, see Community Maps editor updated.
Community Maps Data Prep Tools version 4.0 is now available. Read about what’s new and view three instructional videos that will help you incorporate the Data Prep Tools into your basemap layer preparation workflow for submission to the Community Maps Program. For more information, see Contributing to Community Maps just got easier.

ArcGIS StoryMaps
ArcGIS StoryMaps make it easy to create inspiring, immersive stories by combining text, interactive maps, and other multimedia content. Publish and share your story with your organization, or with everyone around the world.

The storytelling capabilities of ArcGIS StoryMaps continue to evolve with improvements to enhance your experience when telling stories with maps. The following new features and capabilities have been recently added.
Work more easily with your colleagues using the latest collaboration features. You can now publish stories and collections to shared update groups, publish changes as a co-author, and browse content by groups. For more information about how to collaborate on stories, see Optimize group settings to share stories like never before.
Express maps have taken a big leap forward. Features in express maps can be styled individually and arranged into any groupings that make sense for your story (for example, restaurant categories, business industries, building type). To create unique and effective maps, you can also upload your own icons to use as point symbols.
Building guided or explorer map tours is faster than ever. You can upload photos for up to 100 places at once, and geotagged photos are located on the map, letting you create a tour in minutes.
You can also add sidecar and credits headings as story navigation links to better organize your story, use the new large paragraph style to bring attention to text passages without sacrificing accessibility, and customize themes with new separator styles to make your story stand out among the rest.
Other new features
- Easily jump to different sidecar slides with a new way of navigating.
- Find the perfect color for your story theme elements and express map features using an improved color picker.
- Make map exploration fun with text-driven map actions that change the map when readers click on a specific word or group of words.
For more information about these and other improvements, see What’s new in ArcGIS StoryMaps (October 2020) and What’s new in ArcGIS StoryMaps (November 2020), or visit ArcGIS StoryMaps. To learn about the latest updates, see What’s new in ArcGIS StoryMaps (December 2020).

ArcGIS Urban
ArcGIS Urban enables the digital transformation of city and regional planning to encourage collaboration with community stakeholders and help all groups work toward a more sustainable future.

The latest release of ArcGIS Urban adds full support for 3D meshes. Use a 3D mesh layer as a realistic representation of your existing buildings including draping of polygon layers and masking. If you want to develop a parcel, mask out the existing buildings from the mesh and replace them with your new development project.
Enrich your project scenario with BIM data and use the building explorer widget to filter by discipline, categories, or explore it one floor at a time.
The Urban API (beta) provides an interface for software developers that brings the capabilities of Urban to third-party applications such as permitting systems, and vice-versa.
The parcel exploration capability in the public overview allows every member of the public to click on parcels and see the development capacity based on the current zoning, allowed setbacks, and more. This empowers your citizens to understand the zoning and development potential in your city.
The latest release also adds support for ArcGIS Hub Premium and the community user name capability. This allows anyone outside of your organization, such as citizens, developers, and architects, to create a new project and start sketching out development scenarios.
For more information, see What’s New in ArcGIS Urban.

ArcGIS Hub
ArcGIS Hub is a cloud-based engagement platform that helps organizations work more effectively with their communities. It is available at two license levels: Basic and Premium. ArcGIS Hub Basic is included with ArcGIS Online and delivers data sharing and site creation capabilities.
ArcGIS Hub Premium includes additional features for deeper level engagement working with teams of people, including members of the community at-large. With Hub Premium you can share events, create supporting teams and initiatives, and use the template builder to create templates of your sites, apps, and other content. Together you and your team can collaborate and build a portfolio that includes data, web maps, surveys, events, and other content, for reaching internal and public audiences.
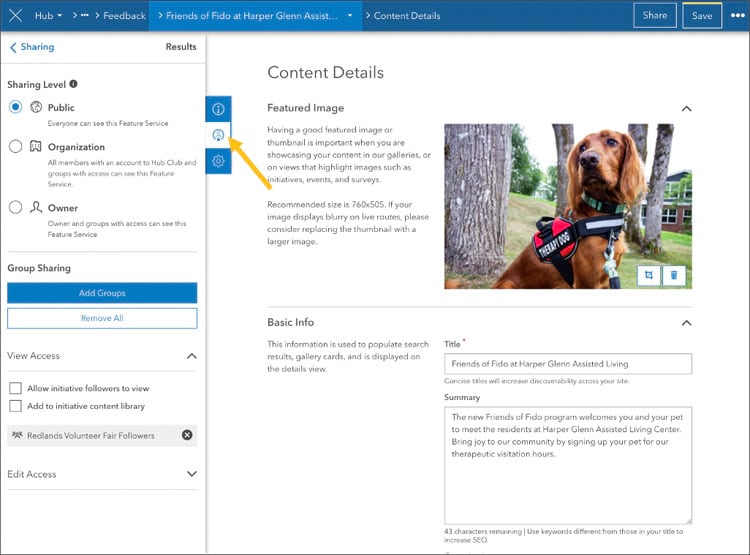
The following new features and enhancements were released between September and December of this year:
Setting up and sharing surveys in ArcGIS Hub is now a lot easier. Hub’s sharing controls have been integrated directly into the embedded ArcGIS Survey123 experience, so all the tools you need to set up and share your survey are now all in one place. New side panel options let you configure open or close dates, submission editing, multiple submissions, and result privacy.
Creating a color theme is easier. Anytime you decide to set a custom appearance for a layout card the published theme colors are within quick reach. This eliminates the need to bounce back-and-forth between the theme panel and the card editor, or remembering HEX codes. Simply select one of your existing theme colors in Row Settings to customize the background color or text color for a certain section of a site or page.
Add the new People card to your site to highlight the individuals making your initiative a success, or try out one of the two new FAQ page templates to provide answers to common questions or to communicate important information about how your organization uses community accounts.
Use the new Row Visibility tool to designate certain sections of your site as private. Row Visibility lets you control which rows of content appear for different audiences and groups who visit your sites.
For more information, see What’s new in ArcGIS Hub (December 2020).
To get started with ArcGIS Hub, visit the ArcGIS Hub resources site for links to blogs, lessons, videos, webinars and more. You can also find inspiration and see recent examples of ArcGIS Hub sites in the Hub gallery.

ArcGIS Velocity
ArcGIS Velocity provides configurable capabilities to connect to and visualize streaming sensor data, detect incidents, analyze patterns, and take action. You can put together powerful out-of-the-box analysis tools to create automated workflows without any development or scripting knowledge required, and run analysis in real-time, in near real-time, or over time.
ArcGIS Velocity is licensed as an additional subscription to ArcGIS Online. For additional product information, see What is ArcGIS Velocity.
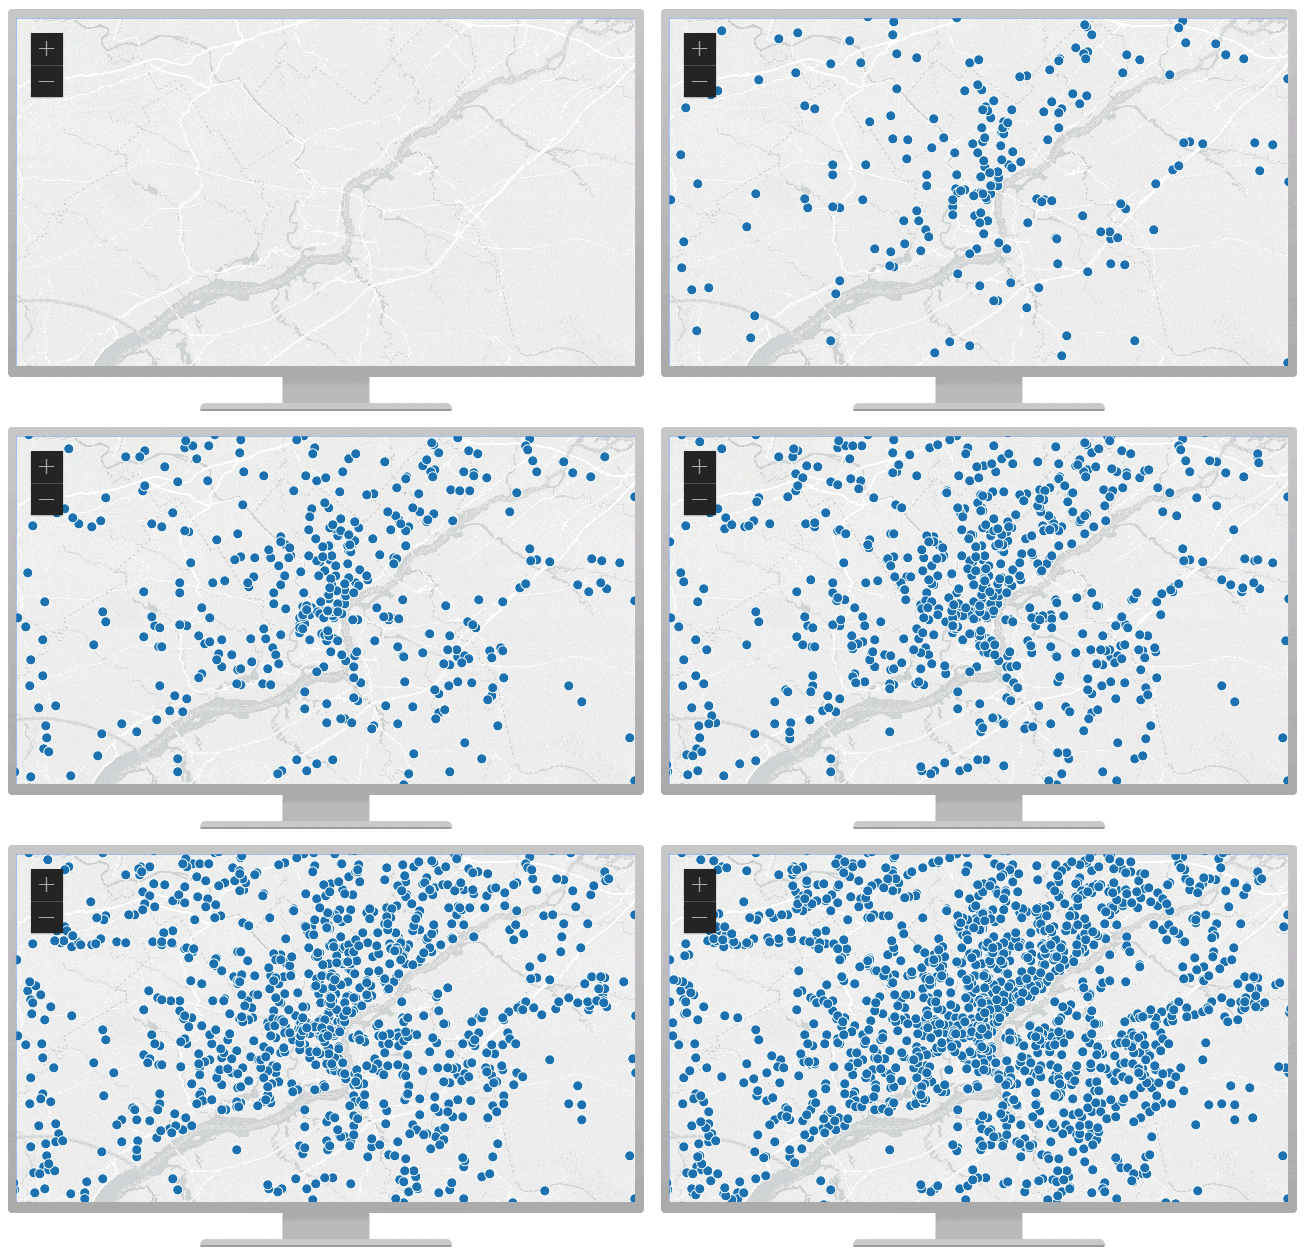
The December 2020 release of ArcGIS Velocity contains new features and enhancements including:
- Real-time analytics now support stateful processing and analysis.
- New real-time analytics tools and capabilities include Calculate Motion Statistics, Detect Incidents, and enter/exit geofencing in Filter by Geometry and Join Features.
- Join Features now supports 1-to-many joins in real-time analytics, meaning a separate event or incident can be emitted for any geofence to which a real-time observation joins.
- Feature layers hosted in ArcGIS Velocity now support ownership-based access and control, including editing operations.
- The Kafka feed type now supports SASL PLAIN authentication.
- Feature JSON and GeoJSON are now supported formats for many output types including Azure IoT Hub, Azure Blob Store, and Amazon S3.
- Many improvements have been made to logging and metrics for feeds and analytics so users can better understand data processing status.
To learn more, see Get started with ArcGIS Velocity Learn ArcGIS path and ArcGIS Velocity blogs. For more information on the latest release, see What’s new in ArcGIS Velocity.

SiteScan for ArcGIS
Site Scan for ArcGIS is a new Esri product that provides a complete, end-to-end workflow for acquiring and processing drone imagery, working with the resulting data products, and managing your drone assets. Site Scan allows users to capture, process, and manage their drone data in the cloud and publish their 2D, 2.5D, and 3D outputs directly to ArcGIS Online.
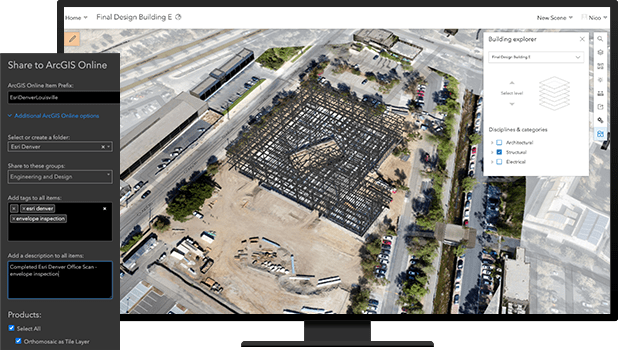
New integration with QuickCapture lets users easily identify areas of interest and record locations as points, lines or polygons, along with associated attributes, with the tap of a button. The results can be instantly transmitted to others via ArcGIS Online or ArcGIS Enterprise.
For more information, see, Site Scan for ArcGIS overview and Site Scan for ArcGIS update.

ArcGIS Solutions
ArcGIS Solutions is a collection of focused maps and apps that helps address challenges in your organization. They leverage your authoritative data and are designed to improve operations, gain new insight, and enhance services in government, utility, defense, public safety, intelligence, and commercial business.
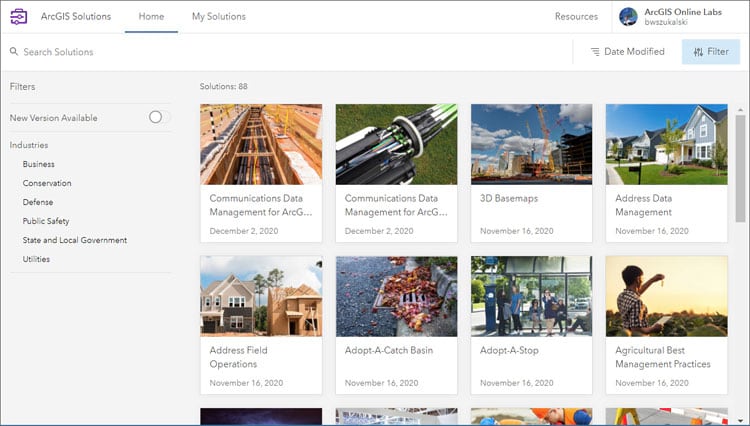
New ArcGIS Solutions product experience
In November, the ArcGIS solutions team launched a new solutions experience that includes an updated ArcGIS Solutions product destination and improved documentation. The new experience helps public agencies, utilities, and private businesses discover industry-specific configurations of ArcGIS that improve operations, drive new insight, and enhance services.
To learn more, see New ArcGIS Solutions product experience launched.
New solutions available in the solutions app
In the November 2020 release, the ArcGIS Solutions team doubled the number of solutions available in the ArcGIS Solutions app. Included are several new ArcGIS Solutions that help you manage utility assets, improve police transparency, conduct community health assessments, and manage threats that impact business operations.
For more information, see What’s new in ArcGIS Solutions.

App builders
App builders let you easily create custom apps, no coding required. App builders have been updated with the following enhancements.
ArcGIS AppStudio
ArcGIS AppStudio lets you turn your maps into beautiful, consumer-friendly mobile apps ready for Android, iOS, Windows, macOS, and Linux. Share your apps with members of your organization using AppStudio Player, or publish them to all popular app stores. With AppStudio, organizations on the ArcGIS platform can now build cross-platform native apps easily.
New in the 4.4. release:
- Attachment Viewer is a new template which works with your Attachment Viewer web apps to create native app equivalents.
- On the desktop, it is now possible for a user to sign in to AppStudio with one organizational account to get an AppStudio Developer Edition license, and then sign into another organization to create and share apps.
- AppStudio apps on Windows can now install a newer version without first uninstalling an older version.
- The AppFramework has improved handling of CSV files, video, and translated text.
Download AppStudio or to learn more, see Whats new in AppStudio, visit the AppStudio Community, or view the Whats new in AppStudio video.
ArcGIS Experience Builder
ArcGIS Experience Builder empowers you to quickly transform your data into compelling web experiences for a variety of audiences, across browsers and all devices, with no coding required. Experience Builder provides complete control over the layout and design elements, supporting both mapcentric and nonmapcentric apps via fixed or scrolling screen, on single or multiple pages. Provided templates and widgets help you get started quickly, and can be extended with your own.
New in the latest release:
- When publishing a template with widgets that use subscriber content, you have the option to authorize content so it can be accessed anonymously.
- You can now preview surveys that you edit in the embedded designer.
For more information, see What’s new in Experience Builder.
ArcGIS Web AppBuilder
ArcGIS Web AppBuilder delivers a way for you to easily create web apps that run on any device, using a gallery of ready-to-use-widgets. You can customize the look of your apps with configurable themes and can host your apps online or on your own server.
Multiple widgets and capabilities have recently been improved:
- Add Data now supports adding WMTS OGC web services.
- Parcel Draft lets users edit and close unclosed parcel boundaries.
- Gridded Reference Graphic now supports UTM as a reference system option.
- With Smart Editor, you can choose Military Grid Reference System (MGRS) when moving point features to a new location using coordinates.
For more information, see What’s new in ArcGIS Web AppBuilder.

Apps for field operations
ArcGIS apps for field operations help you use the power of location to improve coordination and achieve operational efficiencies in field workforce activities. Reduce or even replace reliance on paper and ensure that both fieldworkers and office staff use the same authoritative data to reduce errors, boost productivity, and save money.
ArcGIS Workforce
ArcGIS Workforce is a mobile app solution that uses the power of location to plan and coordinate your field workforce. It integrates work management to reduce reliance on paper and provides everyone with access to the authoritative data they need. ArcGIS Workforce is designed to help you reduce errors, boost productivity, and save money.
The latest release of the Workforce web app allows you to integrate ArcGIS Field Maps into your Workforce project. Add Field Maps integration so your team can easily search for features, collect data at assignments, and communicate important information using the markup tools provided in the app.
ArcGIS Field Maps
ArcGIS Field Maps is a new mobile app solution that allows you to streamline field workflows and take maps anywhere. You can use Field Maps to explore the maps you make in ArcGIS, collect and update your authoritative data, and record where you’ve gone, all within a single location-aware app. Field Maps includes a companion web app that allows you to configure the maps mobile workers use in the field.
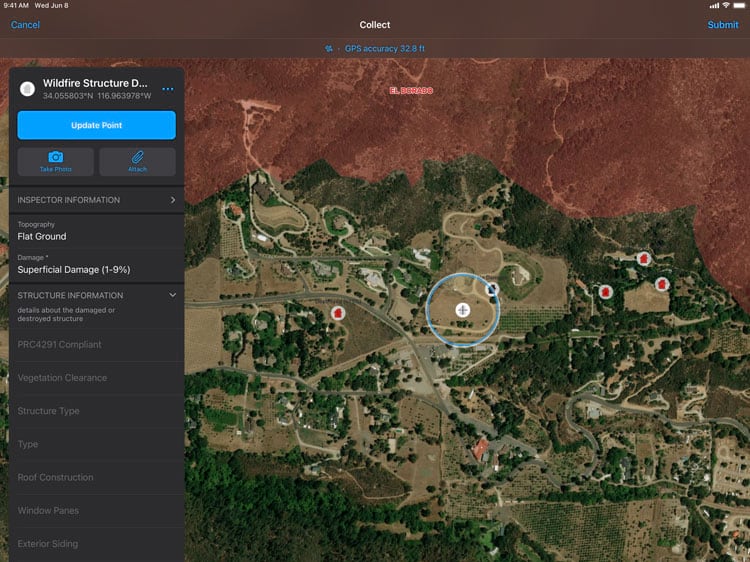
ArcGIS Field Maps Mobile App
The latest release of Field Maps mobile app streamlines field workflows by bringing together the following capabilities into one app:
- Simple map viewing and markup
- High accuracy field data collection and inspection
- New smart form capabilities
- Battery-optimized location tracking
- Start tracking for a specific duration
- Start and stop tracking from a link, Google Assistant, or the companion Apple Watch app
- Dark Mode support on iOS
ArcGIS Field Maps Web app
The initial release of Field Maps web app simplifies the configuration and deployment of maps with the following capabilities:
- Author smart forms for data collection
- Enable web maps for offline use
- Manage feature templates
- Configure sharing settings
- Hide maps from the Field Maps mobile app
For more information, see What’s New in Field Maps.
ArcGIS Survey123
ArcGIS Survey123 is a simple and intuitive form-centric data gathering solution that makes creating, sharing, and analyzing surveys possible in just three easy steps.
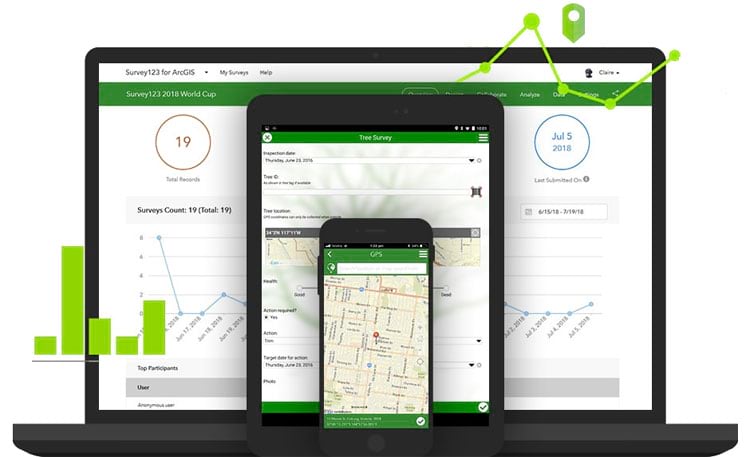
In version 3.11 web accessibility compliance with improved keyboard navigation and compatibility with screen readers has been improved. The Analyze page of the Survey123 website provides additional methods to display number questions, set custom number ranges and custom scoring for ranking questions. Ranking questions and choice randomization are available in both the web and field app, and choice lists in the field app can be loaded from CSV files.
Also included is a new quick reference for Survey123 report creation is now available, providing useful examples that use the questions of your own survey. See report templates to learn about the expanded syntax of report creation now available.
Download Survey123 or to learn more, see Whats new in Survey123 and visit the Survey123 Community.
ArcGIS QuickCapture
ArcGIS QuickCapture is the fastest way to collect field observations. With this app, you can quickly record field observations from vehicles, conduct aerial surveys, or assess damage. Data can be sent back to the office for analysis in real time, eliminating time spent manually processing handwritten notes. ArcGIS QuickCapture is integrated with ArcGIS, so new data from the field can be used instantly for better decision-making.
New in version 1.8:
- Project user input choices now include an option to enter free text.
- Button label text can be configured.
- More device variables can be captured with photos enabling oriented imagery workflows.
- Stability and performance improvements have been made that enhance the camera, data capture, data upload, and map display capabilities.
- QuickCapture templates now include additional ArcGIS items such as dashboards that present the results of the project.
Download QuickCapture or to learn more, see Whats new in QuickCapture (December 2020) and visit the QuickCapture Community.

ArcGIS Maps for Adobe Creative Cloud
ArcGIS Maps for Adobe Creative Cloud, an extension for Adobe Illustrator and Adobe Photoshop that enables map-makers to develop exciting narratives using data-driven maps. Use the power of ArcGIS to discover and add geographic content to design projects as editable vector layers and high resolution images.
The extension is included with ArcGIS Creator or GIS Professional license and should be downloaded and installed separately. With this extension GIS professionals and graphic artists can work with maps and layers from ArcGIS Online and ArcGIS Pro inside their familiar design tools.
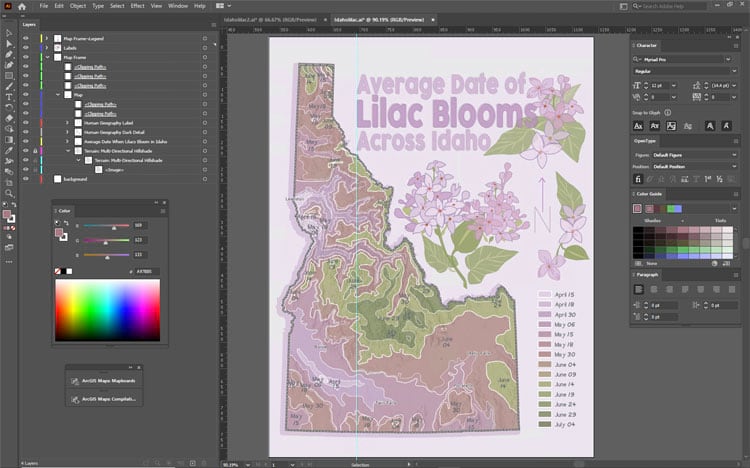
The latest release adds a new workflow for adding more spatially aligned content to the maps and layouts that you export to Adobe Illustrator Exchange (AIX) files from ArcGIS Pro 2.6 or later. When you use the extension to open an .aix file in Illustrator, the file is converted to an Illustrator document with organized layers,. In addition, the map extents are now added to the mapboards window. This new geospatial capability allows you to find and compile more relevant content that you can add to your map designs in the Illustrator document.
For more information, see How to make maps in ArcGIS Pro and Adobe Illustrator.

ArcGIS GeoPlanner
ArcGIS GeoPlanner is a web-based planning and design tool that empowers you to iteratively analyze, design, and evaluate multi-scale scenarios in a collaborative environment. GeoPlanner gives you a way to measure the impact of your design using key performance indicators (KPIs). Using ArcGIS GeoPlanner you can:
- Run spatial analysis on-the-fly, compare scenarios, and share data-informed plans using real-time dashboards.
- Design and test iterative scenarios with professional planning tools, and invite other planners to collaborate.
- Use built-in metrics and dashboards to measure scenario impact.
- Access and incorporate global, authoritative data from ArcGIS for contextual analysis.
- Showcase results that are data-informed, visually impactful, and interactive in 2D and 3D.
- Share plans with stakeholders and the community at meetings or charrettes.
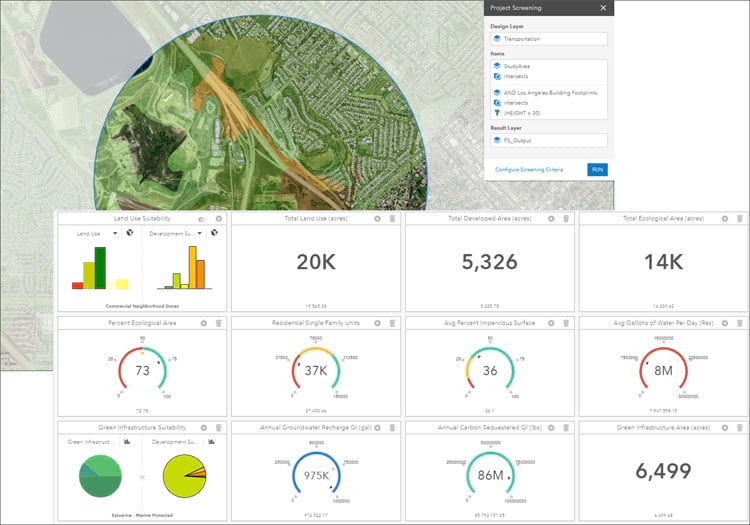
The latest version of GeoPlanner 3.0 comes equipped with new capabilities to support use cases around landscape and natural systems planning, as well as urban and land use planning.
To increase the utility of of data layers to better contextualize your design, baseline indicators and baseline modifier values have been implemented allowing you use data layers to report and modify metrics on a dashboard.
You can now export dashboard items as a graphics file (.jpg, .png, .webp). This feature is useful for including data metrics from your dashboard into a slide show or text document. You can also reorder layers in the table of contents by dragging them to the desired position.
The Project Screening tool allows you to make smart decisions with your data by analyzing spatial relationships between data layers, design layers, and study areas. This allows you to create queries that define spatial relationships given your specific requirements – such as identifying where your design features intersect with constraining environmental conditions or hazards.
For more information, see the ArcGIS GeoPlanner documentation.

Esri Redistricting
Esri Redistricting is a web-based software that enables governments, advocates, and citizens to complete and share regulation-compliant redistricting plans. Based on Esri’s proven ArcGIS software and dataset components, Esri Redistricting provides comprehensive tools for plan creation, management, visualization, editing, and collaboration.
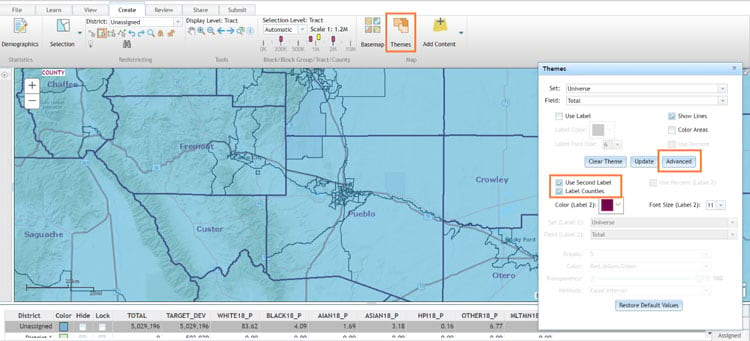
The recent release of Esri Redistricting provides the following updated functionality:
- Label counties in the area you are working within the application.
- Customize the homepage of the application to match your organization’s needs.
- Merge multiple regional plans into a statewide plan, ensuring no geographies are assigned to multiple districts.
For more information, see What’s new in Esri Redistricting (December 2020).

ArcGIS for Power BI
Unlock the power of location in your business intelligence with ArcGIS Maps for Power BI. You can create beautiful map visualizations that surface patterns and trends in your data and gain context with ArcGIS maps and demographic data.
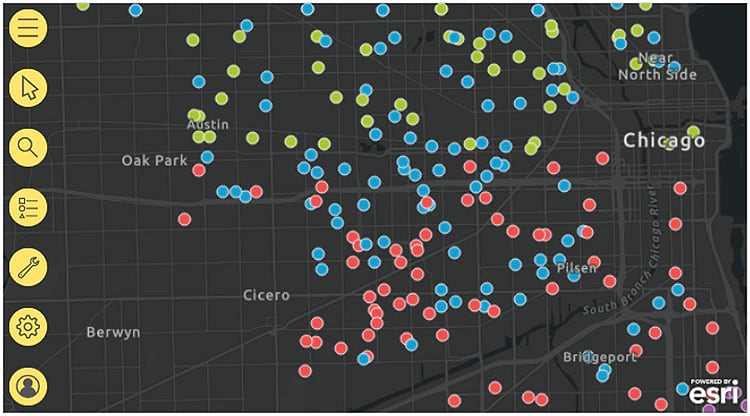
ArcGIS for Power BI is updated regularly to provide new features, improved speed, better usability, and quality fixes. Here are highlights for the 2020.4 update for December, 2020 (coming soon):
- Report designers and consumers no longer require an add-on license to create and interact with ArcGIS for Power BI map visualizations.
- Designers using an ArcGIS account can embed a map-enabled report in a website or app.
- Designers using an ArcGIS account can publish to the web.
- Join a reference layer to an attribute to enable interactions between the reference layer and other visualizations.
- Power BI Report Server is supported when signed in to a valid ArcGIS Enterprise account, in online environments only.
- Report consumers can change the basemap on a map-enabled report (if enabled by the map designer).
- Improvements to intelligent defaults generate better maps out of the box.
For more information, see the ArcGIS for Power BI product documentation.

More information
For more information and additional details about this release, see the What’s new help topic or view all posts related to this release.

Commenting is no longer enabled for this article