As of May 22, more than 20 fissures have opened in Puna District, Hawaii Island, spewing magma and poisonous gas. Hundreds of residents have been evacuated, and more may be forced leave their homes.
As the lava advances toward homes and families, a critical question becomes which way the lava coming from these fissures will flow. Do these flows have the potential to cut off access to the easternmost part of the island? How many people will they affect?
Michael Dangermond answered some of these questions in his blog, Which Way Will the Lava Flow. Using the Hydrology Analysis tools and Esri Demographics, we can recreate his analysis.
NOTE: As of 2019, demographics may have changed, and your results may no longer match. For a similar workflow, try the Learn ArcGIS lesson Analyze Volcano Shelter Access in Hawaii.
Step 1- Add lava data
First, we need to know where the lava is originating from. This data is available from Open Street Map, where someone has been adding fissures to the map in almost real-time. Because the fissures are constantly changing, we’ve provided a dataset digitized from Open Street Map on May 18, 2018 for consistent results. Updated information is being tracked in this app by Hawaii County.
- Sign into an ArcGIS Online organizational account and click Map.
Note: If you don’t have access to an ArcGIS organizational account, get a free ArcGIS trial.
- On the ribbon, click Add and choose Search for Layers.
- Click My Content and choose ArcGIS Online, then search for Kilauea_Fissures_2018.
- On the Kileauea_Fissures_2018 card, click the plus button to add the content to your map.

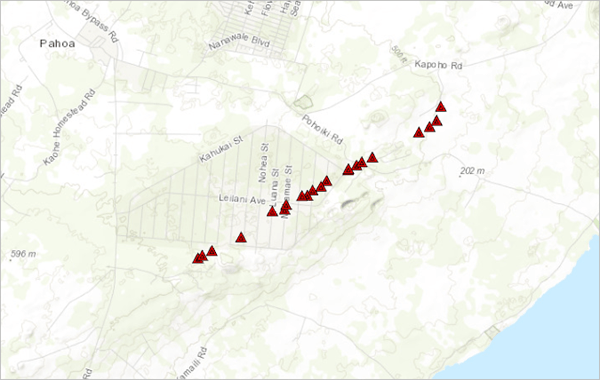
The Map Viewer centers on the fissure layer, which is along the southeastern coast of Hawaii’s Big Island. These volcanic vents have already covered hundreds of acres of land, including neighborhoods in Leilani Estates and Lanipuna Gardens.
Step 2- Trace the lava’s path
Lava, like water, tends to flow downhill via the path of least resistance. Because of this, we can use the Hydrology Analysis tools to predict its behavior.
- On the ribbon, click the Analysis tab and expand Find Locations. Click Trace Downstream
This tool determines downhill flow path from a set of input points.
- For Point Features used as the starting locations for each downstream trace, make sure Kilauea_Fissures_2018 is selected. Name the result Fissures Flow Path and add your initials to make the layer unique in your organization.
- Uncheck Use current map extent and click Run Analysis.

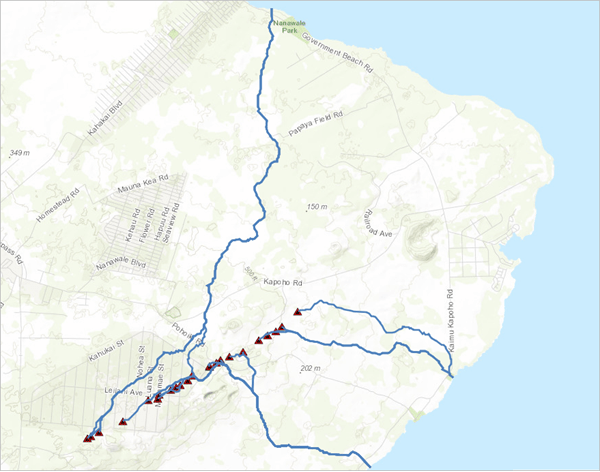
The Trace Downstream tool drew possible lava flow routes to the north, east, and southeast of the vents. Based on these routes, the lava has the potential to cut off a portion of Puna district. A lava flow through this residential area could be devastating to the community.
Step 3- Find how many people will be affected
Many residents have already been evacuated, but their homes and livelihoods still stand in the path of the lava. Using the perimeter of the lava flow areas you calculated, you’ll use demographics to find how many people could be affected. Additionally, because Hawaii’s a big tourist destination, you’ll check housing units to see how many may be occupied by visitors.
- On the ribbon, click Add and choose Add Map Notes.
The Add Features pane opens with different types of notes you can create.
- On the Add Features pane under Affected Population- Areas, choose Area.
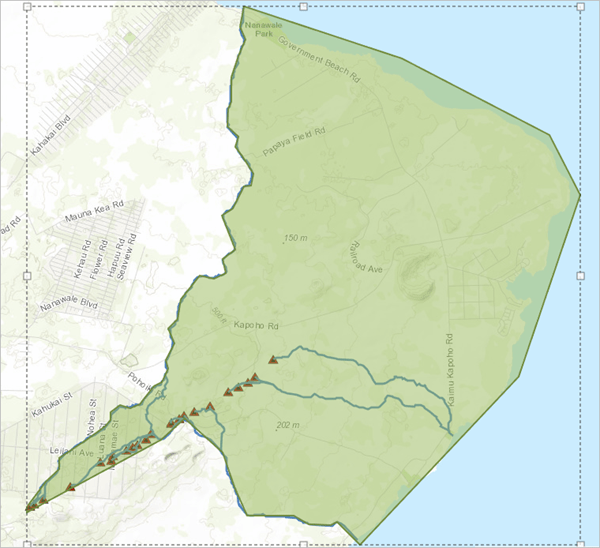
- Draw a polygon that roughly follows the downstream path and the coastline and double-click to close the shape.
- In the Areas popup, name the polygon Possible Flow 2018 and click Close.

Now that you have the area, you can calculate demographics for it.
5. On the ribbon, click the Analysis tab and expand Data Enrichment. Choose Enrich Layer.
6. In the Enrich Layer pane, make sure the Affected Population layer is selected for Choose layer to enrich with new data.
7. Click Select Variables. In the Data Browser, click Population and choose 2017 Total Population (Esri).
The variable will be added to the cart in the top right corner.
8. Click the back button and choose Housing from the Data Browser.
9. Select 2017 Total Housing Units (Esri) and 2017 Vacant Housing Units (Esri) and click Apply, then click Run Analysis.
The enriched polygon is added to the map.
10. In the Contents pane, hover over Enriched Affected Population (Areas) and click Show Table.
11. Scroll right until you see the demographics.
Based on the analysis, it looks like this region of Puna has a total population of about 1,650 people. Out of 1,025 housing units, more than 250 are considered vacant, which means that a few hundred more tourists may need to be evacuated along with residents.
To see where evacuees might go, follow up this analysis with Analyze Volcano Shelter Access in Hawaii, a Learn lesson that explores possible shelters for the people living in the shadow of Kilauea. Or learn more about what previous eruptions have covered in Get Started with Map Viewer.

Commenting is not enabled for this article.