As an ArcGIS Online administrator, one of your primary responsibilities is monitoring and managing credit consumption in your organization. Credits are the currency of ArcGIS. They are consumed for specific transactions and various types of storage, including feature storage, imagery storage, and file storage.
Storage credits are consumed when organization members create and store content items such as maps, apps, scenes, and layers. If your organization’s storage credit consumption is higher than you and other stakeholders would like, you may be looking for ways to reduce it.
Well, look no further. This article outlines practical strategies for managing storage credits in your organization. You will also learn how ArcGIS Online calculates storage credits and how to identify and manage the content items that are incurring the highest storage credit costs.

Understanding storage rates
Before getting into strategies to reduce storage credit costs, it’s important to understand how storage credits are calculated. Credit costs for storage are based on the total size of items, including features, files, 3D tiles, scenes, and vector tiles, or the size and item count for images stored in ArcGIS Online. Costs are calculated each hour and credits are charged hourly on a prorated basis. This handy table provides a breakdown of credit costs by capability. Storage credit information is provided in the first three rows of the table.

The table lists the number of credits consumed for each unit of storage per month. ArcGIS Online calculates this number hourly to reflect new content items created in the organization. For example, feature storage, which corresponds to the storage of hosted feature layers, costs 2.4 credits per 10 MB of feature data stored per month, calculated hourly. Imagery storage and storage of other types of content have their own associated credit costs, as shown in the table.
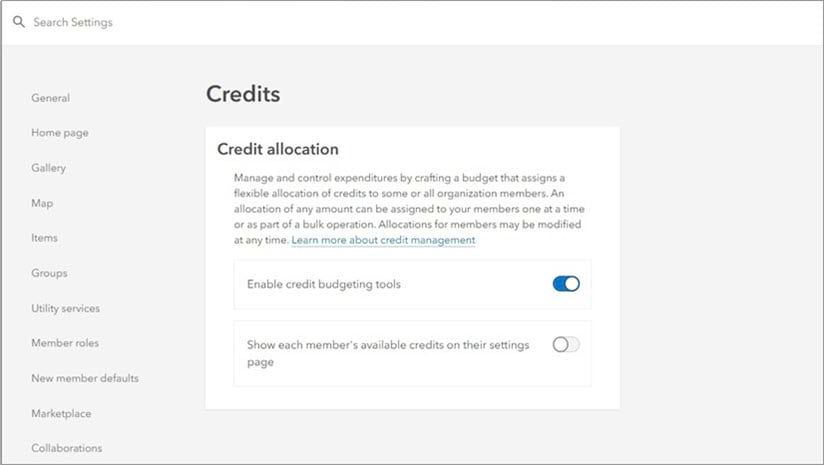
How many storage credits is my organization using?
ArcGIS Online administrators can see a quick breakdown of storage usage at the organization level by exploring the status dashboard and exporting usage details to a CSV file.
After signing in to your organization, go to Organization > Status > Dashboard and specify the usage period you are interested in.
The Credits tab is displayed by default. In this sample organization, the bar chart shows that storage accounts for nearly all credit usage in the past year:

Now scroll down the page to see the Credit Utilization Chart. This chart shows how many credits were used for storage (2,167.51 in the sample organization) in the past year:

You can interact with the chart to see a breakdown of storage credit usage by type of storage (feature, scene, file, and so on). In this sample organization, feature storage accounts for almost all storage credits incurred.

You can now export storage usage details to a CSV file by clicking the Export Usage Data button.

Open the CSV file to see credit usage information broken down by type of storage for the timeframe you specified. The file also includes credit usage data for any analytics, subscriber content, and published content from that timeframe.

Tip: Another way to see a breakdown of storage costs by week, month, or quarter is by creating a credit report. To learn how to create a credit report, check out this blog article or watch this short video.
What items have the highest storage credit costs?
You now know that storing features (in the form of hosted feature layers) in ArcGIS Online costs significantly more than storing other types of content. You also know that feature storage costs are based on the size of hosted feature layers. Therefore, if the goal is to reduce storage credit costs in your organization, a good place to start is identifying the largest hosted feature layer items in the organization. The best way to do this is by creating an item report.
After signing in to your organization, go to Organization > Settings > Status > Reports.

From there, you can easily generate an item report. For detailed instructions on creating an item report, review this blog article.
The following image shows an item report generated and downloaded as a CSV file from the sample organization:

The report provides information about each item in the organization, such as item ID, item type, date created, owner, and storage credit usage. You can sort and filter the report to more easily see the information you want to focus on. In this case, you want to see a list of hosted feature layers in order of size.
First filter the Item Type column to show only Feature Service items.

Now use the Is Hosted Service column to filter out feature services that are not hosted feature layers.

The report now shows only the hosted feature layer items in your organization. The next step is to sort the report using the Feature Storage Size column to show hosted feature layer items in order of size from largest to smallest. Size is reported in megabytes (MB).
Note: The Feature Storage Size column reflects the size of each hosted feature layer itself, but does not include attachments in the hosted feature layer. Size information for hosted feature layer attachments is included in the File Storage Size column. If you want to look at both types of storage at once, you can sort the report based on both columns.

In this organization, the first two hosted feature layers listed are especially interesting as their size is significantly larger than that of the other items. But for a more complete picture, it’s worth looking at the other items as well.
What can I do about large items?
Once you have identified the items that are largest in terms of storage size, consider the following strategies to help you reduce storage credit expenditures.
Identify and remove unused items
An easy way to reduce storage credit costs is to identify and remove unused items, with a focus on hosted feature layers that consume a higher number of storage credits as compared to other content types.
If you go back to the filtered and sorted item report from the previous section, you’ll notice that the two largest hosted feature layer items have the same owner, Sparkle_Ungar.

One approach might be to contact Sparkle_Ungar and ask her to assess whether these layers have been used recently—in the last 6 months, for example. If not, the layers might be candidates for removal.
A quick scan of the report shows that Sparkle_Ungar owns several other hosted feature layers as well. It might be worthwhile to have her include these layers in her assessment. You could filter the list of hosted feature layers to show only those owned by Sparkle_Ungar, and send her the filtered report.

The Date Modified column in the report indicates that all layers were last updated in 2022, although the item pages of some of the layers have been viewed more recently (Date Last Viewed column).
It’s probably more meaningful to look at the usage information associated with the items. To do this, Sparkle can find the items in her content and look at the Usage tab of each layer’s item page.
This layer, for example, has the second-largest feature storage size, but has only had 16 requests in the last 6 months, with an average of 0.09 requests per day:

Since the layer doesn’t appear to be used very often, it might be a good candidate for removal. However, it’s important to first ensure that the layer isn’t being used in a shared map or app that other organization members or the public may be using.
Tip: If you’re interested in finding out how many times items in your organization have been viewed throughout a specific time period, you can create an item view count report. This might provide additional information about the popularity or usefulness of items in the organization.
Reduce hosted feature layer size
If you have large hosted feature layers in your organization, you may be able to make changes to the layers themselves to reduce their size, thereby reducing their associated storage credit costs.
The following factors may affect the size of a hosted feature layer:
- Number of features
- Number of fields
- Complex features with many vertices
- Layer optimization
- Editing and sync settings (more on these below)
When publishing a hosted feature layer, you can remove any unnecessary features and fields to reduce the size of the layer. Simplifying the geometry of features will also reduce size and improve display performance.
Editing settings such as enabling sync for offline use and collaboration, as well as turning on the option to keep track of edits, can also increase feature storage usage over time. When either of these options is enabled, ArcGIS Online stores information about data changes and offline versions in a change log, which grows as changes accumulate. You can cut down on the additional storage costs associated with the change log by trimming it.
As mentioned earlier in the article, many hosted feature layers contain attachments, which are stored as files and incur storage costs (listed in the File Storage Size column of the item report). Disabling attachments on an editable hosted feature layer will prevent other users from adding attachments to the layer.
Tip: If your organization has a lot of members and content, you might consider upgrading to Premium Feature Data Store. Premium Feature Data Store offers dedicated database resources for your organization. It uses a fixed price model rather than charging credits for feature storage. For more information, check out the blog article, Tracking your ArcGIS Online Feature Data Store Key Health Indicators.
Learn more
For more information about managing credits in your ArcGIS Online organization, explore this tutorial series or refer to the following individual resources:
- Credits overview (web page)
- ArcGIS Online Credits (video series)
- Understand credits (help documentation)
- Configure credits (help documentation)
- Managing credits in ArcGIS Online (blog article)
- Tips for managing credits consumed by analysis tools (blog article)
- Supercharge your ArcGIS Online Organization Management with Reports (blog article)
- Purchase additional credits (web page)
- Tracking your ArcGIS Online Feature Data Store Key Health Indicators (blog article)


Commenting is not enabled for this article.