ArcGIS Scene Viewer has been helping users to create dynamic highly-realistic scenes to explore both the natural and built world. With the latest June release, we are so excited to show you the packed features and enhancements, which will unleash the unlimited possibilities with more open data support, critical features to create immersive experience, and powerful editing and analysis capabilities.
Key updates on open data support
OpenStreetMap 3D scene layers
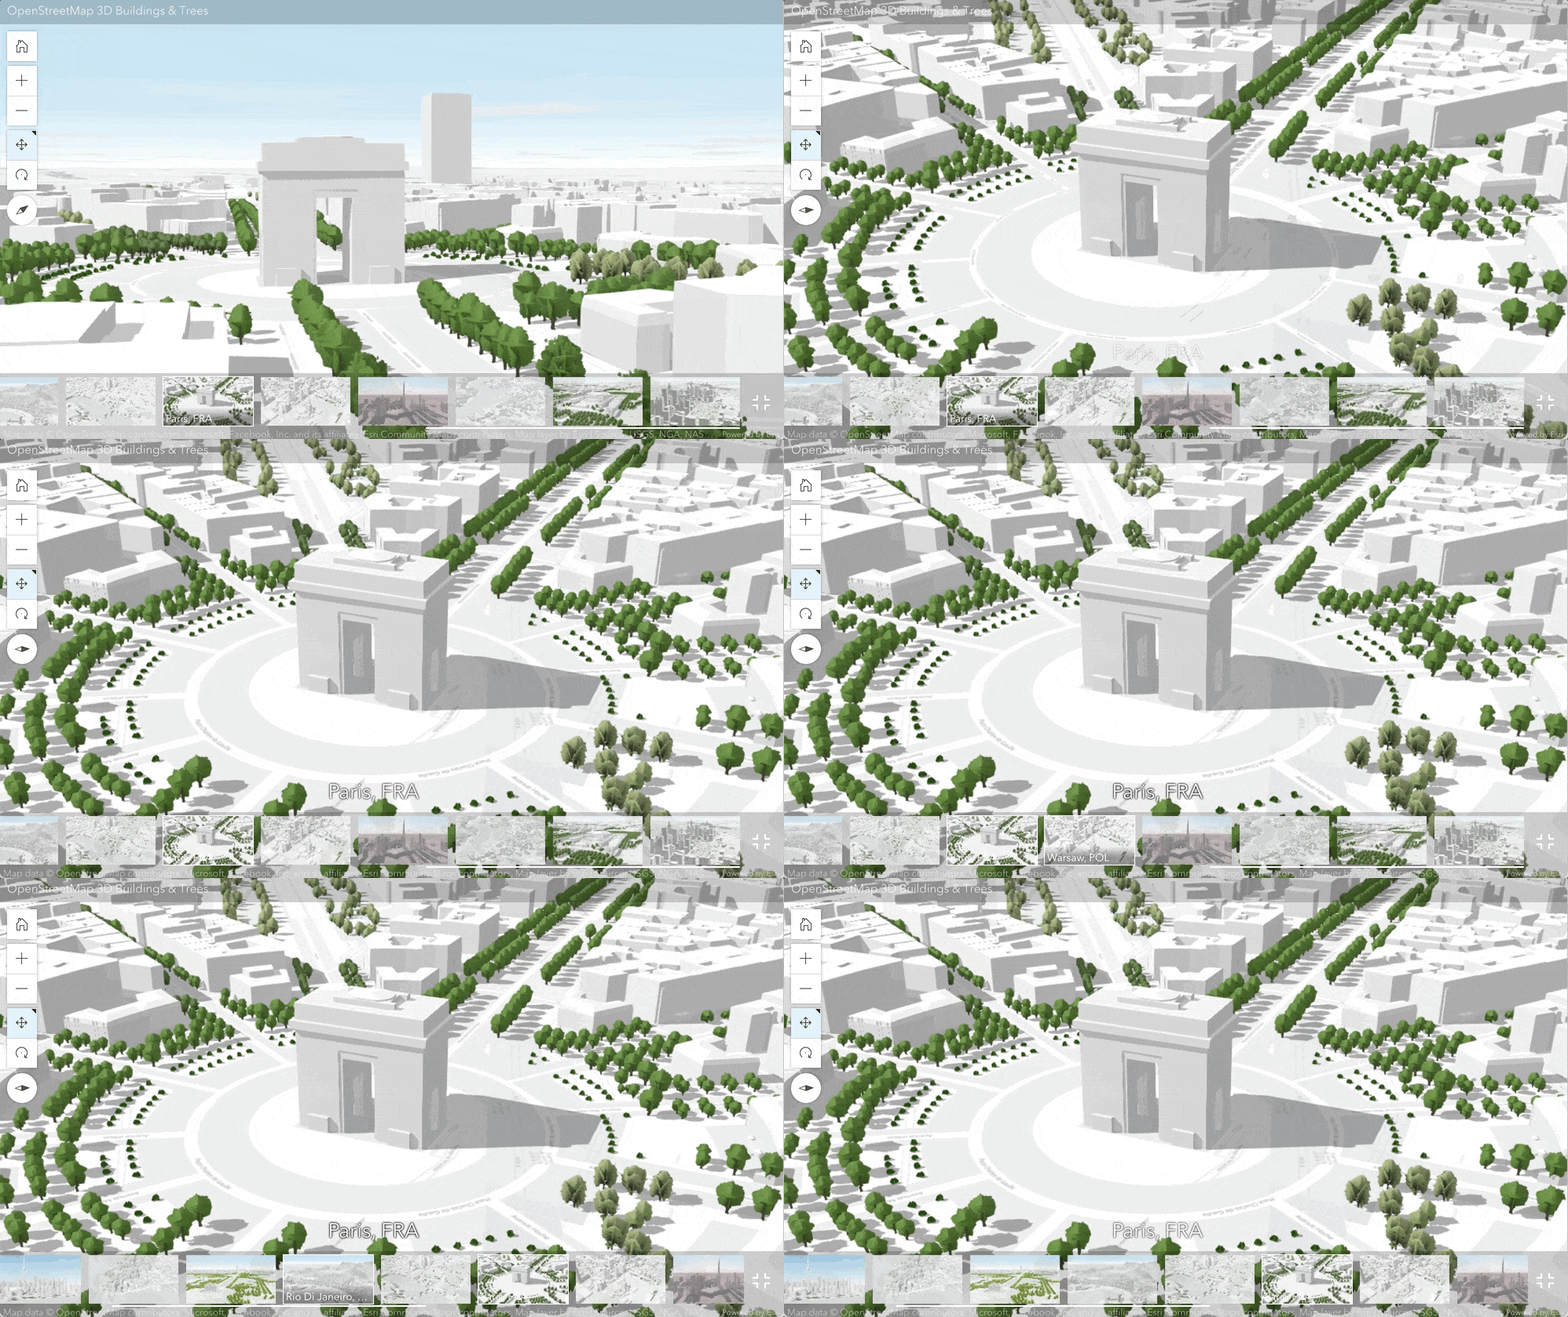
Esri is introducing a new set of OpenStreetMap(OSM) 3D scene layers with global coverage. The layers are available in ArcGIS Living Atlas. With this dataset, Scene Viewer now allows users to add worldwide 3D buildings and urban trees (both realistic and thematic) in WGS1984 to the scene.
This is an invitation from the 3D GIS world to novice users who might not have ready-to-use 3D data for their projects. This is also empowering users who have higher LOD data with a 3D surroundings. And for this group of users, you can mask out areas where you want to show your own data. We put together a list of cities across the globe in this Web Scene to help you get started.
GeoJSON and CSV layers
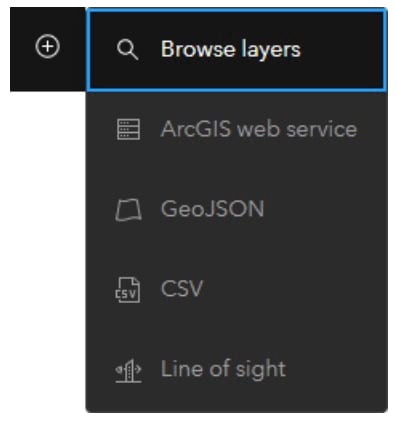
It is one of our major efforts to provide a seemless experience to explore both 2D and 3D data in a scene. GeoJSON and CSV are widely used to provide easily accessible geospatial contents for 2D GIS web mapping. Now users will also be able to add GeoJSON and CSV data as new layer types and set custom parameters in a 3D environment since this release. The parameter is used to set additional query when the layer is initialized or refreshed. One tip is that the file needs to be publicly accessible. Additionally, the CSV file needs to include at least one pair of coordinate fields to help locate the features in the scene.
Immersive experience to empower living Digital Twins
Weather effects
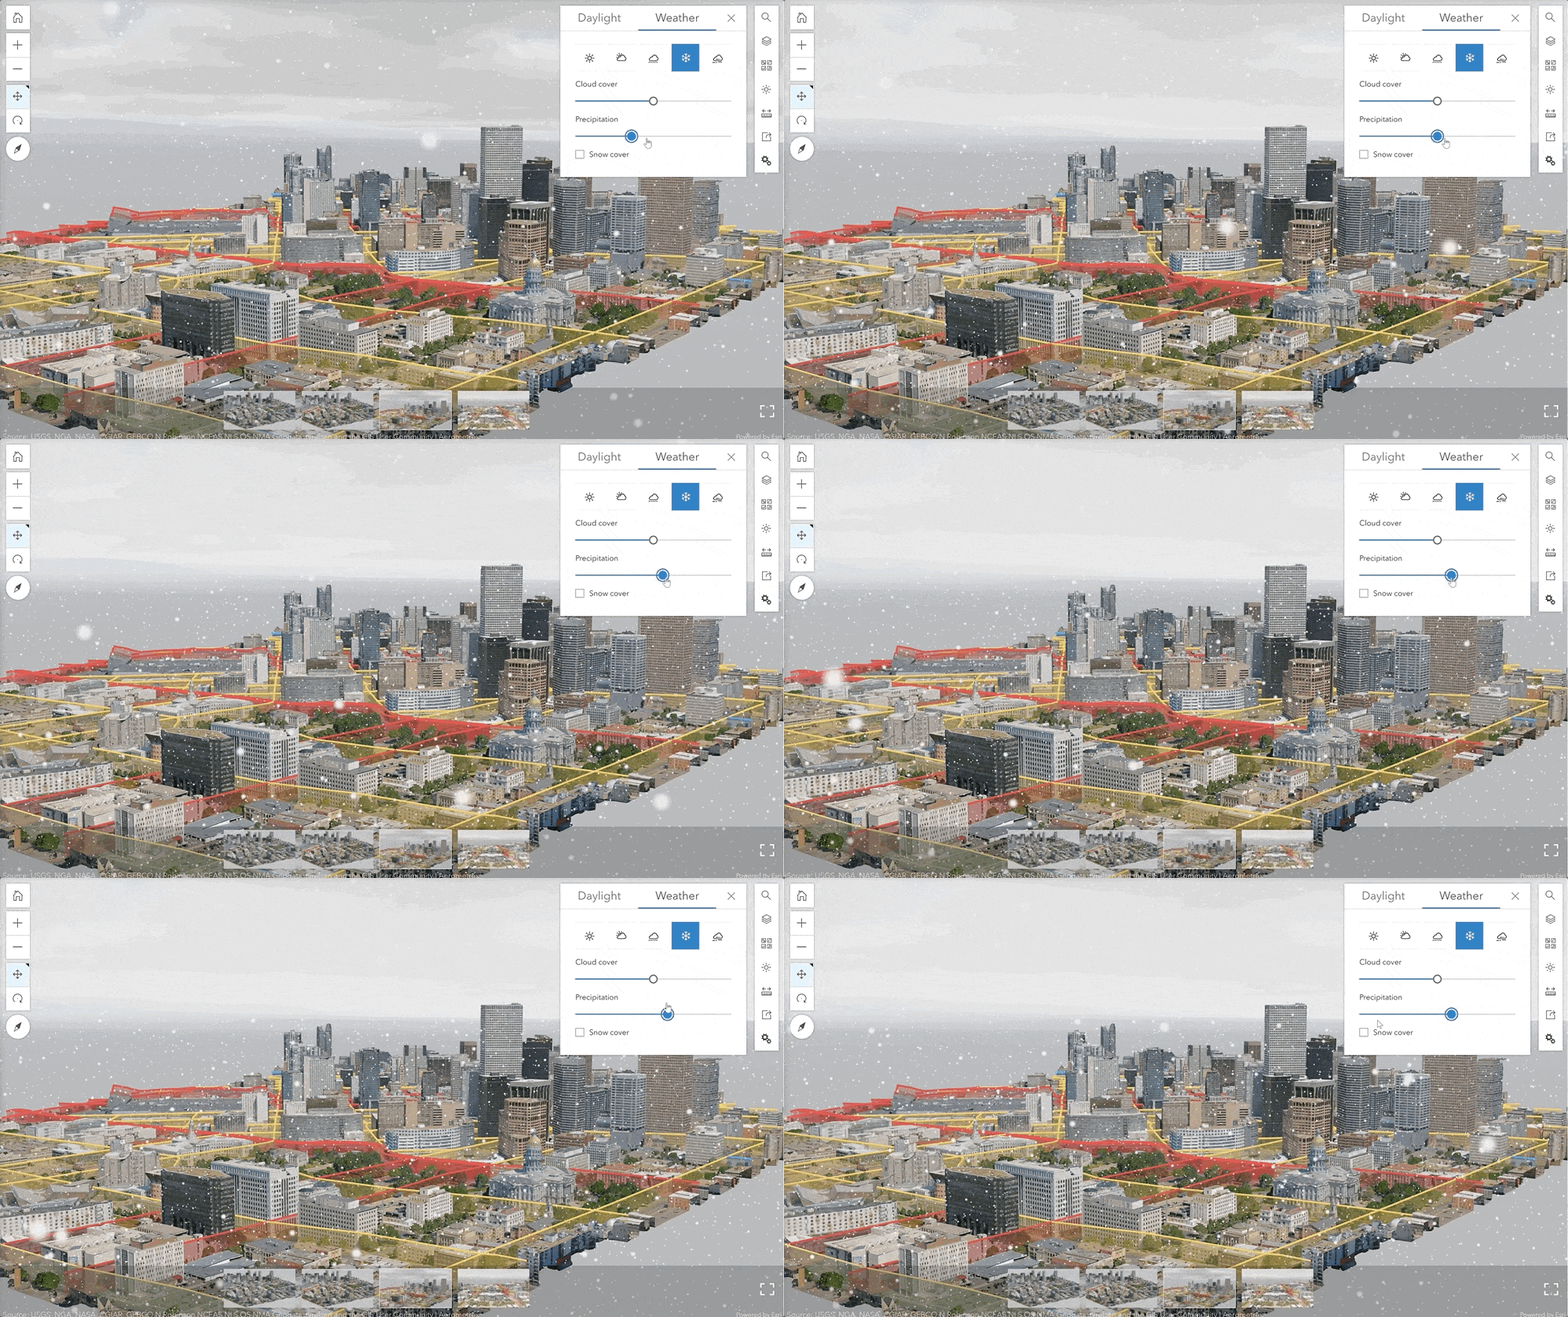
When creating an accurate and stunning 3D virtual world, it’s critical to have elements that could better simulate the environment like sunlight and weather. Now the long-waited Weather tool is included in Scene Viewer! You can adjust the cloud coverage, fog density, rain or snow intensity.
Export scene to a 360 VR Experience
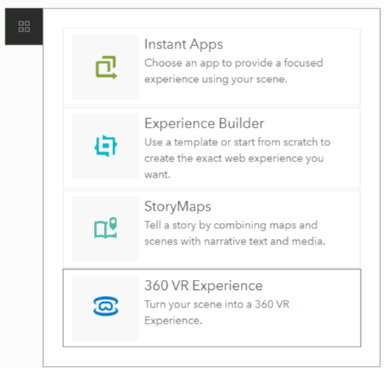
On top of all these, you can easily transform your Web Scene into an immersive 360 VR Experience. It turns your slides into 360 viewpoints, so you can handout VR goggles to engage your audience with just one click.
Daylight tool enhancement
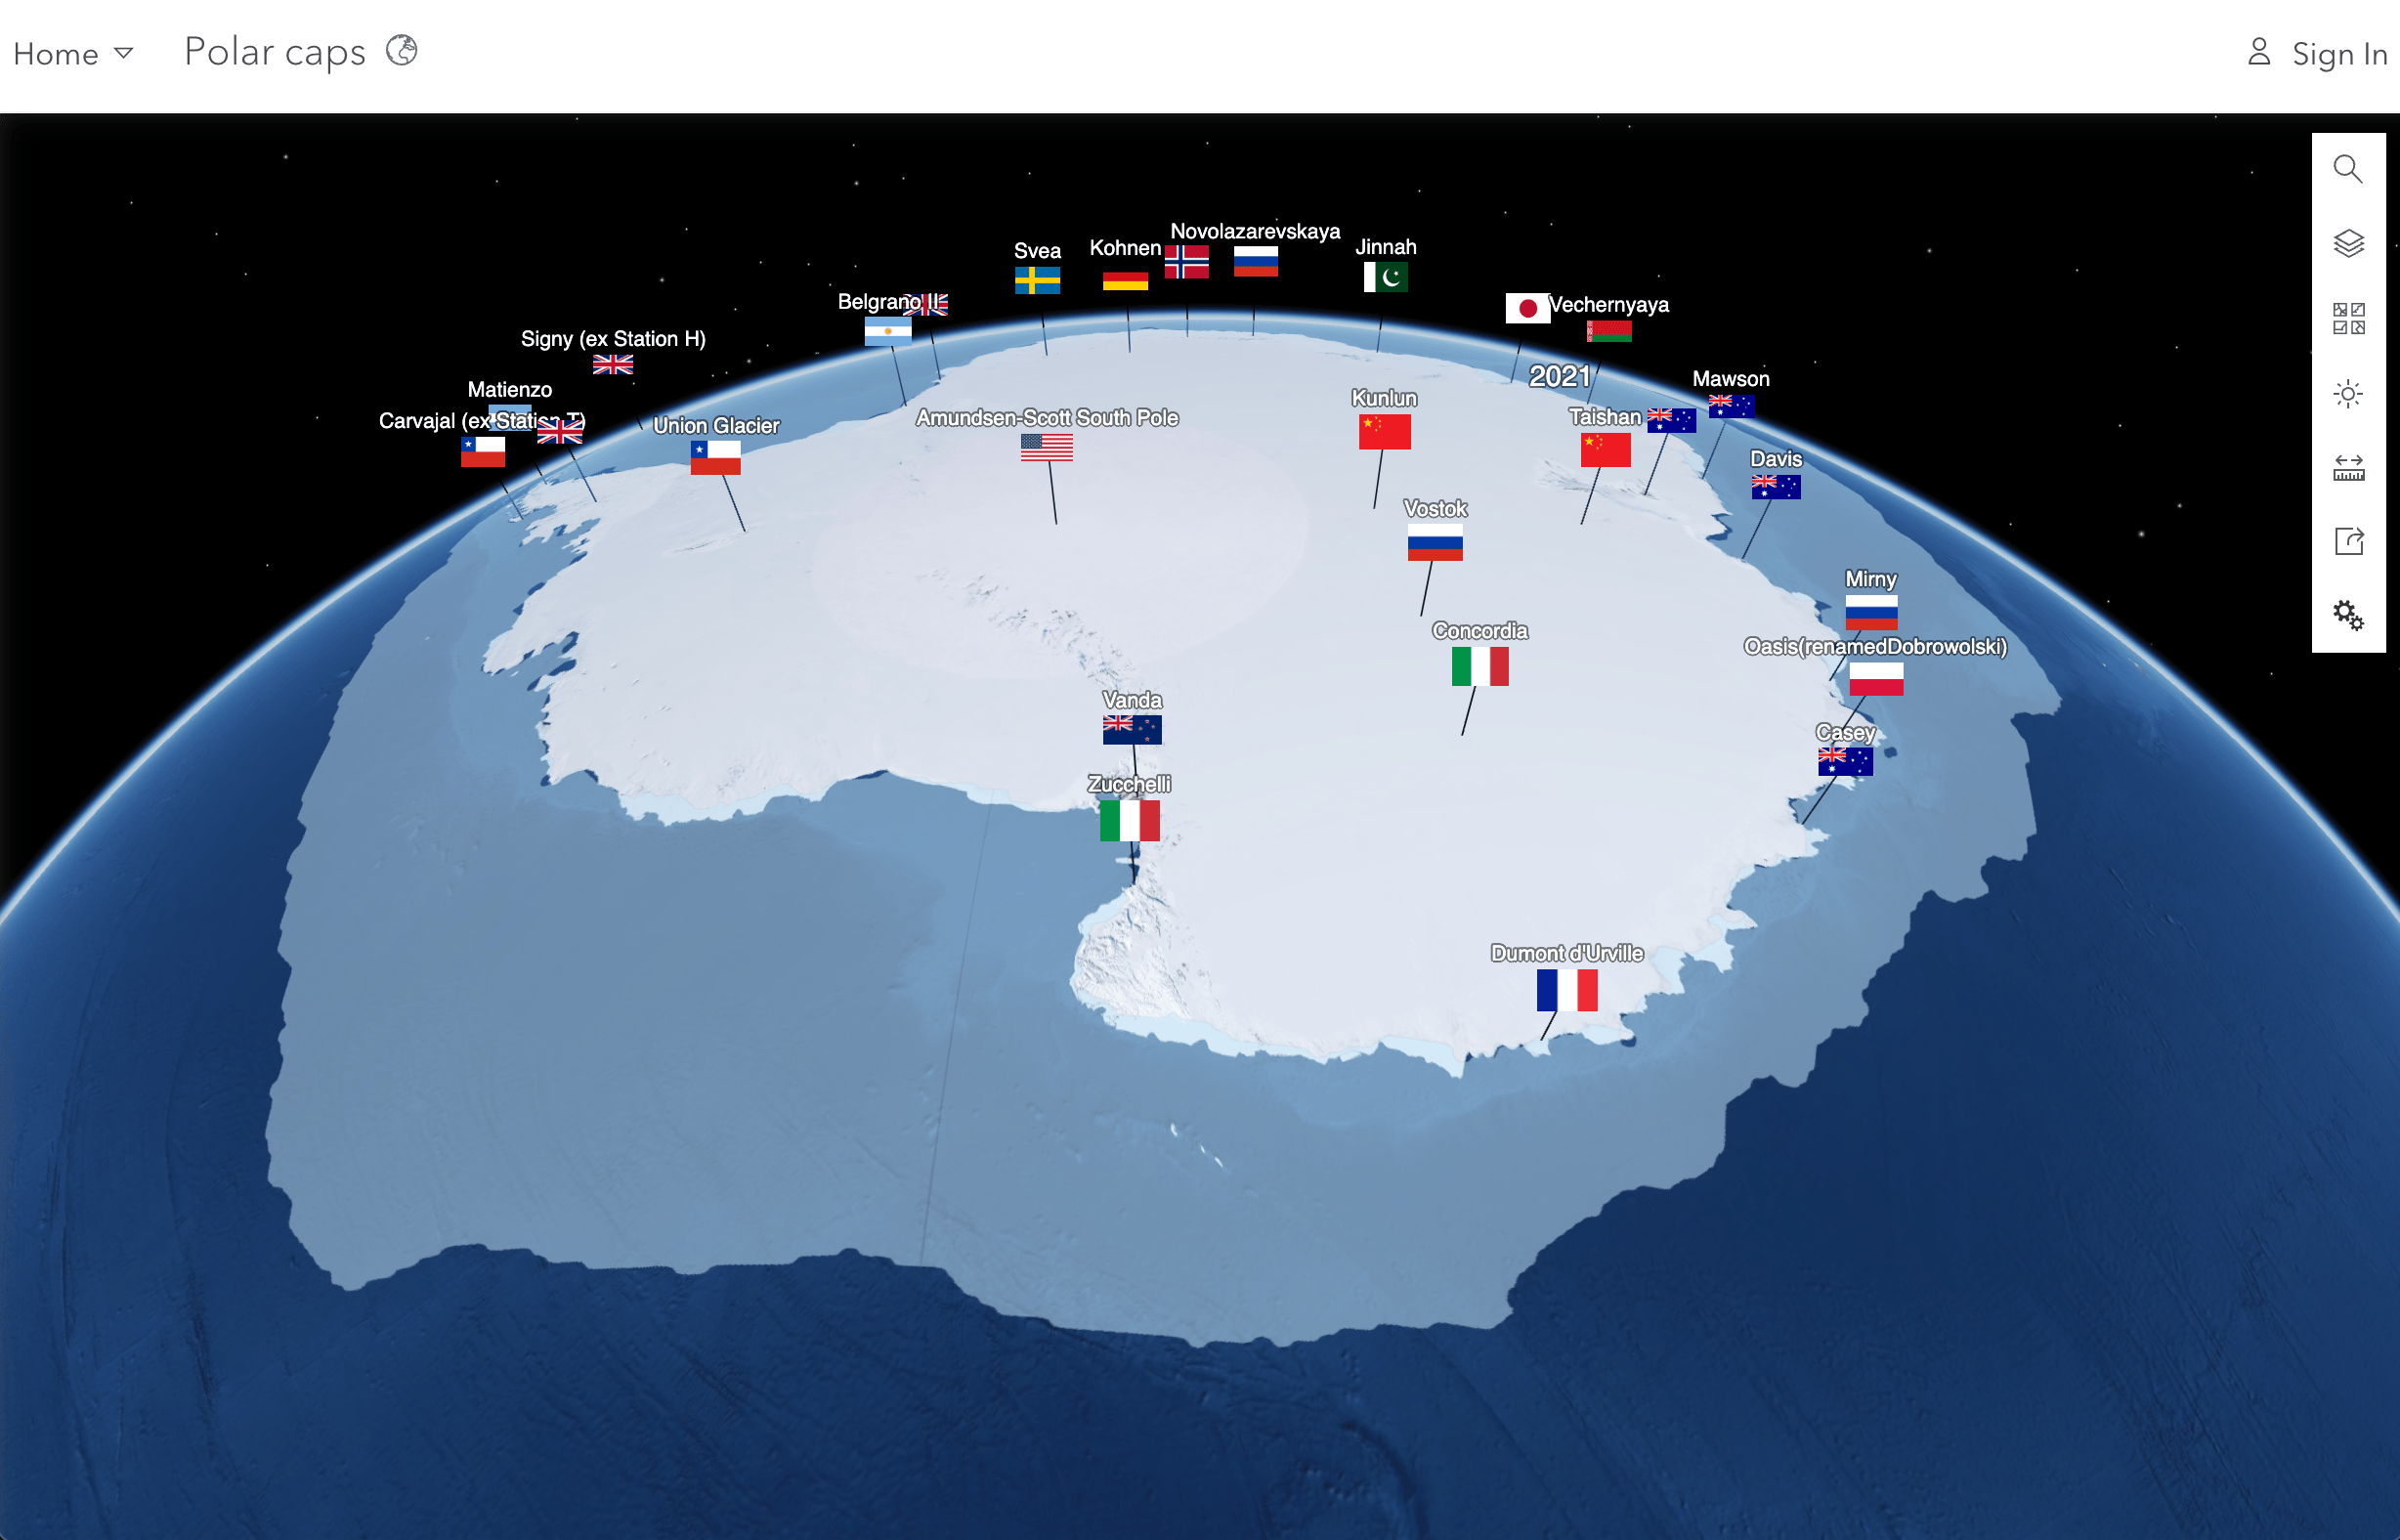
Another great enhancement of the Daylight tool is that user now could improve lighting in your scene. You can now choose between the realistic light of the sun or a light source that is fixed to the viewers’ position. The first is determined by the given date and time which allows shadow analysis. The latter ensures that your scene is always well lit for better visualization, like in polar regions.
Powerful web editing and analysis capabilities
For users who have been using Scene Viewer to interactively edit, analyze and come up with insightful output, there are good news too.
Masking 3D object or point scene layer
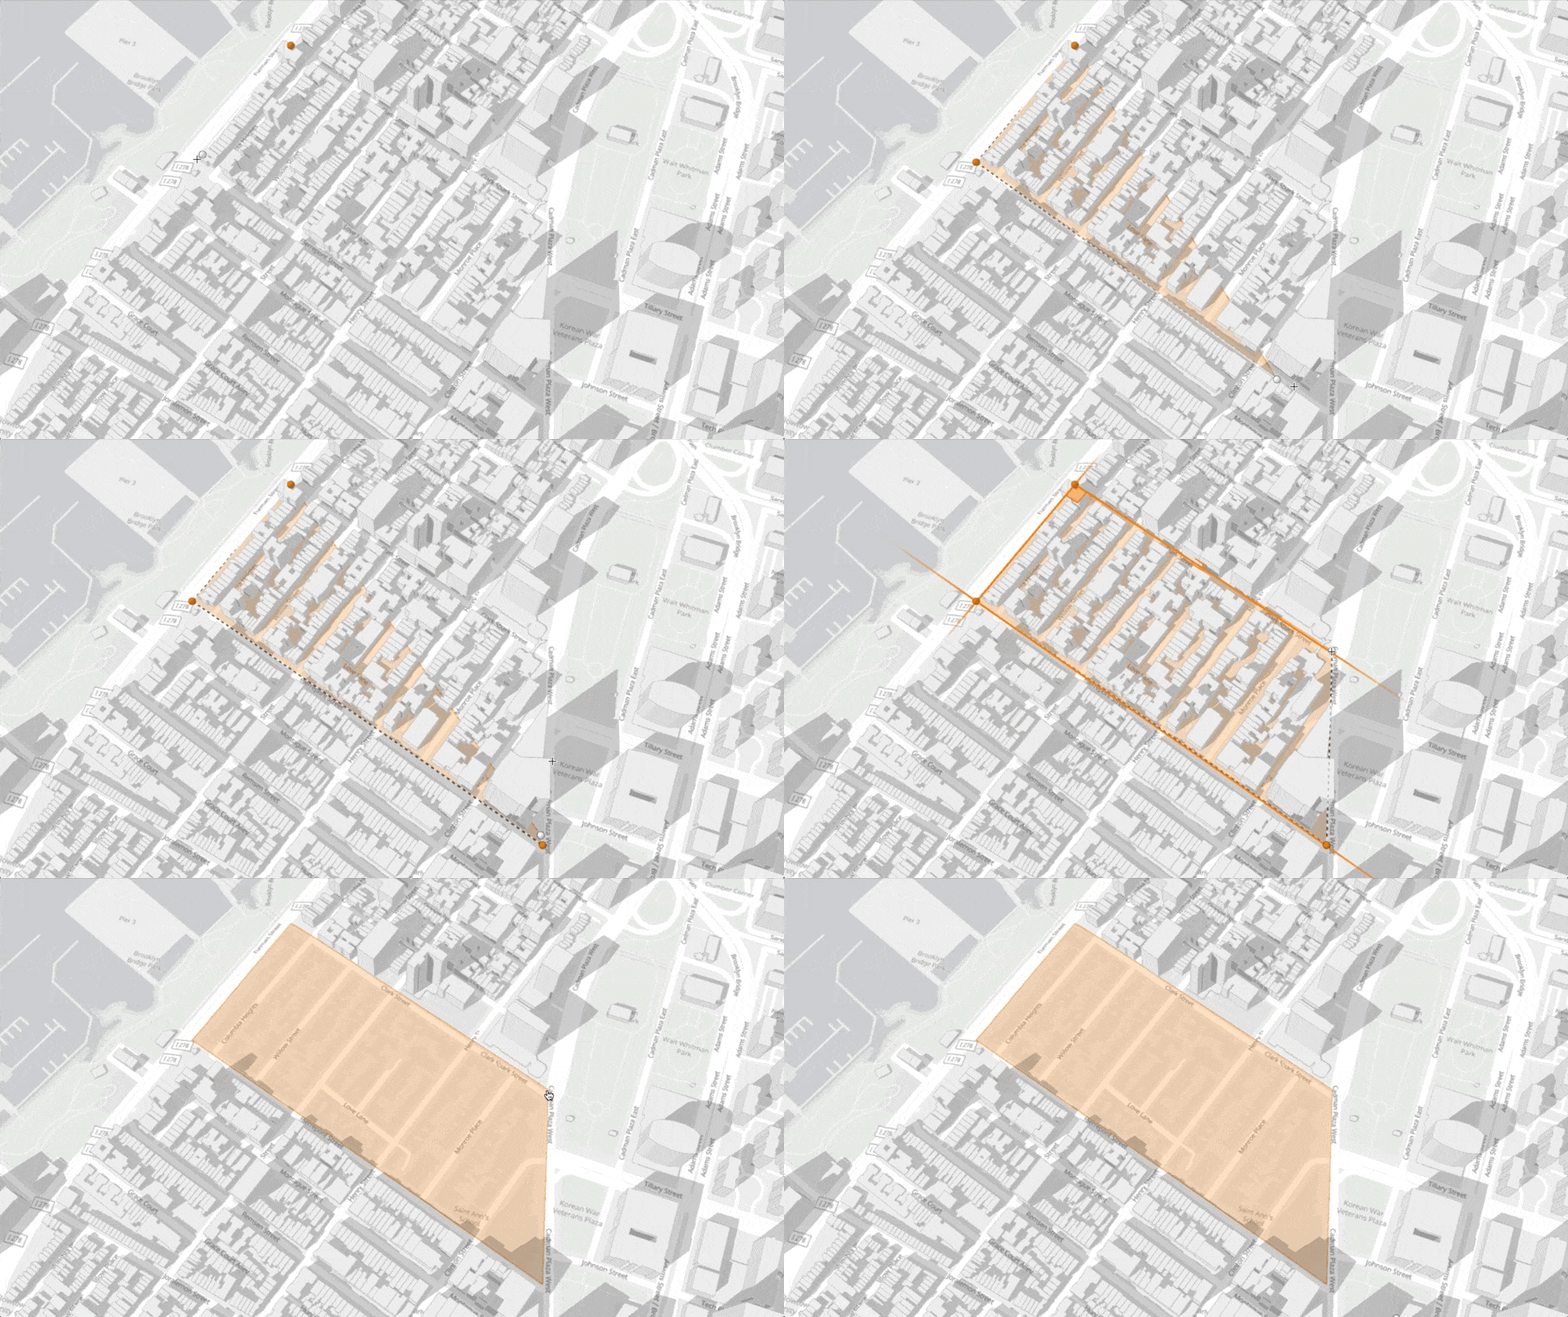
As mentioned, we allow masking capability on the OpenStreetMap 3D scene layers. Besides, for any 3D object or point scene layer, you can now apply spatial filters through the layer properties panel. Either select specific buildings or draw a polygon to include or exclude the buildings within.
Add line of sight as a scene layer
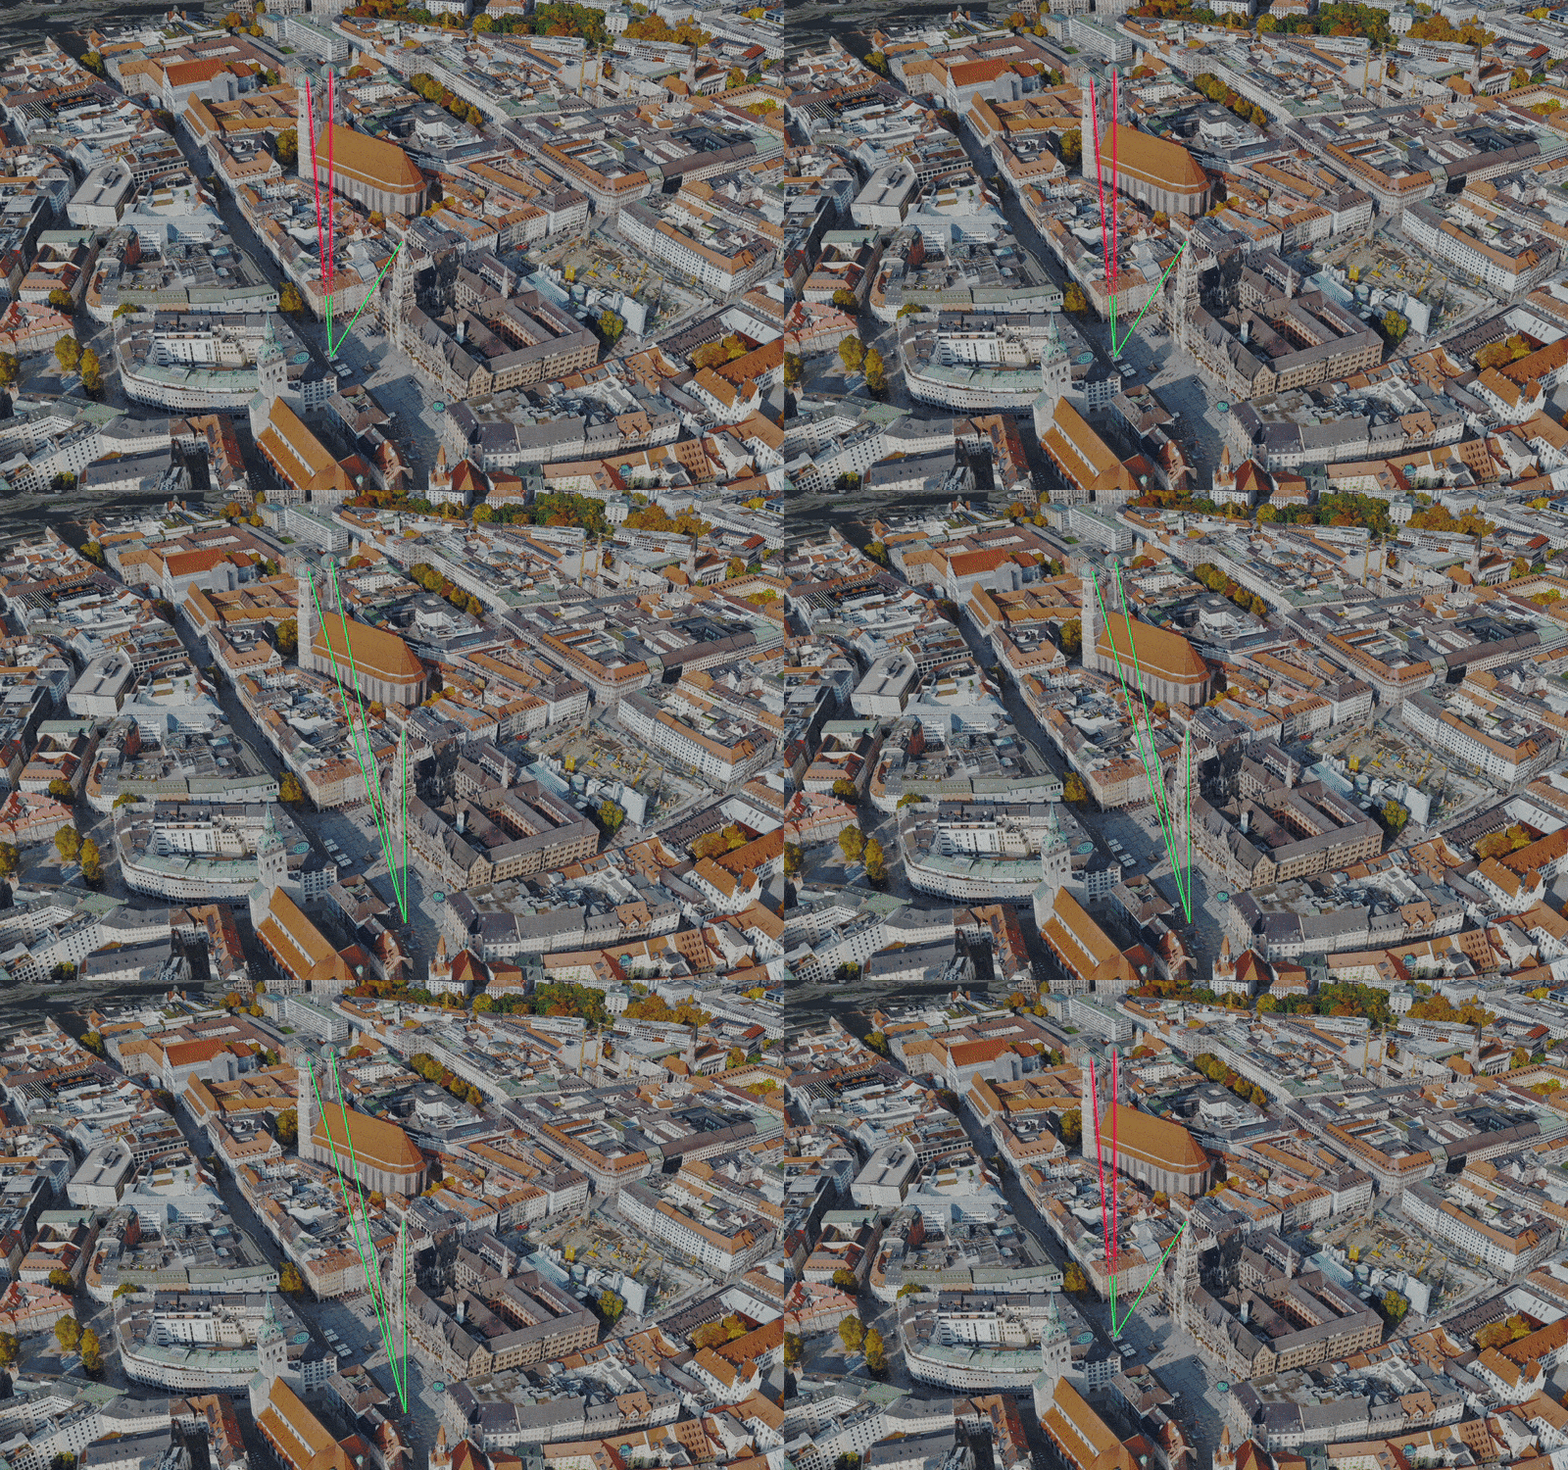
Starting from this release, user can add line of sight analysis results as a new scene layer type and save it in your slides. Persisting the results of interactive analysis enables a much easier storytelling by bringing your audience with your analysis process.
Enhancements on Tooltips and Styling
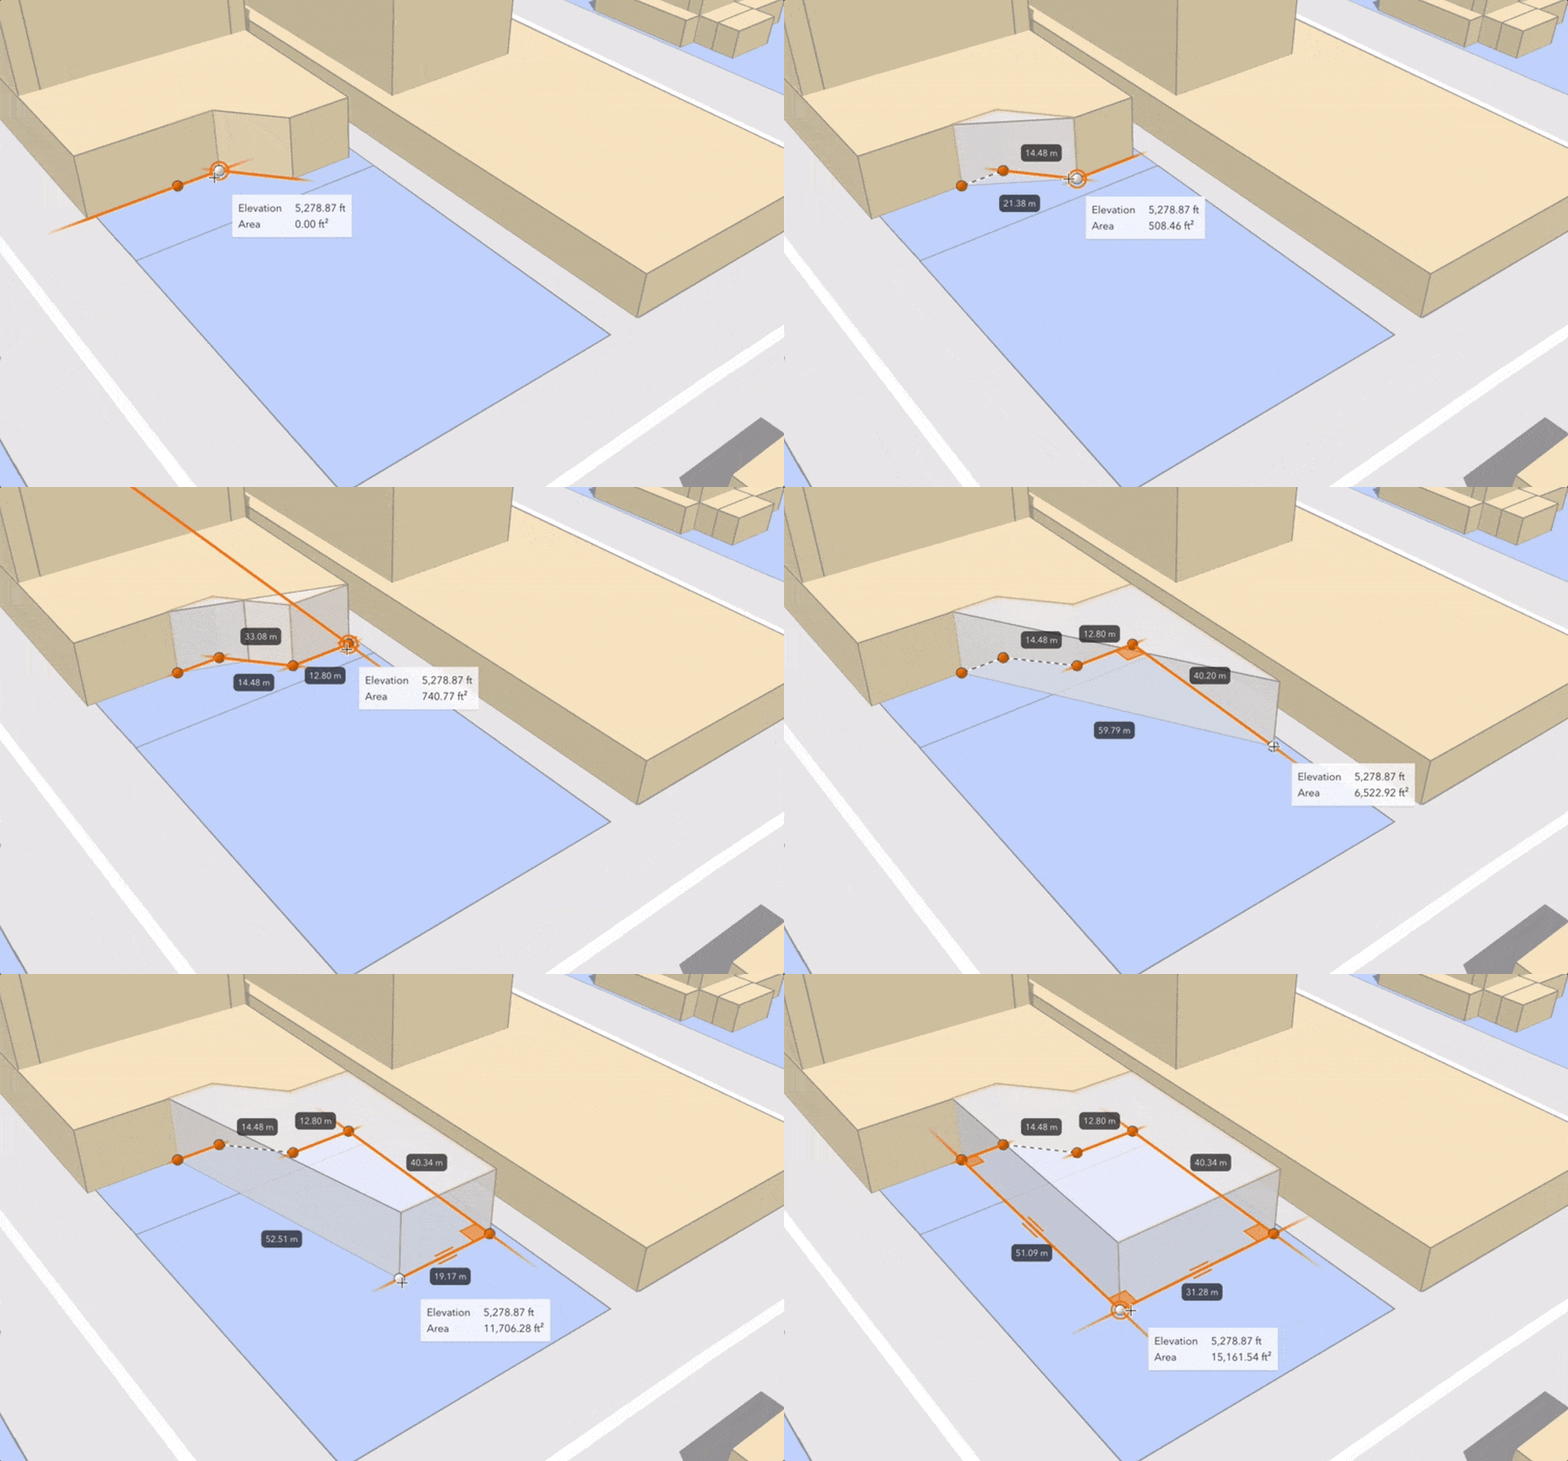
While editing, you will have Tooltips as an indications for segment lengths, area size and also coordinate offsets if distance to another feature is important.
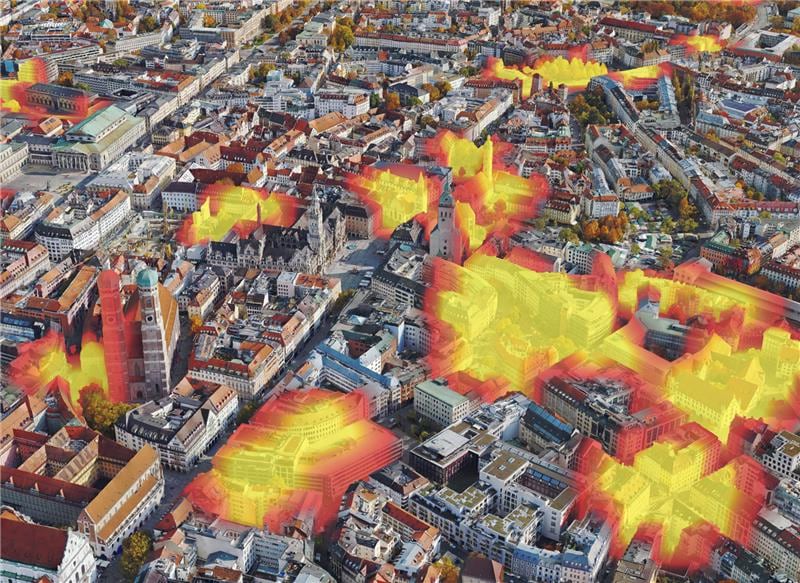
In 3D GIS environment, we need different styles to distinguish streets and underground pipelines. With this release, you can style your line data with dashed and dotted patterns or add markers, such as using arrows to indicate directions in your scene. You can also view heat map visualizations of point layers in 3D scenes.
The best way to learn about the updates are through use cases. Our team created this Come Rain or Shine story map to help you get started. We hope you enjoy exploring these new features and building stunning 3D stories with them. If you are coming to San Diego for 2022 Esri User Conference from July 11th to 15th, feel free to visit Scene Viewer booth in the expo to talk with our product team. We are looking forward to hearing more feedback from you!

These are great advancements!
When can we expect to have the new scene features embeddable in stories?
Regards
Manolis Koutlis, PhD
Hi Manolis,
Thanks. It’s coming next week and feel free to try out!
Best,
Jasmine
Great! thanks
Very cool updates. I’ve just turned our mesh model into some simple VR scenes as a teaser for our users.
Hey Andrew, that’s great to hear!