Spatial analysis is a fundamental aspect of GIS that empowers users to derive new insights by spatially combining various information about our environment. In a recent release, Scene Viewer has enhanced its capabilities by integrating access to around 40 powerful spatial analysis tools. With these, users can now enjoy a similar analysis experience known from Map Viewer. This integration provides endless opportunities to unlock new insights in the 3D environment and facilitate deeper understanding of spatial relationships.
In this blog post we want to give you an example on how to use the Analysis tools in Scene Viewer. We combine a realistic mesh of the city of Vienna with analysis results of local transportation accessibility by overlaying feature information on top of 3D data.
Using Analysis Tools
As a starting point, we added publicly accessible layers from the city of Vienna into Scene Viewer, including a 3D reality mesh and public transportation data. The reality mesh provides us with a beautiful 3D experience of the city. Our goal is to enhance this scene with information about areas that are within a certain walk time distance from train stations and the number of people living within those areas. Thanks to the availability of Analysis tools within Scene Viewer, such results can now be generated fast and efficiently without leaving the tool.
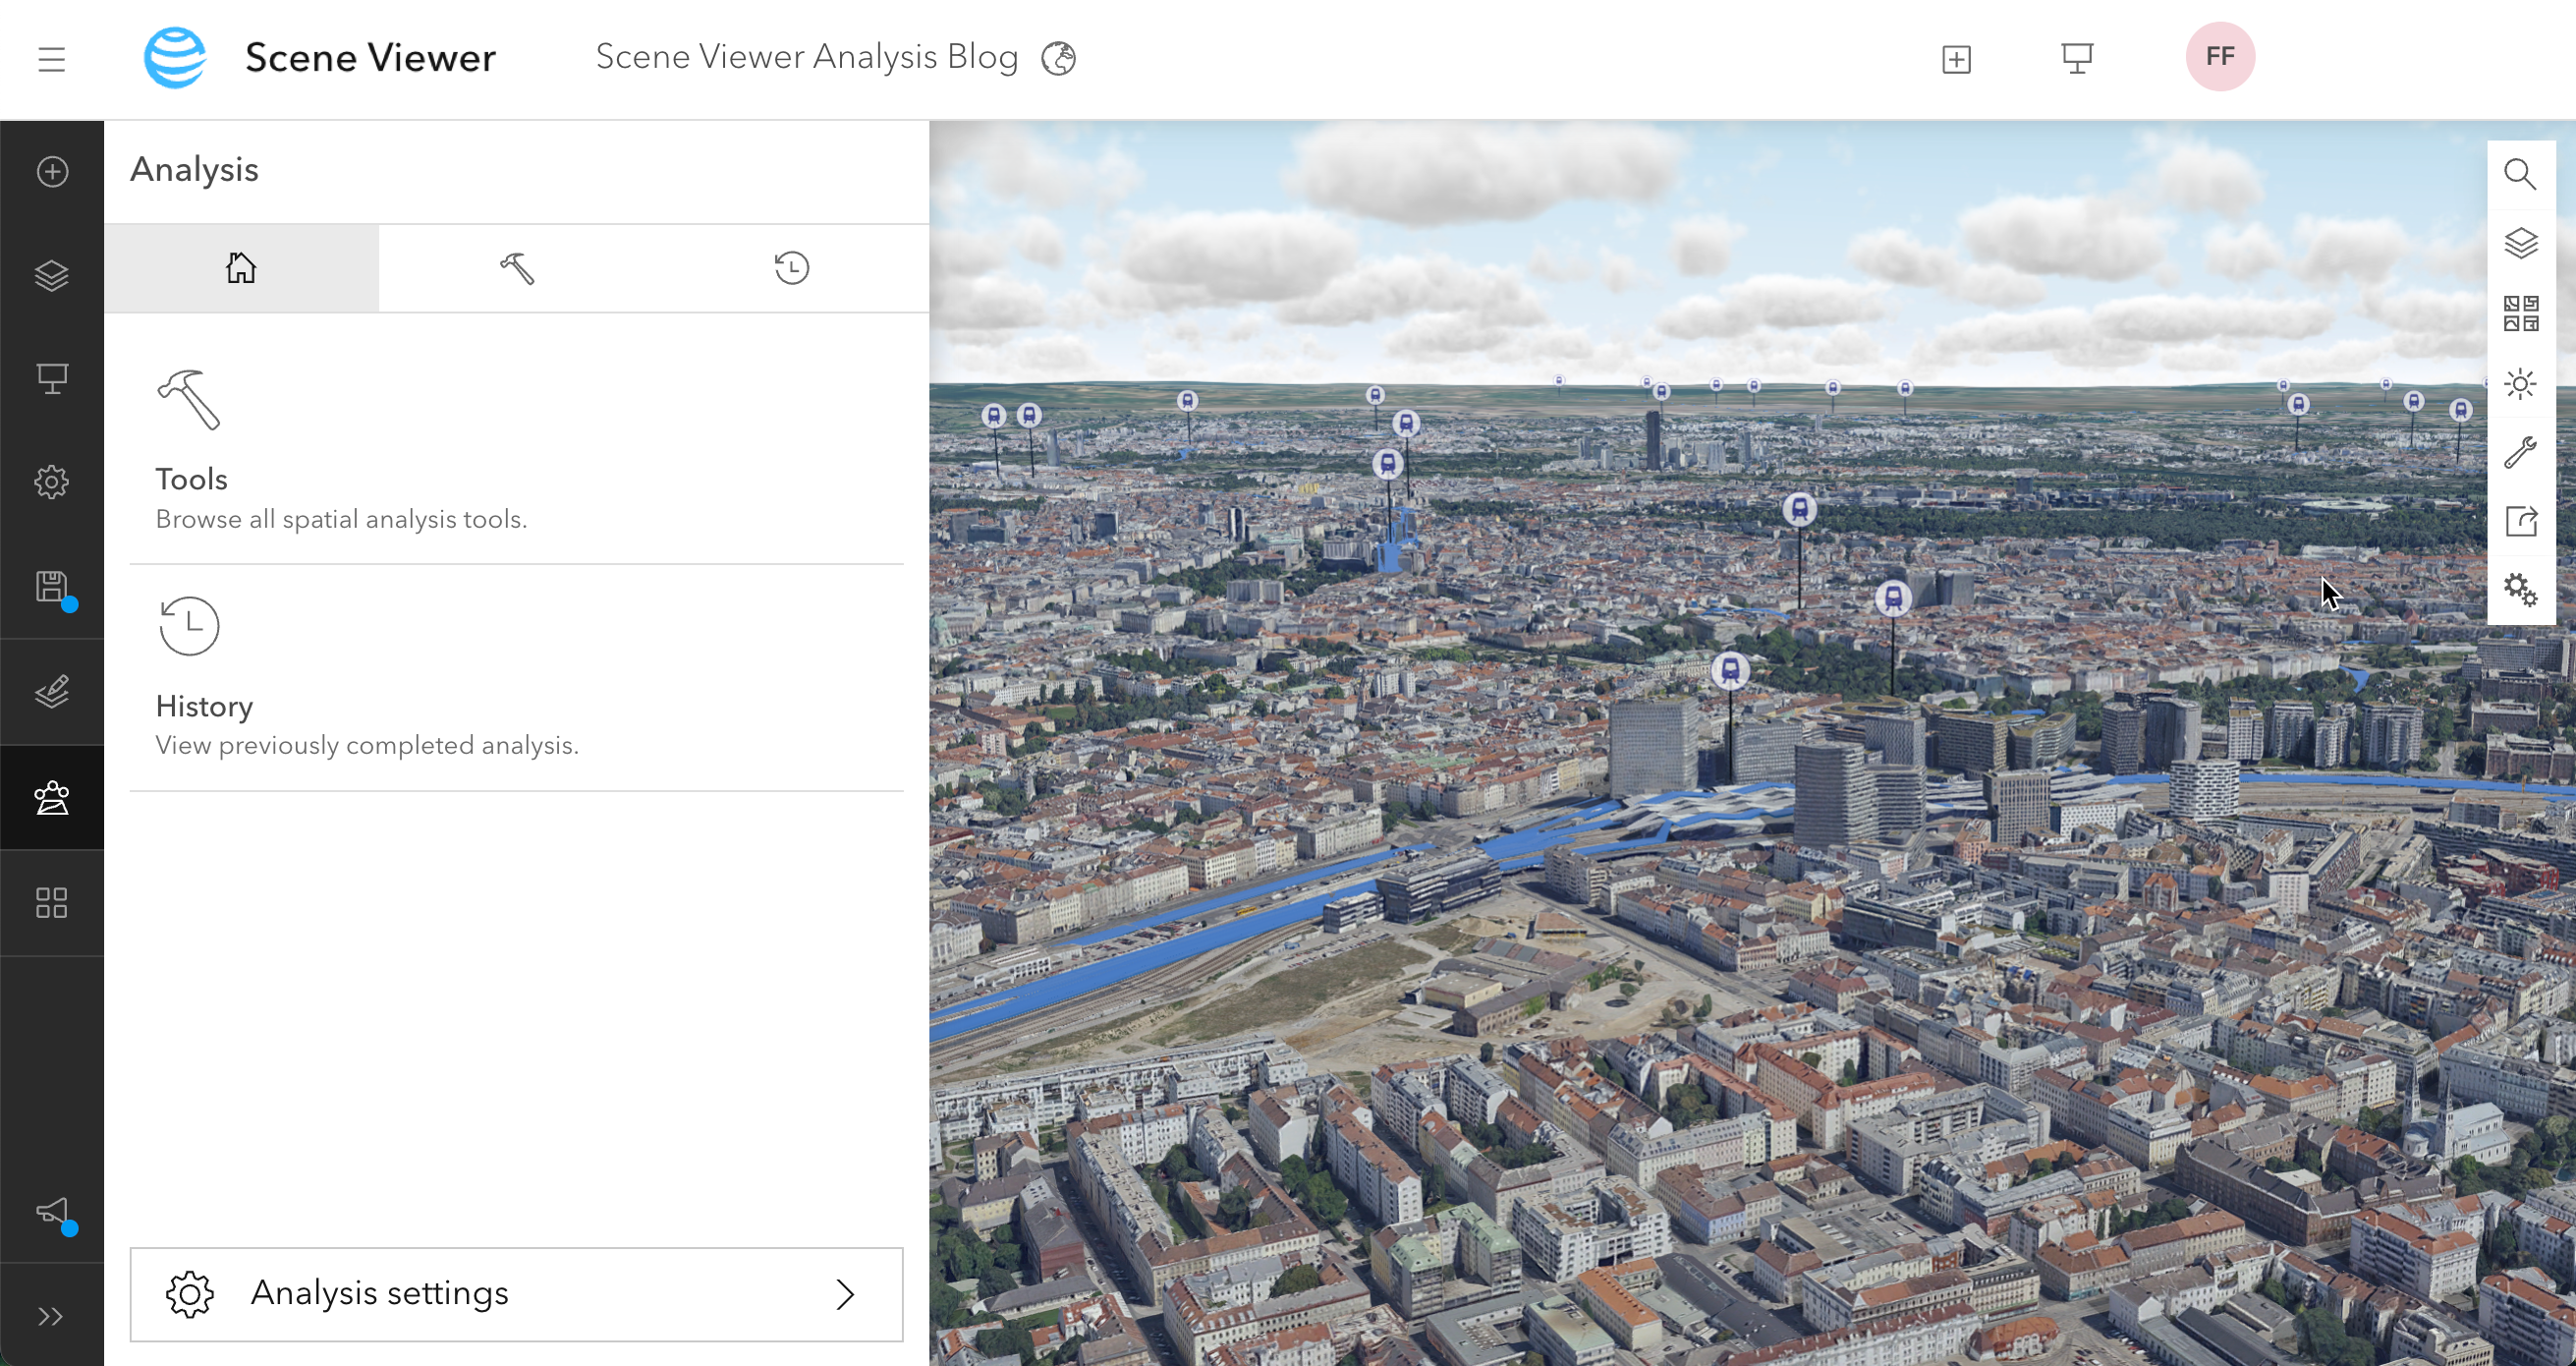
The Analysis Tools can be accessed in the Designer sidebar of Scene Viewer and are available to you based on your user type (more information here). All the Analysis tools are executed server side and return results as new layer items in your Portal or ArcGIS Online subscription. The generated layers can then be used directly in your web scenes or in other applications of the ArcGIS platform.
Walk Time Analysis
In a first step, we want to visualize areas that are within a certain walk time to train stations. To obtain this result, we are using the “Generate Travel Areas” tool within the Analysis panel. This tool allows us to calculate areas accessible by a specific mode of transport and within a defined travel time or distance along the street network. We will specify our train station layer as the input for the analysis settings and select “walking time” as the parameter for analysis. In the cutoff section of the tool, we can define various time intervals for which we want to receive results. Once we specified all the settings, we can directly check the credit consumption of this analysis and press “Run” once everything is set. The analysis is then performed in the background on the server.
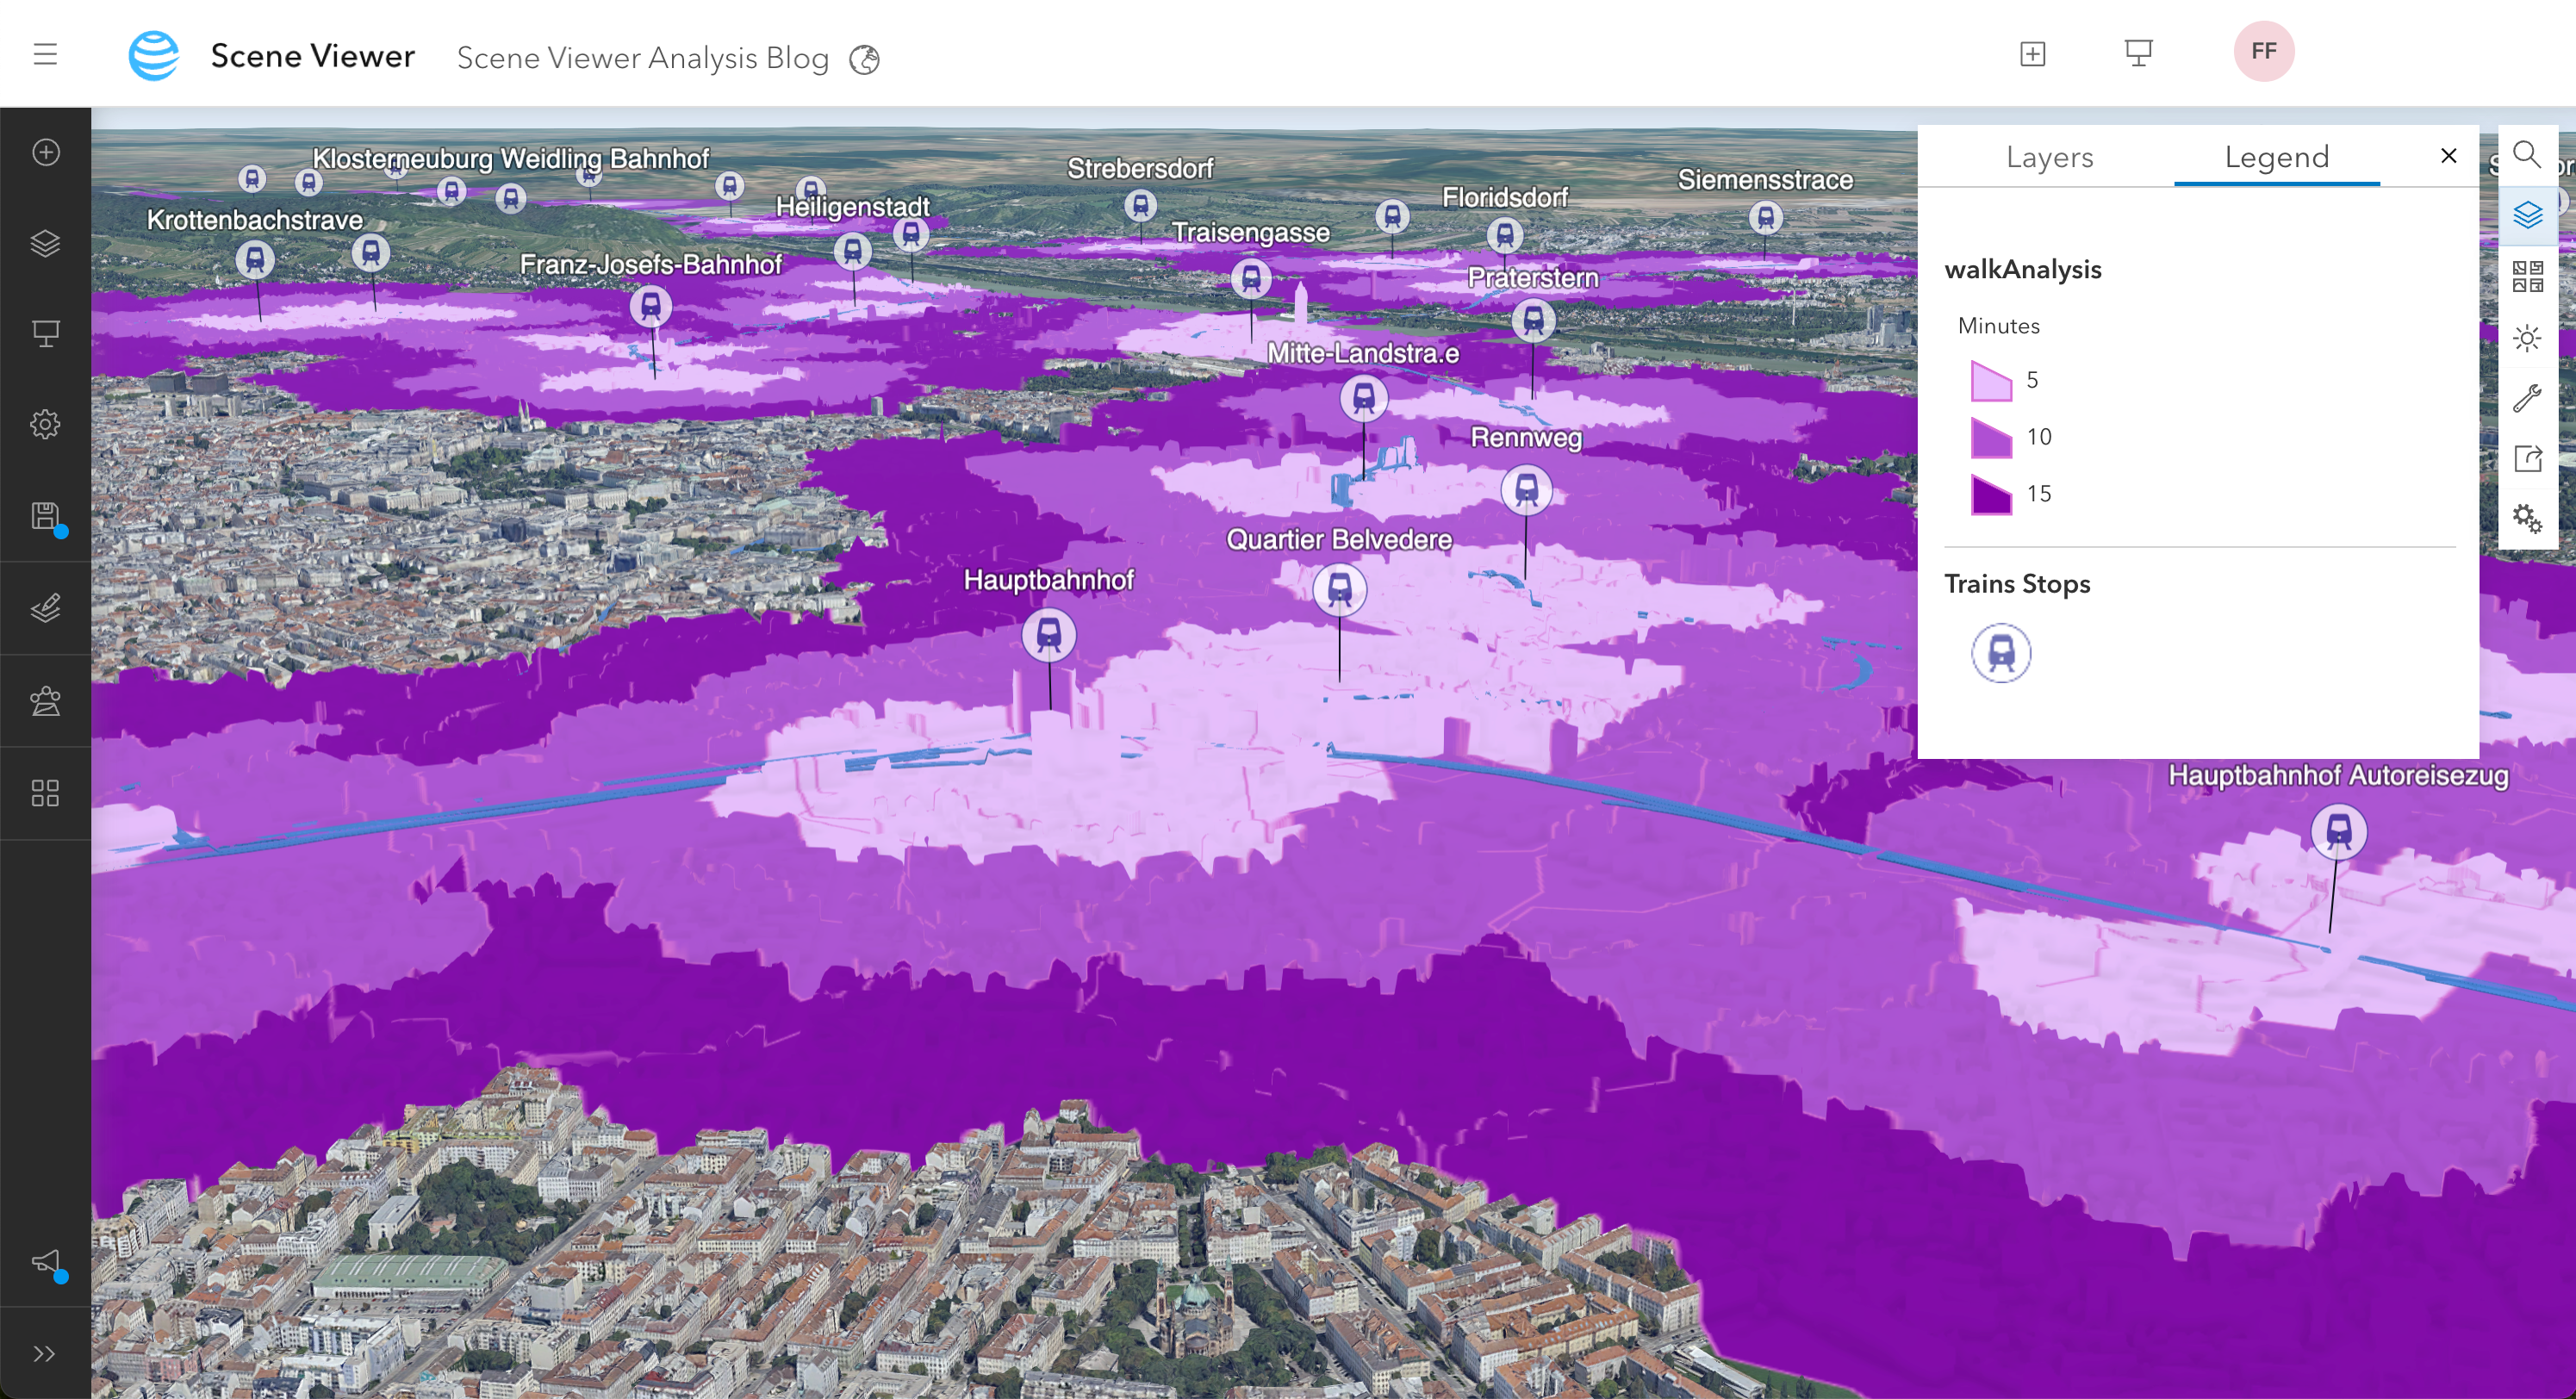
Once this process is complete, the resulting layer is added to our web scene and automatically overlayed on top of the 3D mesh. Users also have the option to select different elevation settings for the layer if needed. The layer now illustrates all areas that can reach a train station by foot within our specified time of 5, 10, and 15 minutes. Such information is valuable for urban planners or local businesses, as it helps identify accessible zones for public transport users, facilitating better decision-making.
Add demographic information
We can now take our calculated layer and enhance it further or create new layers out of it by using one of the many analysis tools. In our case, we are also interested to know the number of people living in each of these areas. For this, we can use the tool called “Enrich data” that allows you to add information to your data anywhere in the world. The available demographic variables to enrich your data are preselected based on the area of interest. For our example in Vienna, we can add information such as population, income, age distribution, marital status, and many more. Since we are interested in the number of people living in the areas, we select the “2023 Total Population” as the variable to enrich our data.
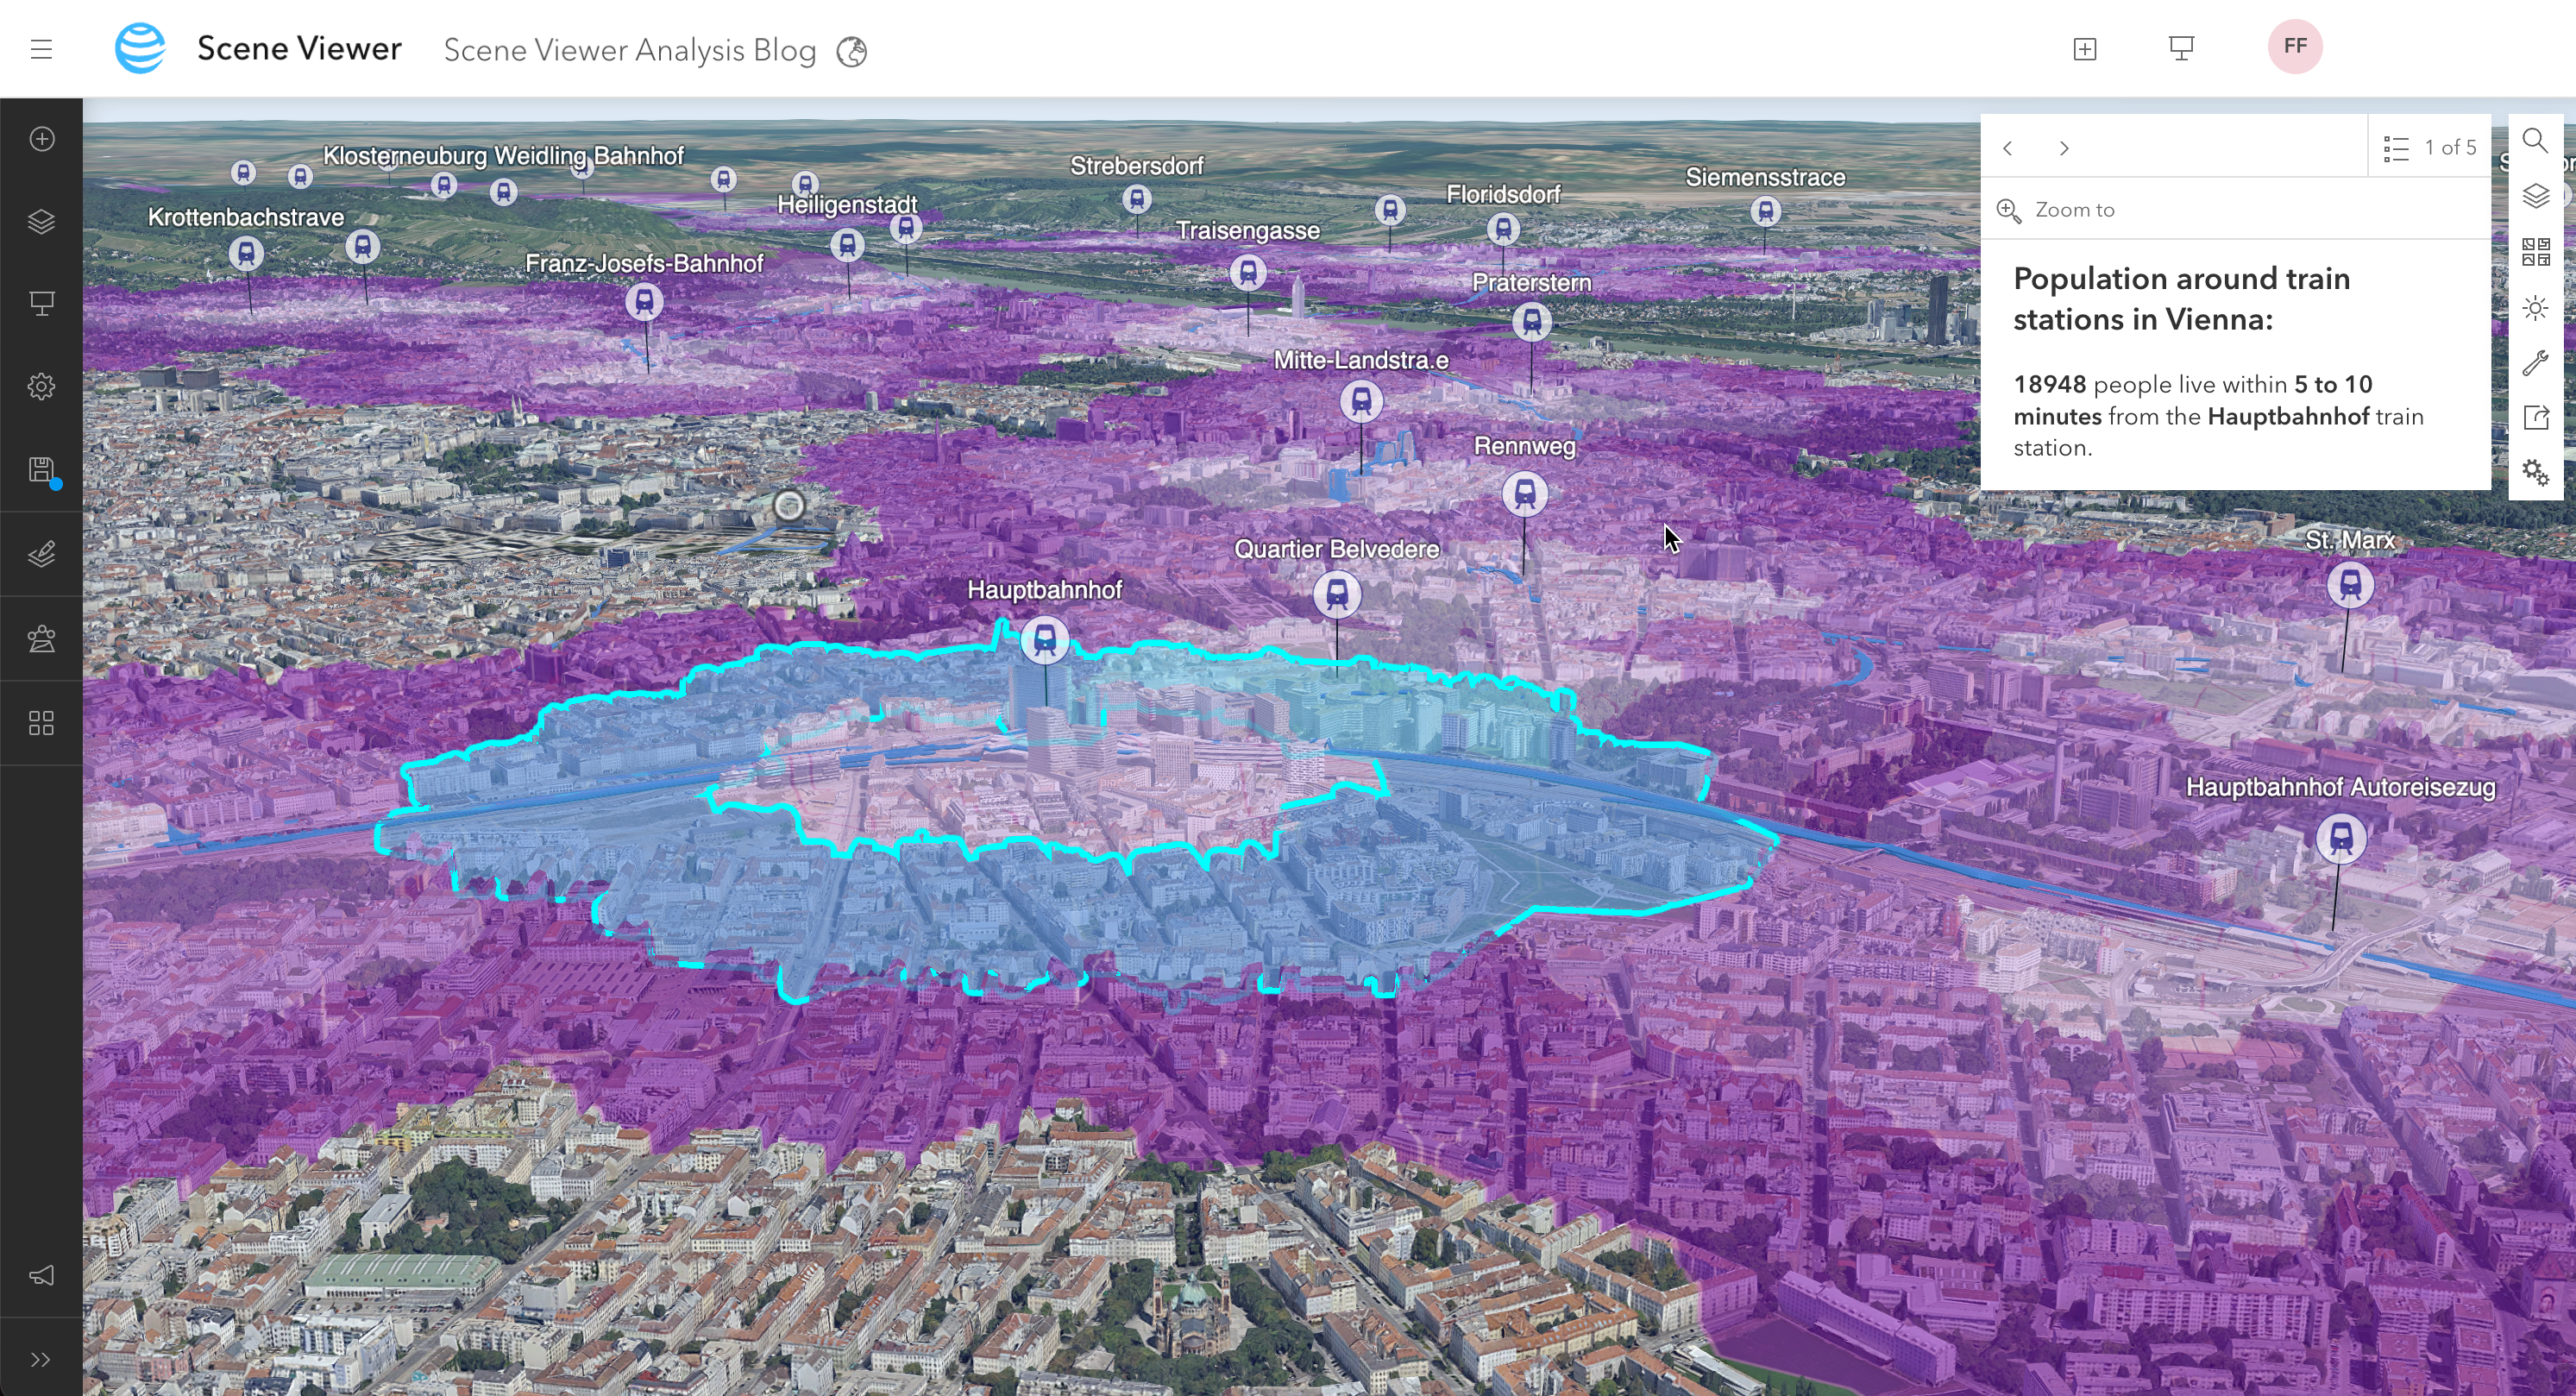
After a brief processing time, a new layer is added to our web scene, which includes the previously generated walk time polygons enriched with additional attributes that display the total population in each of those areas. For instance, we can now easily observe that more than 18’000 people live within 10 minutes of the Main Station in Vienna.
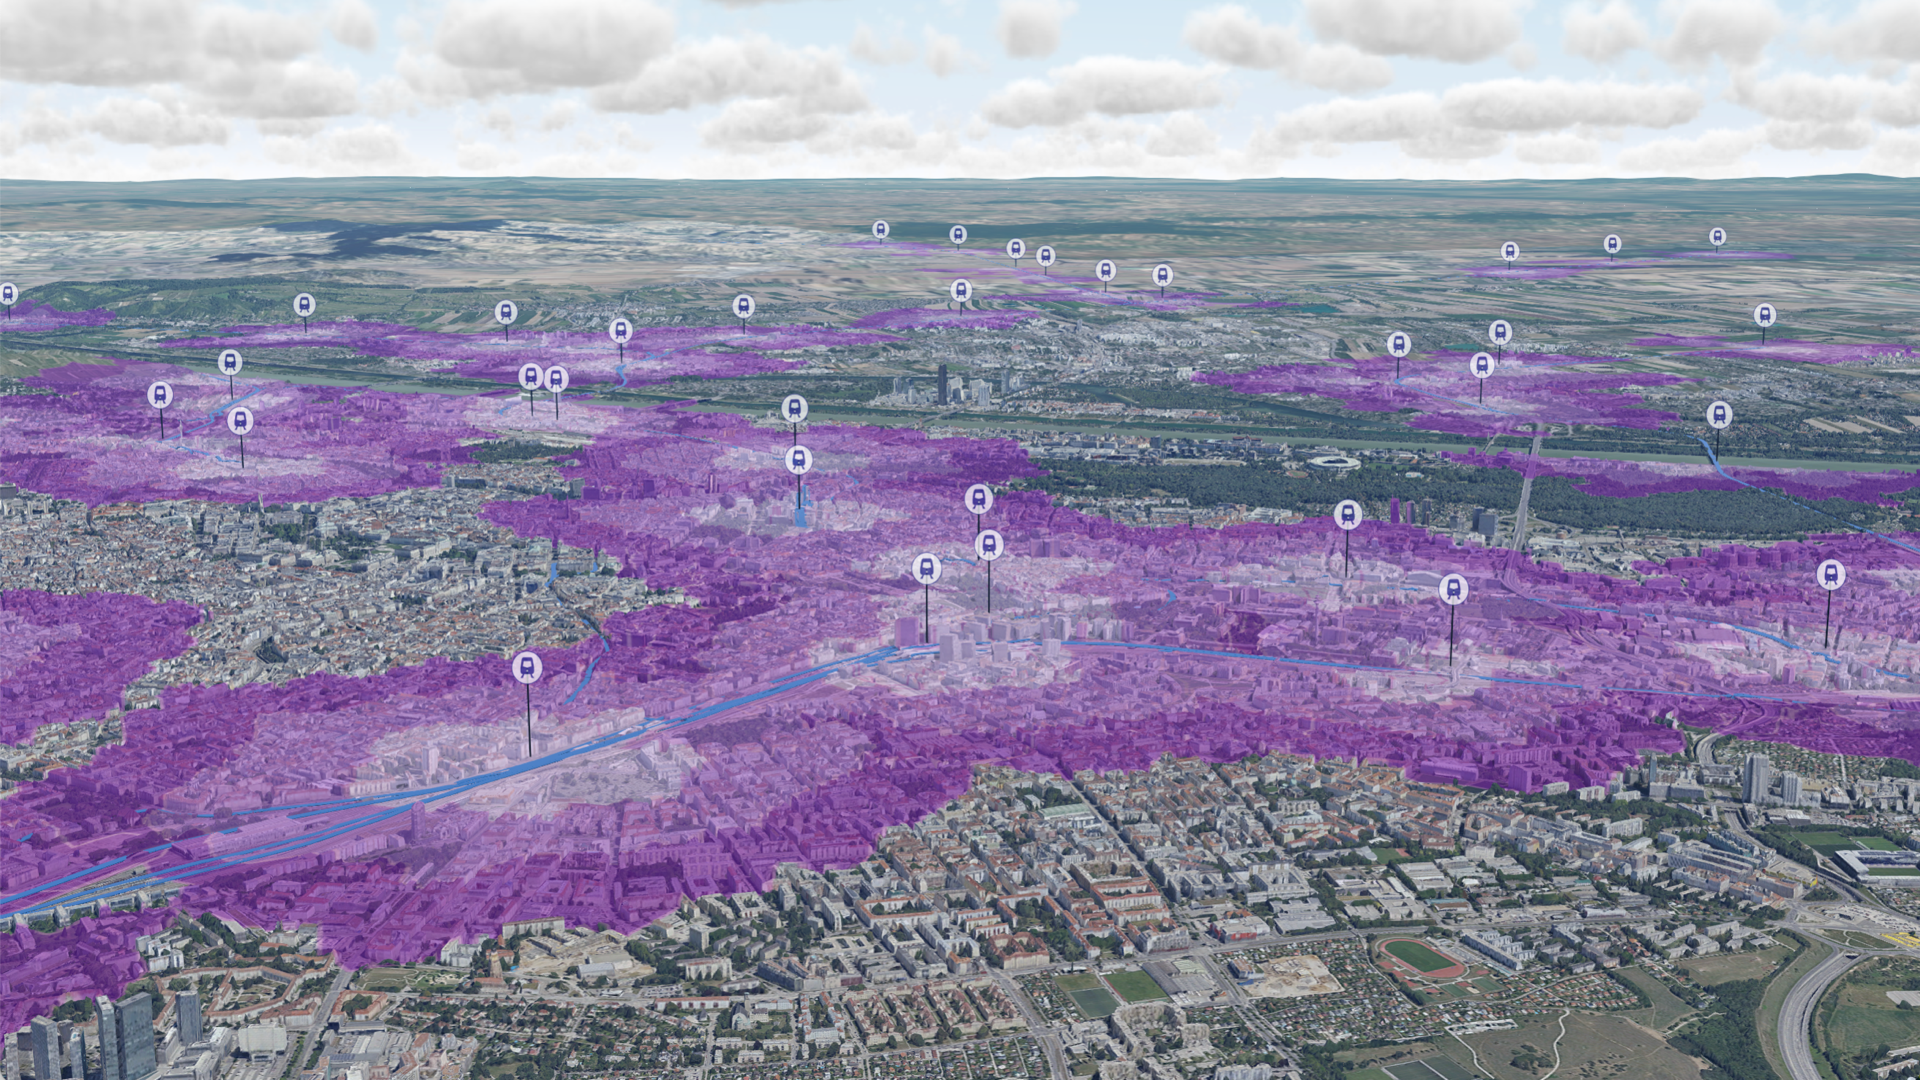
Style the results
Having generated all the necessary analysis results, we can now focus on styling the content to create an appealing and interactive 3D web scene that can be shared with others. As shown in the result image of the walk time analysis, the resulting layer is currently covering up the reality mesh. To enhance this, we can style the walk time analysis to be semi-transparent, allowing it to be directly visible over the integrated mesh. This approach enables us to experience the photorealistic buildings alongside the walk time categories simultaneously.
We also aim to display the number of people living in each of these areas. To achieve this, we can configure the popup to present all relevant information at a glance. Clicking a polygon now reveals how many people leave near a station.
Perform your own analysis
In this blog post, we demonstrated how to use the Analysis tools within Scene Viewer to enhance your 3D data with additional information. This was just one of many examples, and we encourage you to try it out for yourself.
How do you find the analysis tools within Scene Viewer? Are there any functionalities you feel are missing? Let us know in the comments or provide us feedback on the Scene Viewer community page.

Article Discussion: