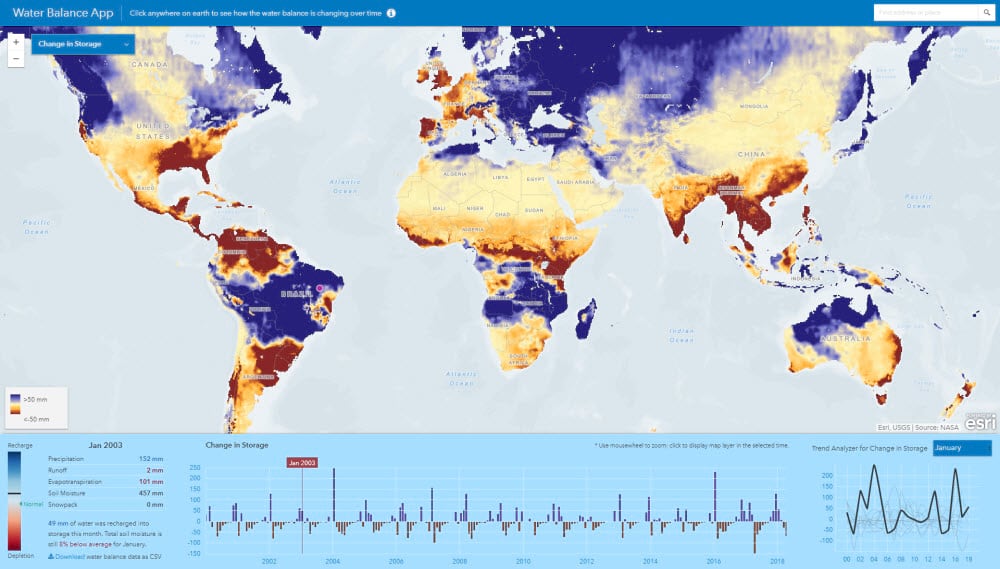
A new image service has been added to the Living Atlas of the World. It shows monthly change in water storage, as derived from NASA’s GLDAS dataset. Change in storage is calculated by subtracting the water output (runoff and evaporation) from water input (rainfall). Where the input is higher than the output, this means water is being stored in the landscape. Where output is higher than the input, storage is being depleted. This image service is time-enabled, allowing you to move through the seasons, month by month, and visualize the ebb and flow of water over the past 18 years.
Depletion is not necessarily a bad thing, of course. It is common for landscapes to store water during the rainy season, and dry out before the rains come again. The ecology of a region is adapted to this natural water cycle. A problem only arises when that cycle breaks. Perhaps the summers become too hot, or the rains come less often. Changes like these are becoming more common as global climate cycles are disrupted by anthropogenic influence. In order to help understand how our influence is affecting these regional water cycles, Esri built the Water Balance App. This application is combines all of the GLDAS layers into a single application with an intuitive interface and useful analytics.

By clicking on any point, you can see the full time series and begin to investigate it. The trend analyzer (bottom right) lets you extract the values for any specific month, so you can see if December rainfall is trending up or down, or if July evapotranspiration is increasing. This panel also lets you to see the seasonal variation during a normal year (by graphing the average for each month) or aggregate the time series into annual time steps to see the long term trend more clearly.
The Water Balance Panel (bottom left) shows how the different GLDAS parameters interact to define the hydrology of a landscape. It makes clear how the change in storage was calculated, and how it compares to what is normal for this month. It also shows how much soil moisture and snowpack have changed. This should be close to the total change in storage, but because there are also reservoirs, aquifers, and industrial withdrawals, these numbers don’t always match exactly.
What can I do with this layer?
The Change in Storage layer is an image service, which means you can access it from any app in the ArcGIS Platform, not just the Water Balance App. You can add it to maps you are building in ArcGIS Online, ArcMap, ArcGIS Pro, and even custom web apps of your own. It can also be used as an input to geoprocessing tools and Python scripts. The “Zonal Statistics as Table” tool is particularly useful for calculating the storage change in a watershed or other region of interest.

Commenting is not enabled for this article.