At the core of any effective transportation policy is reliable data and the Federal Highway Administration (FHWA) is responsible for assuring that adequate highway transportation data and systems performance information is available via the Highway Performance Monitoring System (HPMS) program.
HPMS is a national-level data collection program designed to assess the condition, performance, and usage of the United States’ roadways. Established in 1978, HPMS collects a wide array of data including traffic volume, road condition, capacity, safety features, and more. The data is gathered from state and local agencies and is meticulously standardized to provide a comprehensive overview of the nation’s highway system.
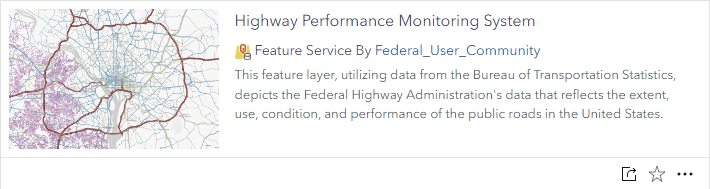
The US Department of Transportation’s Bureau of Transportation Statistics provides the HPMS data in a file geodatabase, with each state separated as a feature class. The Living Atlas team at Esri has published this data as one feature layer in ArcGIS Living Atlas of the World. The Highway Performance Monitoring System layer contains all states’ highway segments in one feature layer, are pre-configured with thoughtful symbology and informative pop-ups, and have its visibility scale set to an appropriate level for adequate performance while still seeing the context of an area of interest. This layer can be easily filtered to a state of interest or filtered by any one of the 100+ attributes.
Traffic Volume Attributes
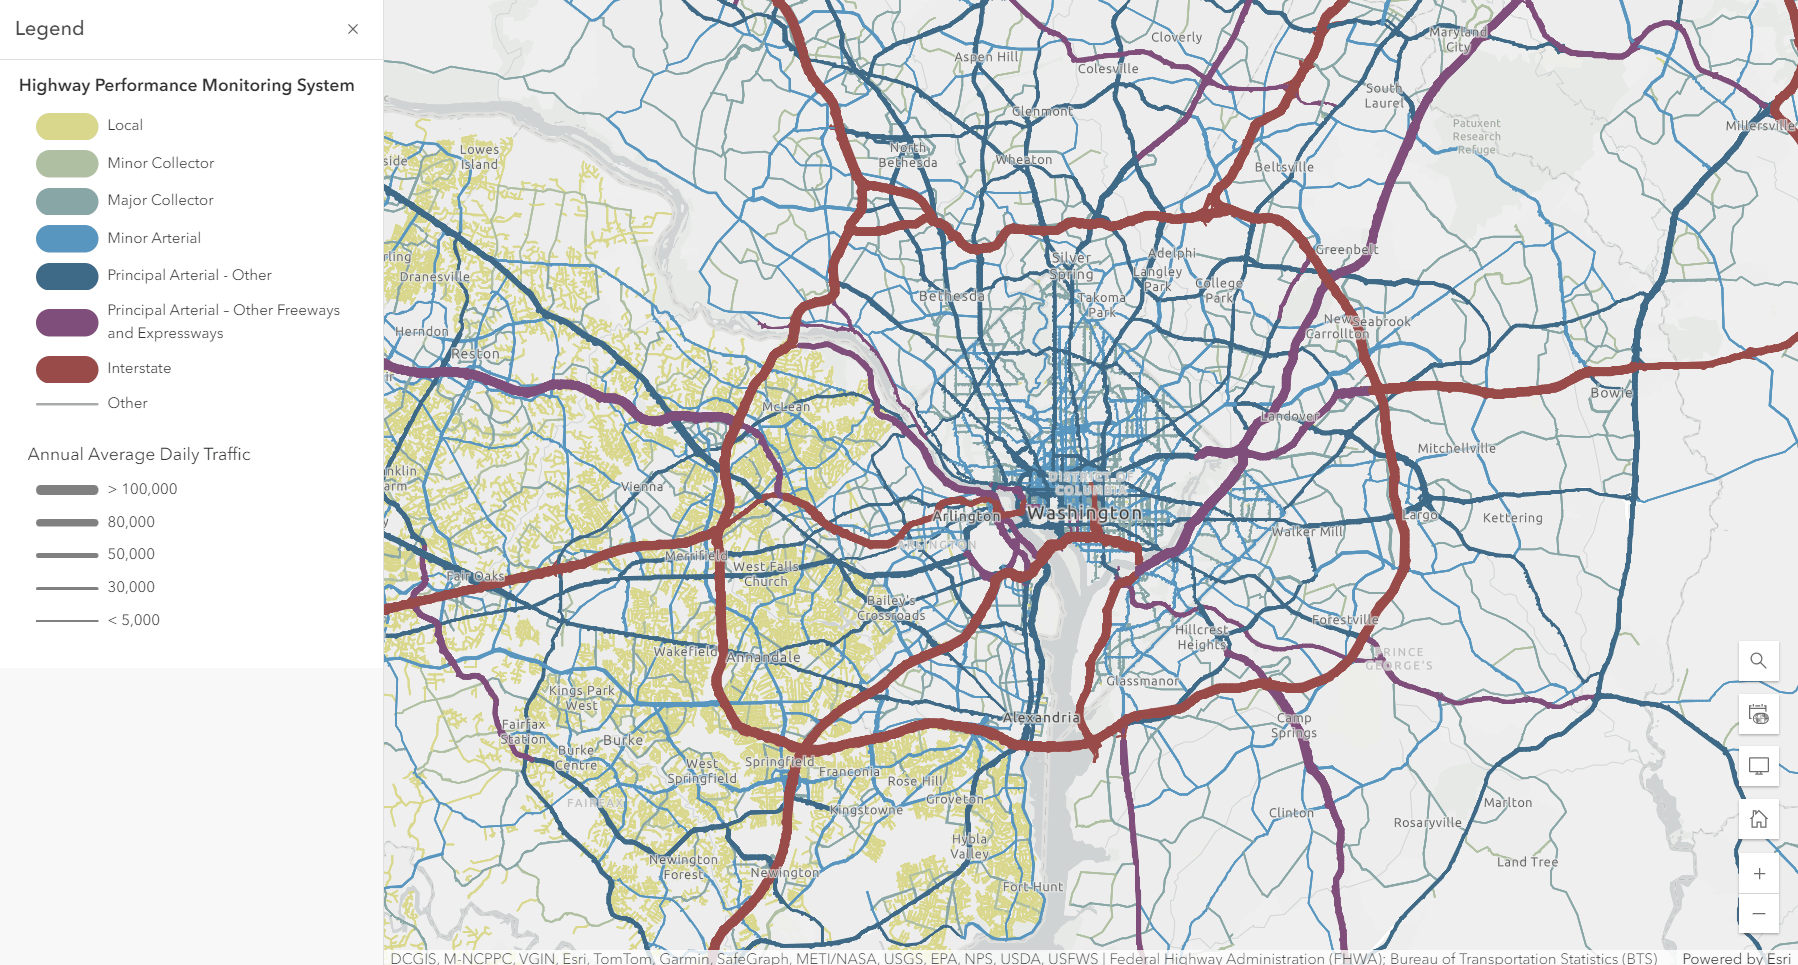
While there are over 100 attributes to get acquainted with in the HPMS layer, a large portion of these pertain to measuring traffic volume. The largest part of traffic volume from HPMS is Annual Average Daily Traffic (AADT). AADT identifies the average volume of traffic for the average one day (24-hour period) during a data reporting year at a specific location or specific segment of road (both directions & all thru lanes). AADT is used for analyzing and forecasting traffic volume, planning and designing of infrastructure, tracking traffic congestion, estimating road safety, and to allocate highway funds.
While AADT is essential for transportation planning, it can also be used in commercial real-estate when doing site evaluation for development and for marketing and pricing properties. AADT is also used by lawyers and law enforcement officials as a metric in accident cases and investigations [Source].
Another key attribute in traffic volume is annual vehicle miles traveled (AVMT). AVMT is a measure used in transportation planning for a variety of purposes. It measures the amount of travel for all vehicles in a roadway segment over one year period. AVMT is calculated by multiplying the average annual day traffic (AADT) by the length of the roadway segment.
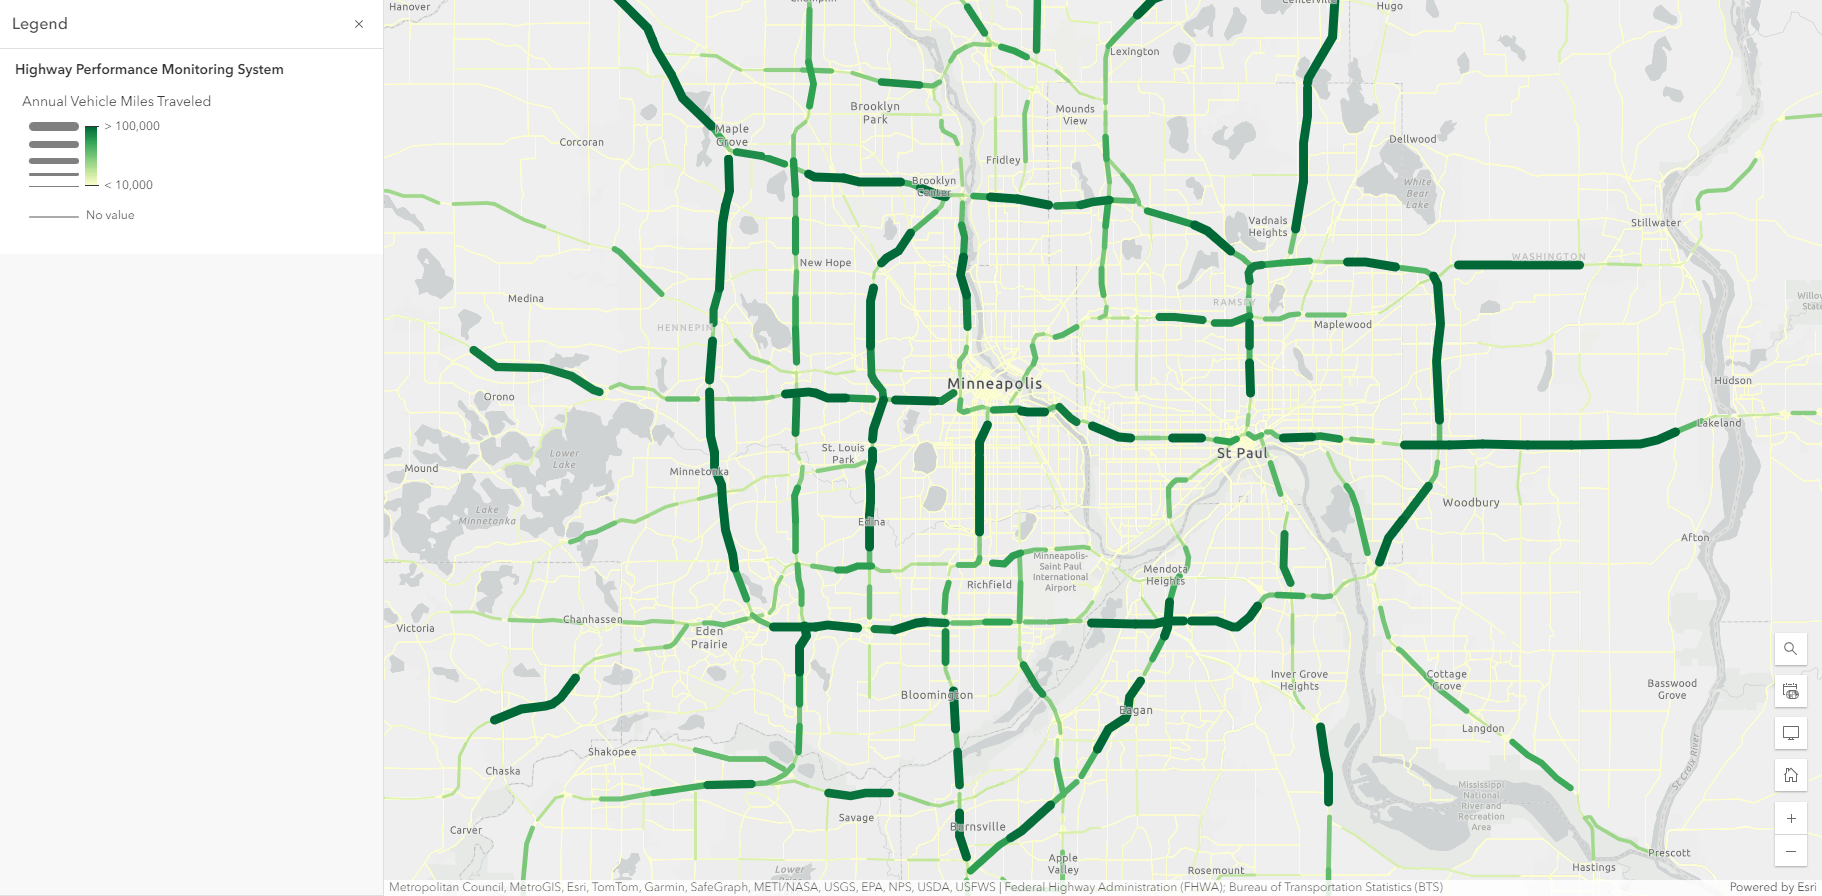
According to the Texas A&M’s Transportation Policy Research Center, Vehicle Miles Traveled has many use cases, such as:
- Assess the differences in travel demand and impact between regions and other states.
- Project future revenue streams from fuel taxes and proposed VMT fees.
- Compare personal travel and freight/commercial vehicle travel.
- Project future congestion levels.
- Estimate the amount of travel resulting from local residence and freight activity versus external travel.
- Assess the impact of various population forecasts.
- Support many more measures of interest for transportation planning.
Road Condition Attributes
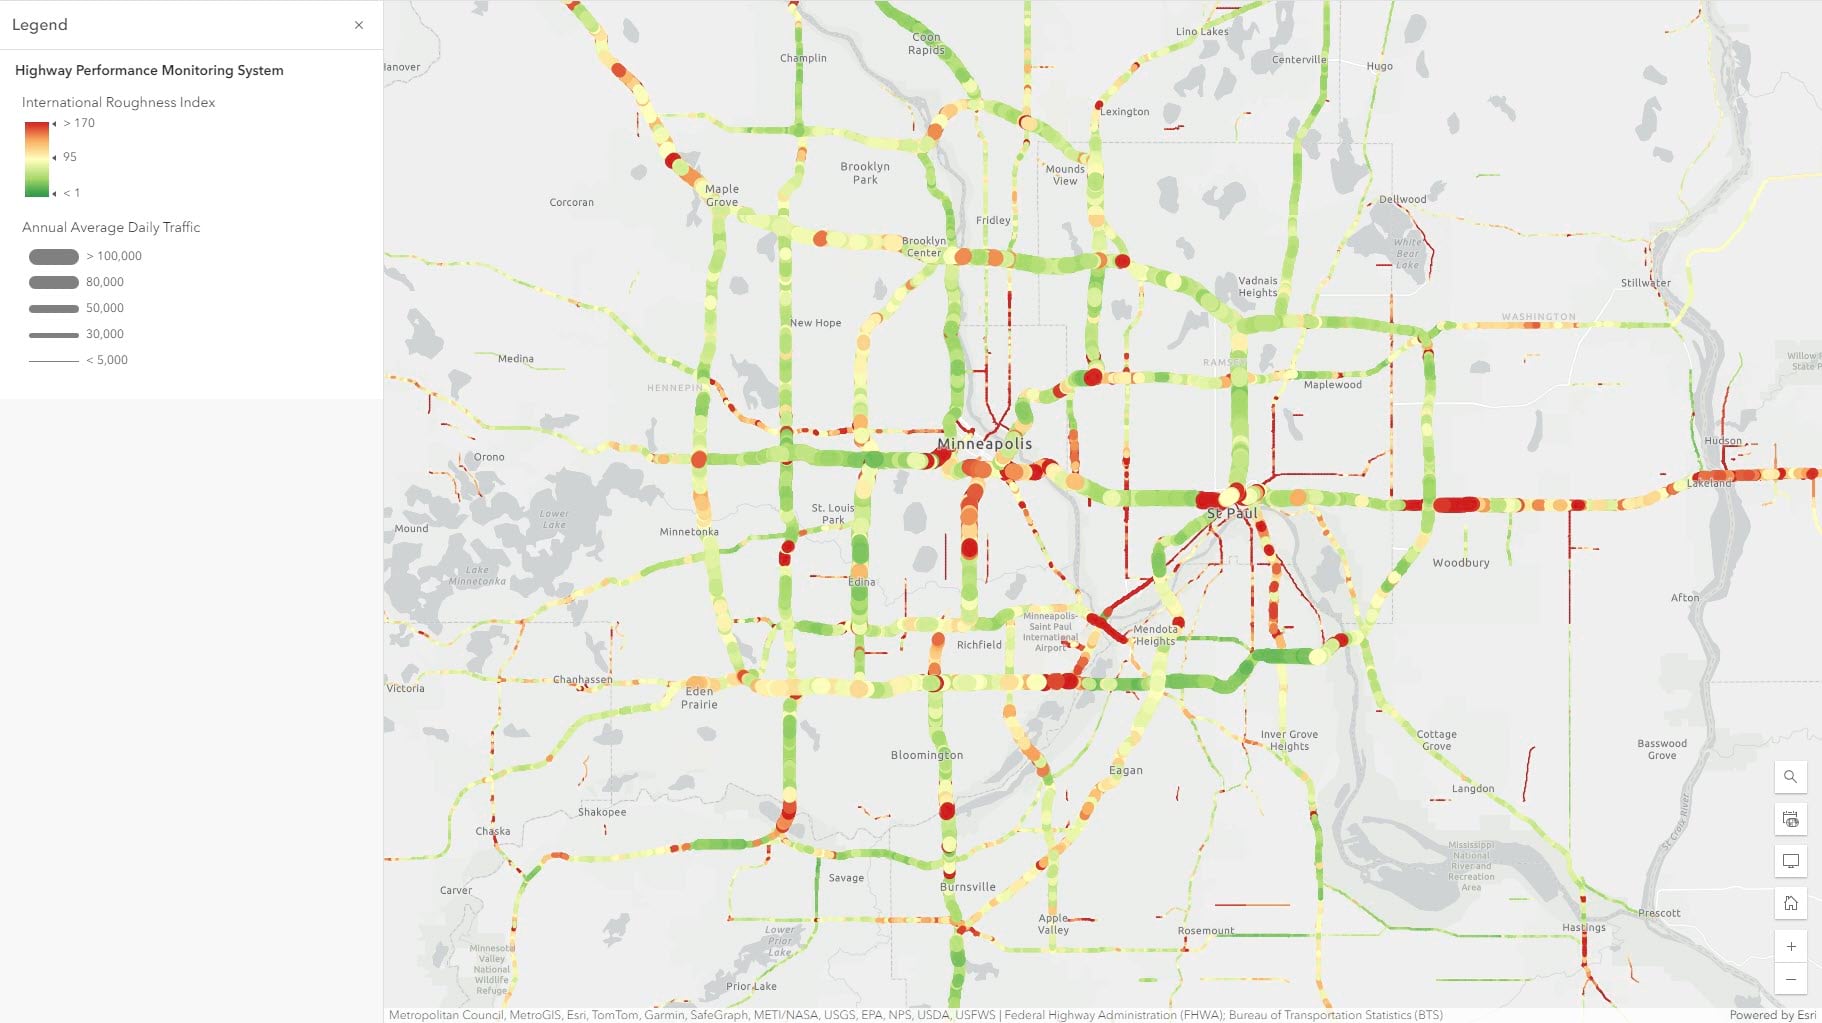
Other major components of the HPMS program are road condition attributes. One of the most essential attributes to measure road conditions is the International Roughness Index (IRI). According to FHWA, IRI is the road roughness index most commonly used worldwide for evaluating and managing road systems. Road roughness is the primary indicator of the utility of a highway network to road users. IRI is defined as a statistic used to estimate the amount of roughness in a measured longitudinal profile. The IRI is used to monitor overall network condition, assess previous treatment performance, and assist in determining future project locations and treatment types.
How will you use this layer?
The HPMS layer is a vital dataset for making informed, data-driven decisions for transportation policies. The data the FHWA provides through the HPMS program enables GIS professionals to analyze and visualize this data to create a comprehensive and accurate picture of road conditions, traffic patterns, and infrastructure needs. The HPMS layer along with hundreds of other transportation related layers in ArcGIS Living Atlas can be used to create thought-provoking maps, perform analyses to solve complex problems, and as well telling interesting stories.
Looking for existing web maps as a starting place to map traffic volume or road conditions? Use any of these maps to get started in Map Viewer, or in ArcGIS StoryMaps or Instant Apps.
How do you see your organization using the HPMS content in Living Atlas? Looking to find which roadways will get priority when it comes to pothole maintenance? Trying to determine which future traffic forecast for your area? Share on the Esri Community’s ArcGIS Living Atlas space or nominate your content to the Living Atlas.


Article Discussion: