Ookla Speedtest for Global Broadband Performance is available within ArcGIS Living Atlas. This ready-to-use layer shows global fixed broadband and mobile (cellular) network performance metrics in zoom level 16 web Mercator tiles (approximately 610.8 meters by 610.8 meters at the equator). Download speed, upload speed, and latency are collected via the Speedtest by Ookla applications for Android and iOS and averaged for each tile. Measurements are filtered to results with GPS-quality location accuracy. At the end of each quarter the data is downloaded from github.com/teamookla/ookla-open-data, processed, and published to ArcGIS Living Atlas by the Esri Telecom Team.
The layer is a best available aggregation of the entire series of Ookla datasets. This means that for each tile that data is available, the most recent data is used, while tiles with older results are also maintained. So for instance, if data is available for a tile for Q1 2019, the first release of the dataset, but has not seen an update in any subsequent releases, it is retained. However, if a tile with Q3 2024 results has new results in the Q1 2025 release, the tile is updated to the most current data and the older data is discarded. This aggregation method provides for the most extensive geographic expanse of source data.
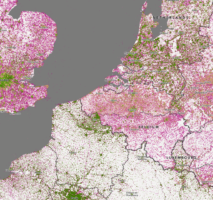
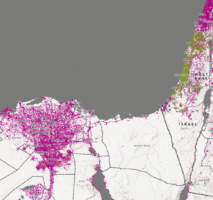
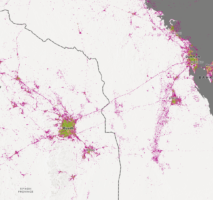
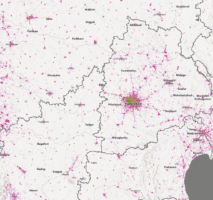
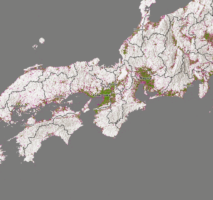
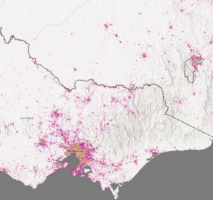
By default, the maximum extent of the layer is set to zoom level 8, State/Province. The maps below explore fixed broadband Speedtest results at the zoom level 8 scale for different locations around the world. You can explore the web map and bookmarks here.


The Arcade Expression
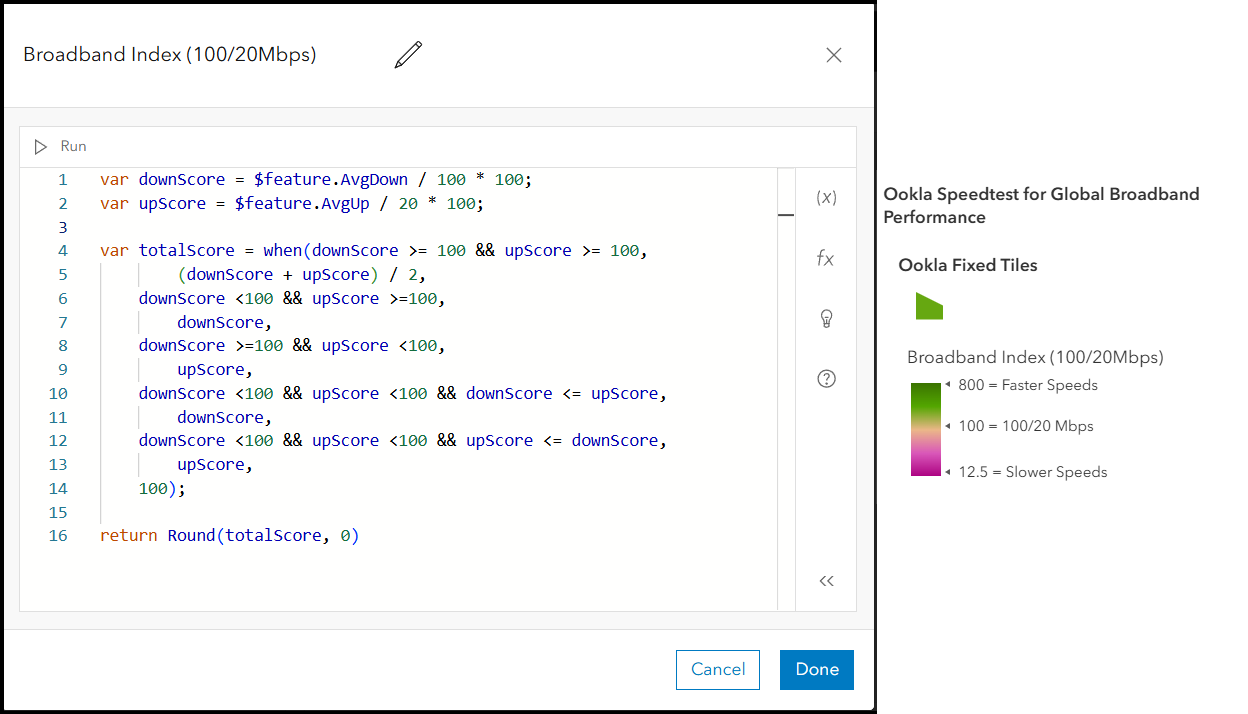
The default visualization for the layer is the “broadband index.” The broadband index is an Arcade expression that creates a score based on both the average download speed and the average upload speed. The index uses a value of 100 to represent a tile that meets a standard of 35 megabits per second (Mbps) download and 3 Mbps upload for mobile broadband, and a standard of 100 Mbps download and 20 Mbps upload for fixed broadband.
To combine the average download speeds and upload speeds into a single score, we first create a sub-index score for each. So, for example, with fixed broadband, the download index awards 100 points to the average download speed if it is 100 mbps. If the tile has an average download speed of 200 mbps, it awards 200 points. If the tile has a speed of 80 mbps, it awards 80 points. Similarly, the index gives 100 points to the average upload speed if it is 20 mbps. If the tile has an average upload speed of 40 mbps, it awards 200 points. If the tile has a speed of 5 mbps, it awards 25 points. The average of the two scores is used if BOTH scores are 100 or higher. If not, the lower of the two scores is used.
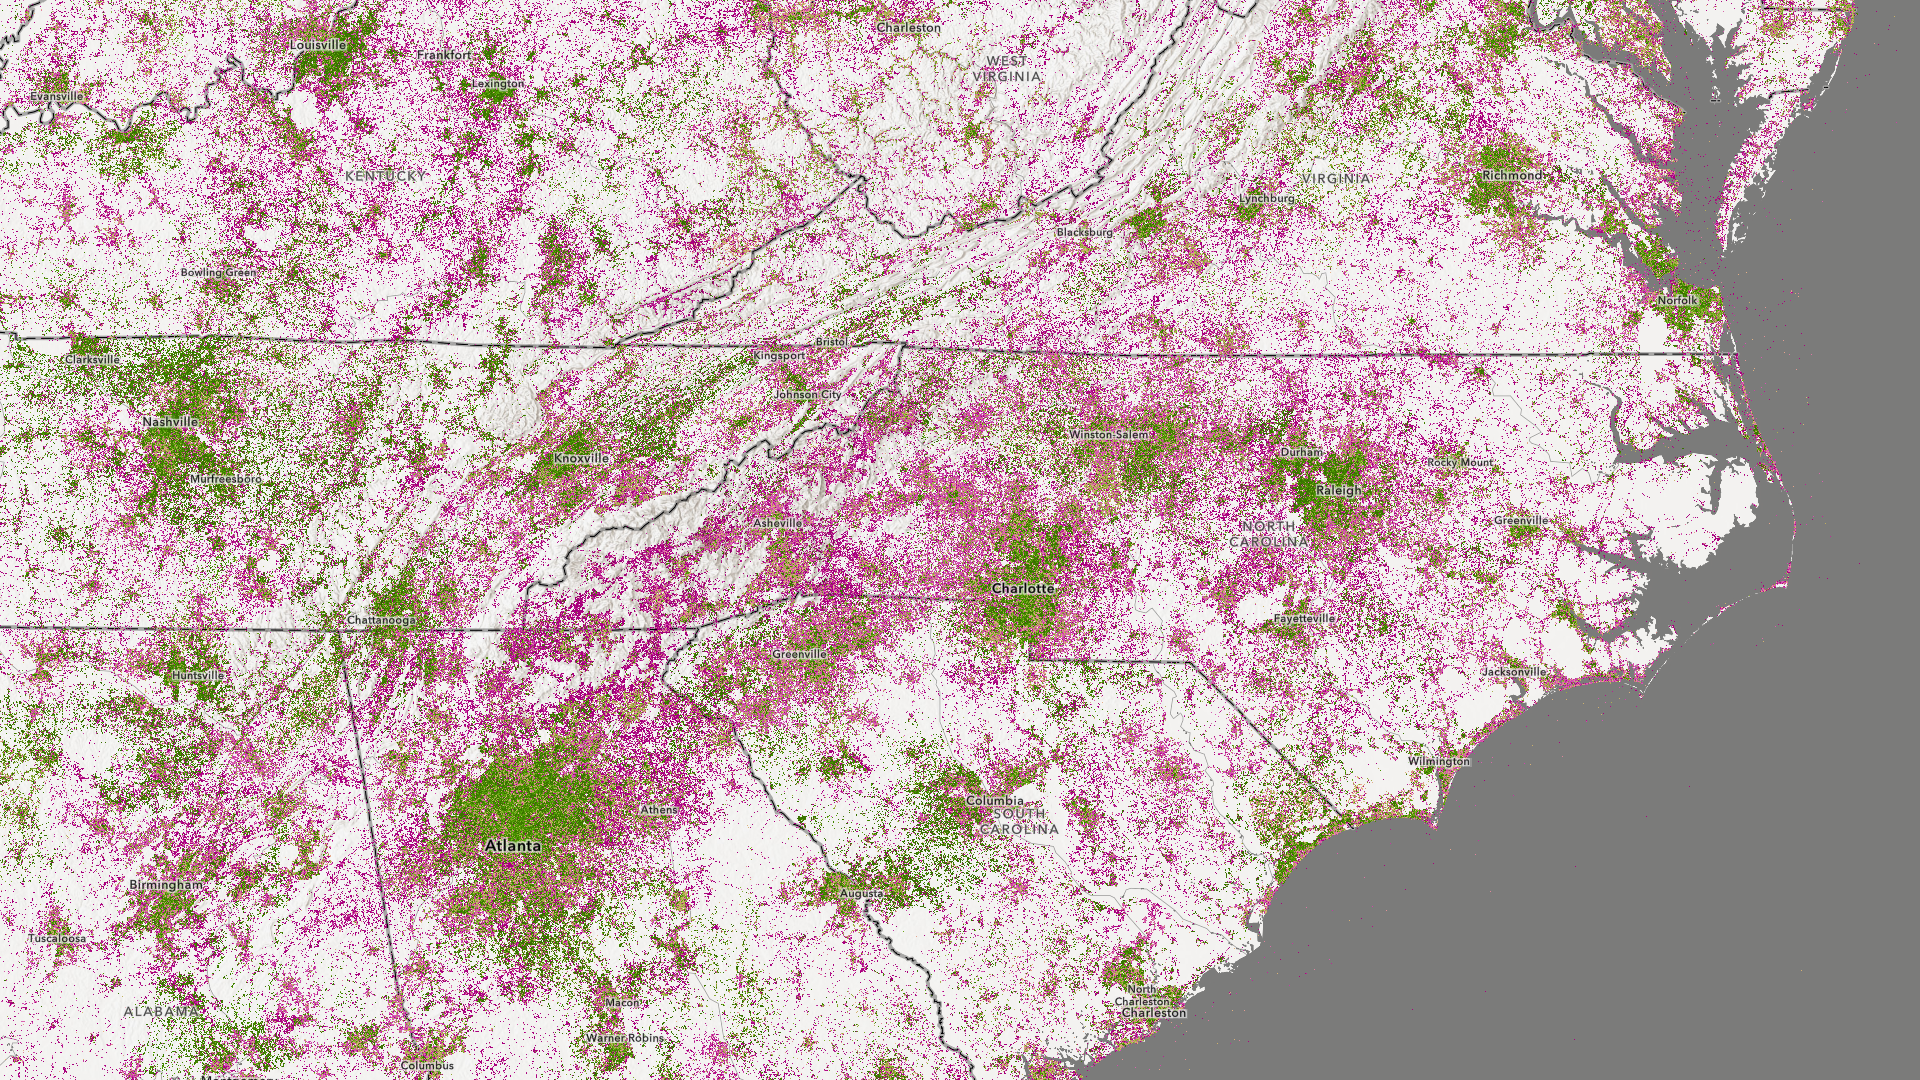
The symbology for the layer uses an Above and Below theme, centered on a score of 100, where tiles with faster speeds are shown in green and tiles with slower speeds in magenta.
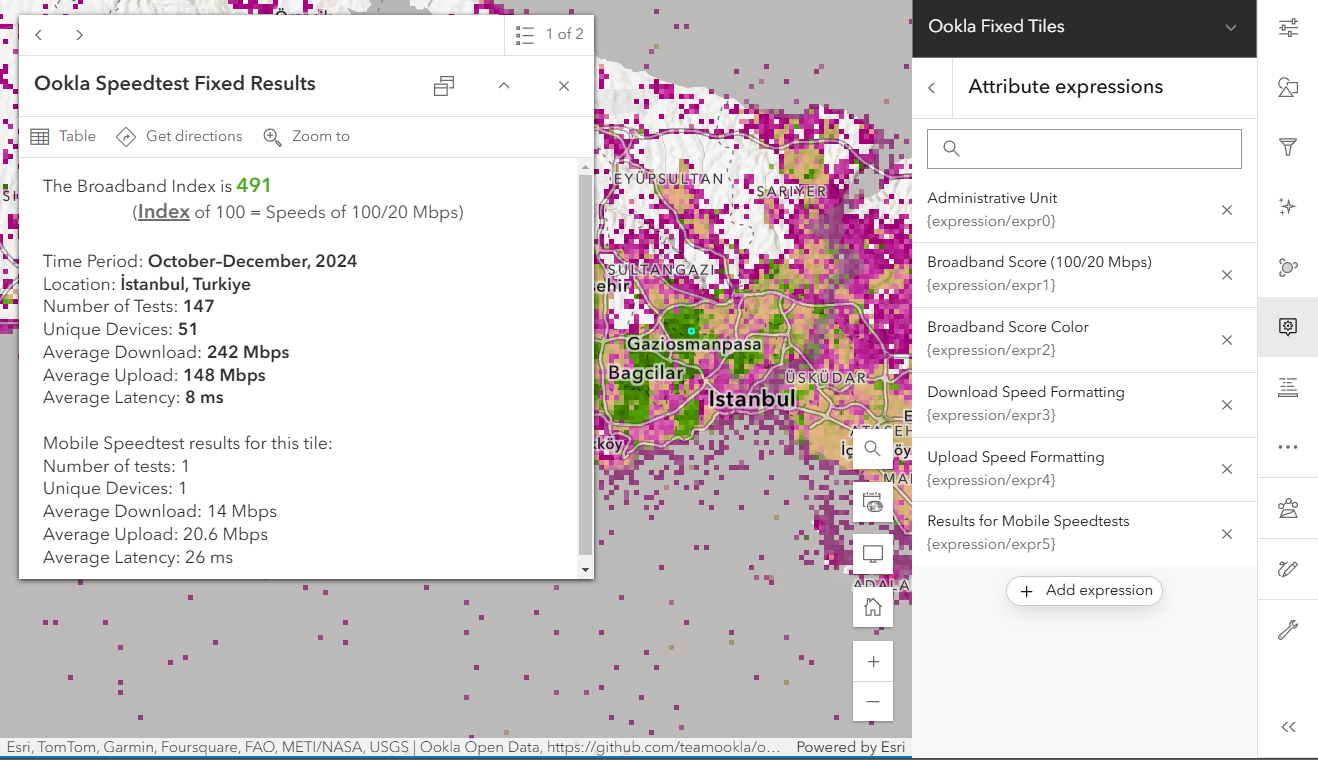
The popup for the layer displays the Broadband Index using the color from its symbology. A Broadband Index greater than 100 in green, one less than 100 in magenta. Additionally, the popup includes the year and quarter the results were captured in, the location of the tile based on the intersect with the World Administrative Divisions layer, the number of tests taken, the number of unique devices, the average download and upload speeds in mbps, and the latency in milliseconds (ms). And in order to provide for comparison, the popup for the fixed results also indicates whether there are mobile tests in the same tile, and vice-versa, the popup for the mobile results indicate whether there are fixed results in the tile. In total, there are six attribute expressions used in the popup.
Mapping the Broadband Landscape
Ookla Speedtest for Global Broadband Performance is an important layer for mapping the broadband landscape. The data provides a glimpse of where mobile wireless and fixed wireline networks exist, and the quality of the connection to the World Wide Web at those locations. The data can help uncover regional broadband characteristics from around the world. In some parts of the world, mobile Speedtest results far out number fixed Speedtest results. In others, there is no wireless connection.
Additionally, the Arcade expression for the Broadband Index can be modified to meet different definitions of broadband. In the expression shown above, lines 1 and 2 are where the download and upload speeds are captured. In this example, 100 and 20 are used to index the download and upload speeds, the current definition of broadband in the United States. These values can be changed to meet any definition of broadband.
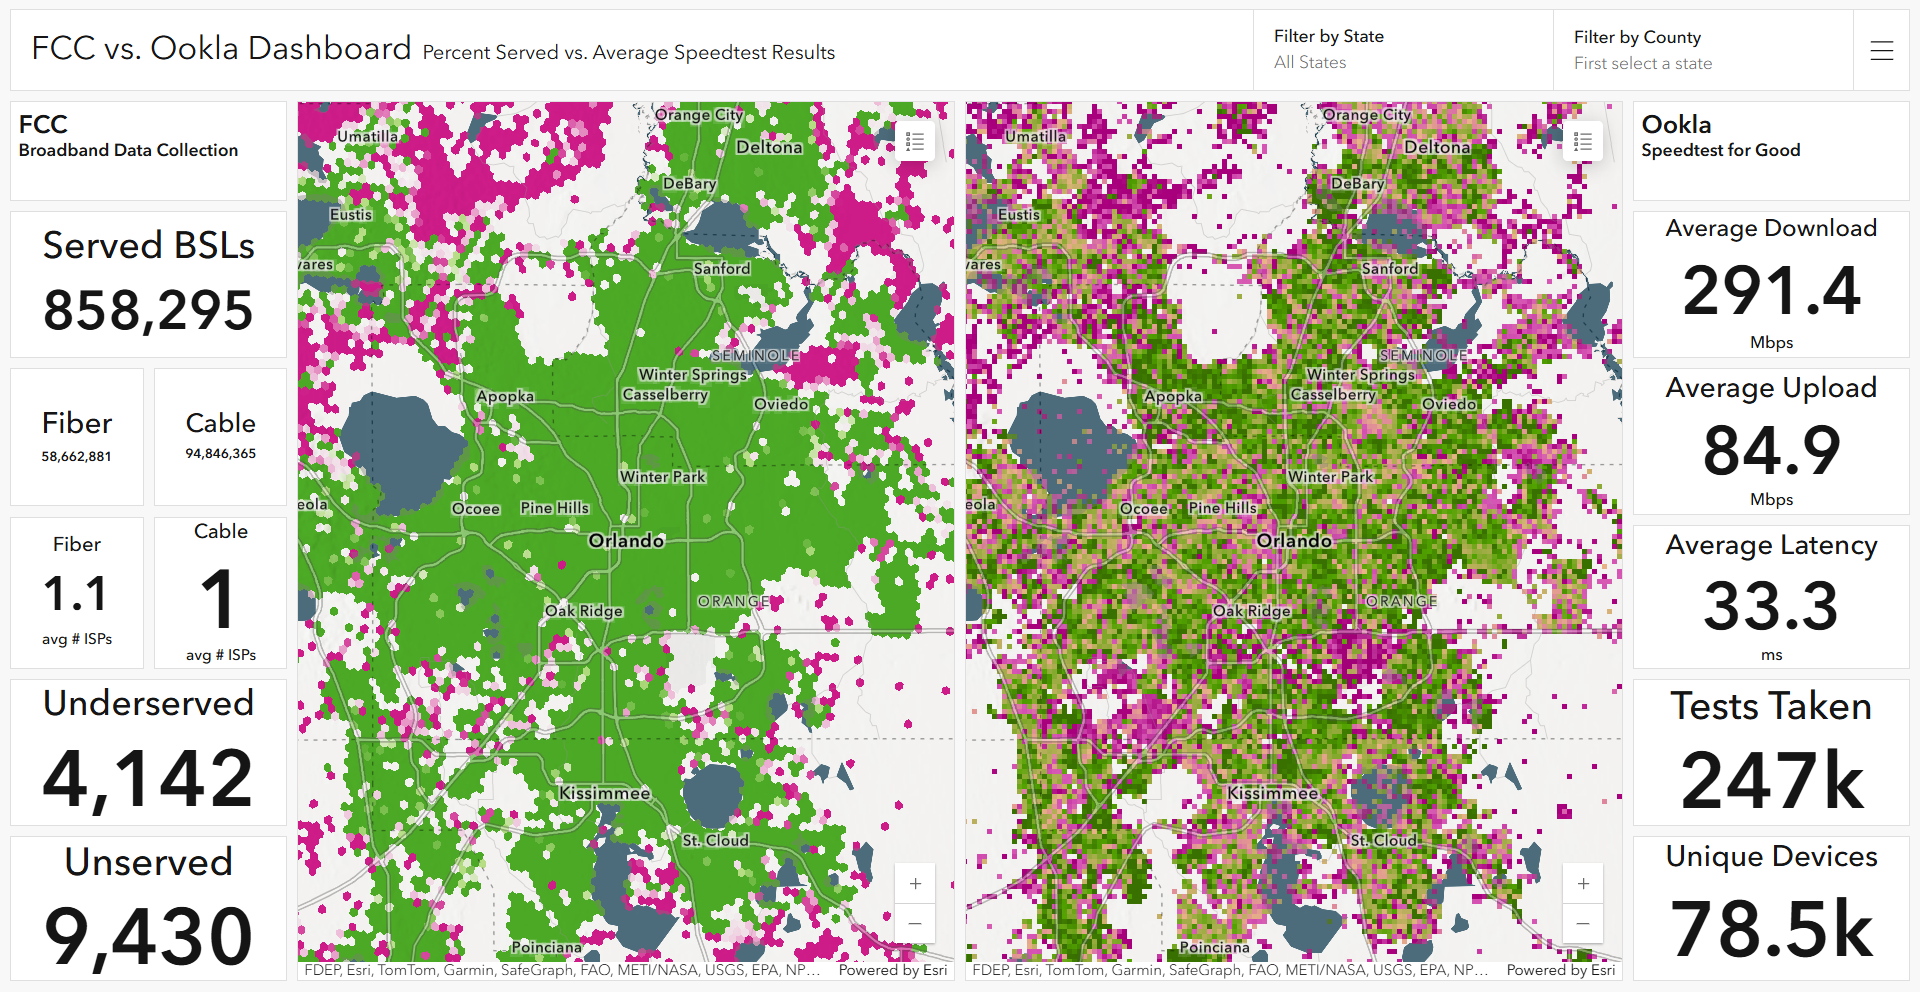
And finally, combine the layer with others from the Living Atlas and you can uncover even more. For example, the dashboard below compares the FCC Broadband Data Collection with Ookla Speedtest for Global Broadband Performance. The dashboard compares the advertised speeds as reported to the Federal Communications Commission with the actual speeds as captured in an Ookla Speedtest. You can check out the dashboard here and additional visualizations of the Ookla data here.
We look forward to seeing what you do with the layers, welcome your feedback, and wish you happy broadband mapping.


Article Discussion: