Update: As of February 2023 these two basemaps are out of ‘Beta’ and included in the Basemap Gallery for US users. Users or Organizations in other regions or with custom map galleries can add the basemaps themselves. They can still be found in the ArcGIS Living Atlas of the World.
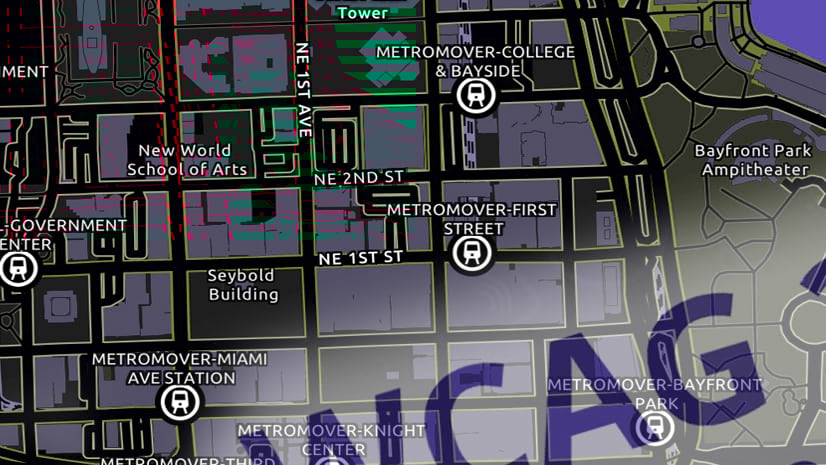
Early last year, I completed a set of prototypes for building accessibility into basemaps by using more contrasting colors. Starting this year, we are adding two of them (as ‘beta’) to our suite of basemaps. They are called ‘Enhanced Contrast’, and they are based on my ‘Accessible’ and ‘Accessible Dark’ prototypes, with a few design ‘tweaks’.
Here is a link to the Enhanced Contrast web map and tile layers in the ArcGIS Living Atlas of the World
… and to the Enhanced Contrast Dark.
They are available in Web Mercator and WGS84. Initially they will not be appearing in the drop-down basemap galleries, but they will be available through the Living Atlas, and you can add them to a custom basemap gallery if you have one set up.

Hopefully you will find them useful, but remember that they are only as effective as the work you do on top of them. In this blog, I’m looking at ways you can integrate them with your maps.
Accessibility
The purpose of a basemap is to sit in the background and provide a foundation for you to build on. The basemap may meet WCAG/Section 508 requirements, but the information you put on top needs to as well, and that raises some issues.
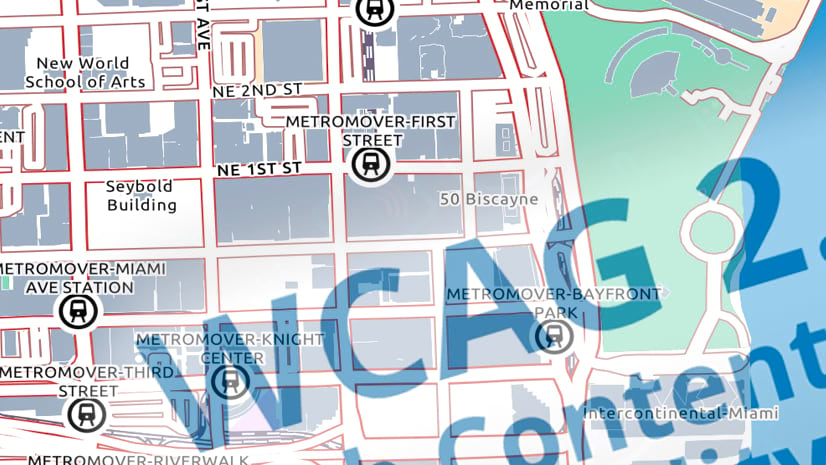
One feature of an accessible map is that contrast is increased. That pushes some of the basemap detail up into the visual space we normally reserve for your information. So, if the basemap is getting in the way of what you want to show, how do you get around it?
Here are some options.
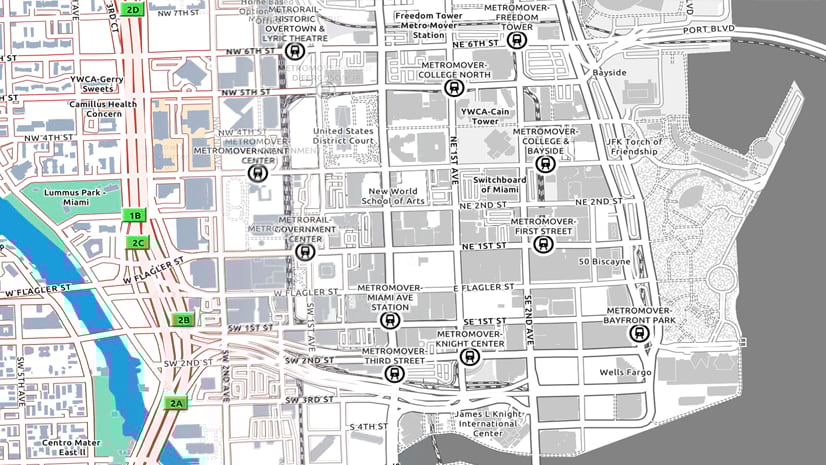
Go Gray
This is an obvious choice, and I built some gray prototypes. We are not retaining these, but we have made adjustments to these versions so that they can be switched to grayscale effectively. It leaves you with the rest of the color palette to play with!
- Add one of the basemaps to your web map.
- With the layer selected, go to ‘effects’ in the Sidebar on the right.
- Switch on the ‘Grayscale’ option
(Note: This option is not available in the ‘Classic’ map viewer, or currently in ArcGIS Pro).

If you want something with a bit more impact though, there are still some things you can do. Using the Vector Tile Style Editor, you can adjust the basemap details.
Customize the basemap
Choose either the light or dark ‘Enhanced Contrast’ basemaps as your starting point. Both are ‘sandwich’ maps (with a base and a reference layer), so decide which component you want to work with, and save a copy*. Open this into the Vector Tile Style Editor and get to work.
Here are two approaches:
Remove Features
I’m using the ‘light’ version for this exercise. It’s likely that you don’t need all of the information in the basemap, so consider switching some of it off! You can be surgical about this if you want, by going into individual layers. More likely you can attack the layers at the group level.
So, as an example, lets remove forest and parks – Go to ‘Edit Layer Styles/Natural/Forest or Park, and switch that whole group off:

Remove colors
When I designed the Enhanced Contrast basemaps, I tried to restrict colors to groups of information. So, for example, stronger reds are used for roads and highways. If I changed this to something else, that would leave reds available to me for overlaying my own information.
Once again, I could work through the individual layers to make these changes, but the ‘select by color’ option offers me a short cut. By clicking on the color swatch I can find which layers they apply to. When you find the color swatch you want it will list the features employing that color (Check down the list to make sure there is nothing unexpected there, then deselect it if there is).
I’m changing the road casings to a steel gray (there are two different reds used for road casings).

That should be safe with regard to color-vision-deficiency, but I’ll use a simulator to check it anyway, and I’ll examine the map at all scales to make sure that I haven’t introduced an unexpected clash. My new road colors are similar to buildings, but the two features are still distinctive.

The red part of the color palette is available for my use now.
Use both approaches
There is no reason why you shouldn’t combine these two approaches. Remove any irrelevant information, then make style adjustments to open up a color for your use.
You want your information to be prominent, so make sure you build it with strong colors and bold shapes. Become familiar with WCAG requirements so that the combination of basemap and your information are in compliance. If you are planning to add labels to your information, consider whether it is worth removing some from the basemap (or even switching them off altogether).
Going forward
My original prototypes will remain available until at least December 2022 if you have used them in any of your maps. However, I would encourage you to switch to these versions when it is convenient. Please contact me directly if you have any problems with this cut-off date.
Note:
*As of July 2022, the Enhanced Contrast basemaps are available as style options within the Vector Tile Style Editor. Look for them in the ‘Base’ and ‘Label/Reference’ options.
You can still save the layers to your account before opening the Style Editor if you prefer, but it requires some gymnastics:
- Open the web map details page. Scroll down to ‘Layers’ and click on either the base layer or the reference layer (depending on the changes you want to make). This will open the details page for that layer.
- Open it into Map Viewer Classic (make sure you are signed-in to your account). It will create a new web map.
- Select and copy the layer
- Go to ‘Save Layer’ (In the attached drop-down menu, not at the top of the map). Change the name please!.
- You can close the new web map without saving.
- Now you should be able to access that layer from the ‘My Styles’ option in the Vector Tile Style Editor.

Article Discussion: