In the news: According to the United States Environmental Protection Agency (EPA), coastal areas are especially vulnerable to the effects of climate change. These changes include sea-level rise, increased storm activity causing storm surge and storm damage or erosion.
While coastal communities make up only 10% of the U.S. land mass, nearly 40% of the population can be found in coastal communities. An estimated $1 trillion worth of property is located within 700 feet of the coast and by 2050, it is estimated that up to $106 billion worth of coastal property will likely be impacted if current trends continue.
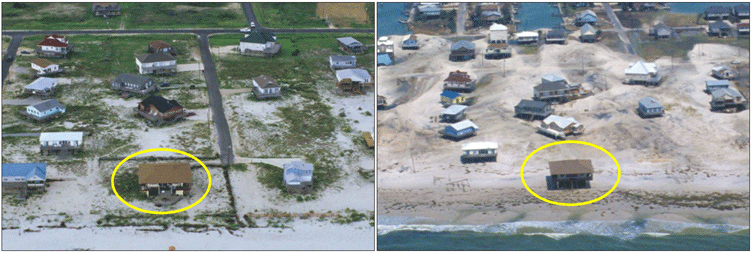
The highlighted house below shows coastal property change from 2001 (left) to 2005 (right). Photo: USGS.
Make a coastal property loss map
ArcGIS Living Atlas of the World includes authoritative live feeds and other content that helps you learn more about coastal changes and property loss over time. In this tutorial we will:
- Use World Imagery Wayback to create and save a map link showing coastal change.
- Use Map Viewer to make a web map with the Wayback imagery chosen above and add Regrid parcel boundaries from ArcGIS Living Atlas.
- Use ArcGIS Instant Apps to configure an app using the map above with swipe capabilities to visualize change over time.
Follow these steps to make your own coastal property loss map in a minute, maybe less.

Use Wayback
Wayback imagery is a digital archive of the World Imagery basemap, enabling users to access more than 100 different versions of World Imagery archived over the past 10 years. Each record in the archive represents a version of World Imagery as it existed on the date it was published.
The World Imagery Wayback App offers a dynamic Wayback browsing and discovery experience where previous versions of the World Imagery basemap are presented within the map, along a timeline, and as a list. Versions that resulted in local changes are presented to the user based on location and scale.
Step 1 — Go to the ArcGIS Living Atlas website and open the Apps tab.

The Apps tab opens to a collection of Living Atlas apps, each intended to highlight and leverage different content.
Step 2 — Scroll down on the page to locate World Imagery Wayback and click View Application.

For this example, we’ll examine property loss on Nantucket, Massachusetts. At the end of this tutorial, additional locations will be listed for further exploration.
Step 3 — In the Wayback Imagery App, use Search to find Nantucket Island and zoom to the southeast of the island to find the intersection of Sheep Pond Road and Head of Plains Road. As a shortcut, copy and paste the coordinates below into Search to zoom to the area of interest.
-70.187185°, 41.264595°
Or use this link captured from the Wayback App to zoom to the area of interest:
https://livingatlas.arcgis.com/wayback/#active=60013&mapCenter=-70.18693%2C41.26473%2C18
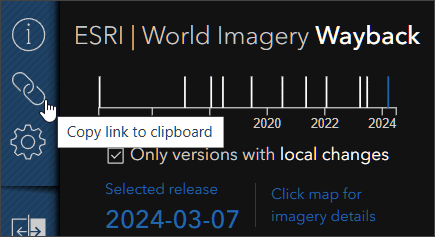
Tip: to capture a link to any location or current Wayback App settings, use the link tool found along the left side.
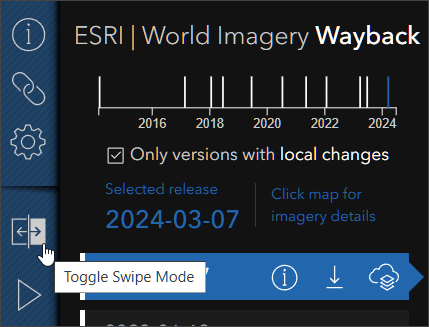
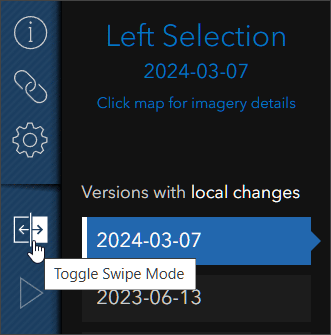
Step 4 — Click Toggle Swipe Mode from the tools found on the left side of the app.
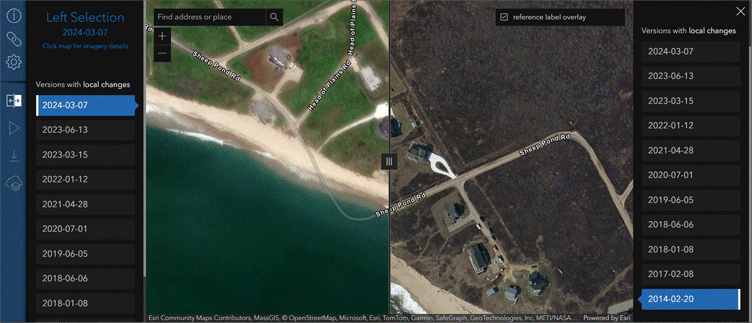
Step 5 — Choose the comparison Wayback Imagery release dates for swipe by selecting a recent date from the left pane, and an older date from the right pane. In the example below we’ve chosen the most recent available in the left pane, the oldest available in the right pane.
Step 6 — Use the link tool, mentioned in the tip above, to capture the current swipe settings. The link can be shared with anyone and will open the Wayback app in swipe mode at the location with the selected imagery release dates.
Congratulations! You’ve created a coastal property loss map in under a minute. In the next sections you will save the layers to a web map and use Instant Apps to configure an app that uses swipe to compare the two imagery releases.

Use Map Viewer
In this section, you will create a web map using the two dates of imagery selected above, then add Regrid USA Nationwide Parcel Boundaries via ArcGIS Living Atlas. This section continues the workflow from the preceding section.
Step 1 — Click the Swipe tool to toggle out of swipe mode.
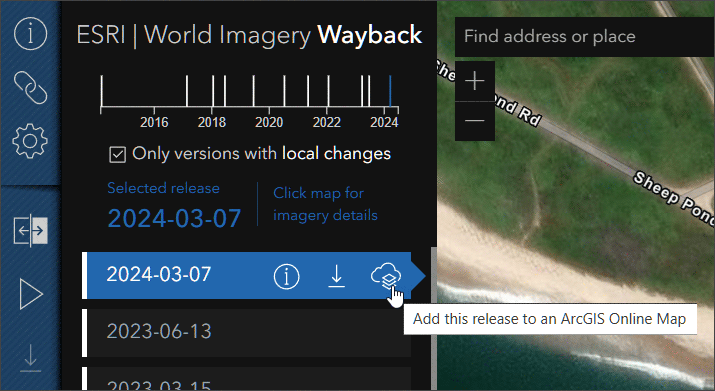
Step 2 — Select the most recent date you want to use and click Add this release to an ArcGIS Online web map. In this example, the 2024-03-07 version is used.
Step 3 — Do the same as in Step 2 with the oldest date that you want to use. In this example, the 2014-02-20 version is used.
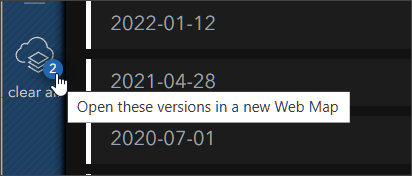
Step 4 — Once you have the two dates selected, click Open these versions in a new web map.
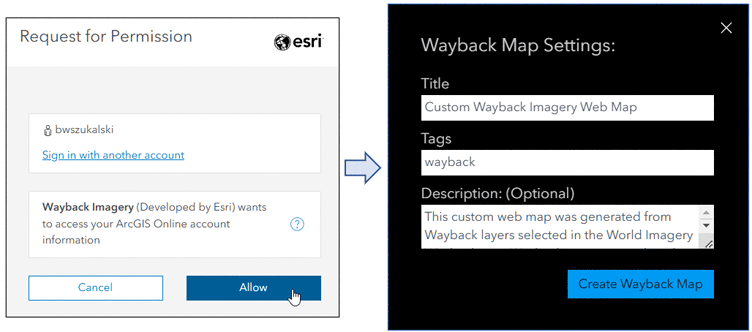
Step 5 — You’ll be prompted to allow access, then to add a title, tags, and description for the new map.
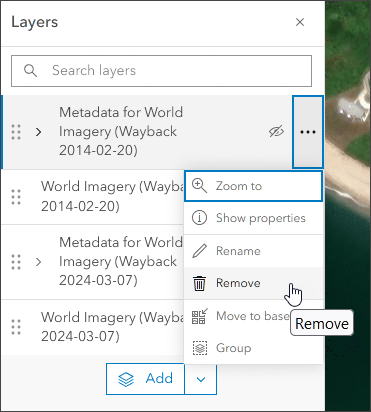
Step 6 — Once the web map item is created, open it in Map Viewer. For this example we do not need the metadata layers and they can be removed. Click the options (…) then choose Remove.
Step 7 — Ensure both imagery layers are visible. Reorder the layers so that the most recent is on top. Click Save when finished. Your map and layers should look like that shown below:
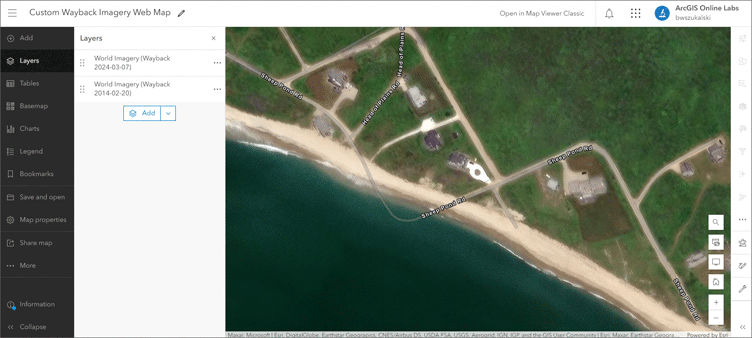
Next, we will add the Regrid USA Nationwide Parcel Boundaries to the map.
Regrid provides parcel boundaries and detailed information about parcels for the entire U.S. While you can download premium detailed parcel information from links in the Regrid pop-up, for this example all we need to do is visualize the parcel boundaries by adding it to the map via Living Atlas.
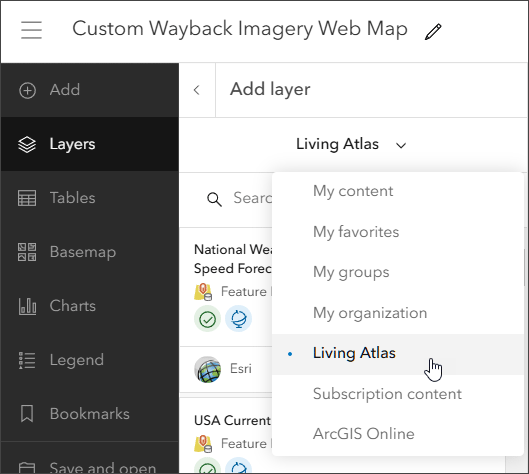
Step 8 — There are two ways to add layers from the Contents (dark) toolbar:
(a) Click Add, then Browse layers, or (b) Click Layers, then Add. Choose Living Atlas from the drop-down.
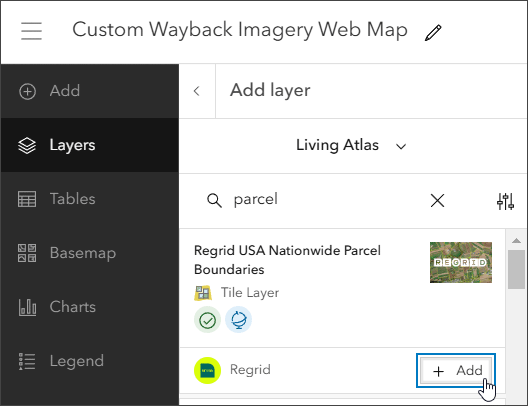
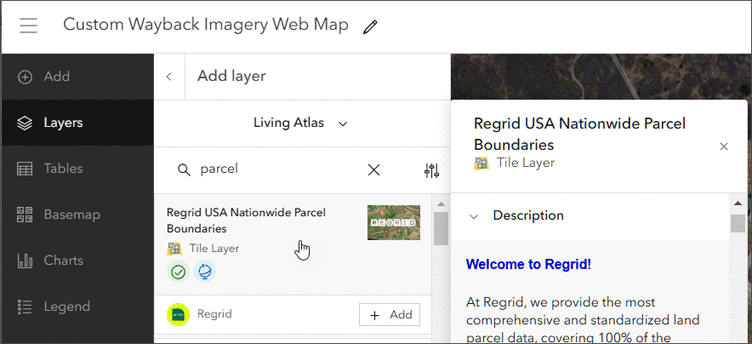
Step 9 — Enter “Regrid” or “parcel” in search to locate the layer. Click [+ Add] to add it to the map.
Step 10 — View the layer information to learn more.
Click the layer card to view the item information pane, providing quick access to the overview, description, details, and more.
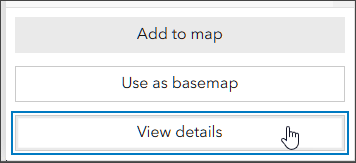
To open the full item pages, click View item details at the bottom of the pane.
Looking at the Regrid USA Nationwide Parcel Boundaries details, you can learn that the layer covers the entire United States and is updated quarterly.
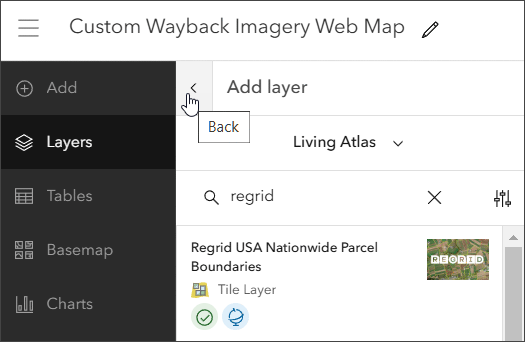
Step 11 — Click the left arrow to return to the Layers pane in the Contents (dark) toolbar.
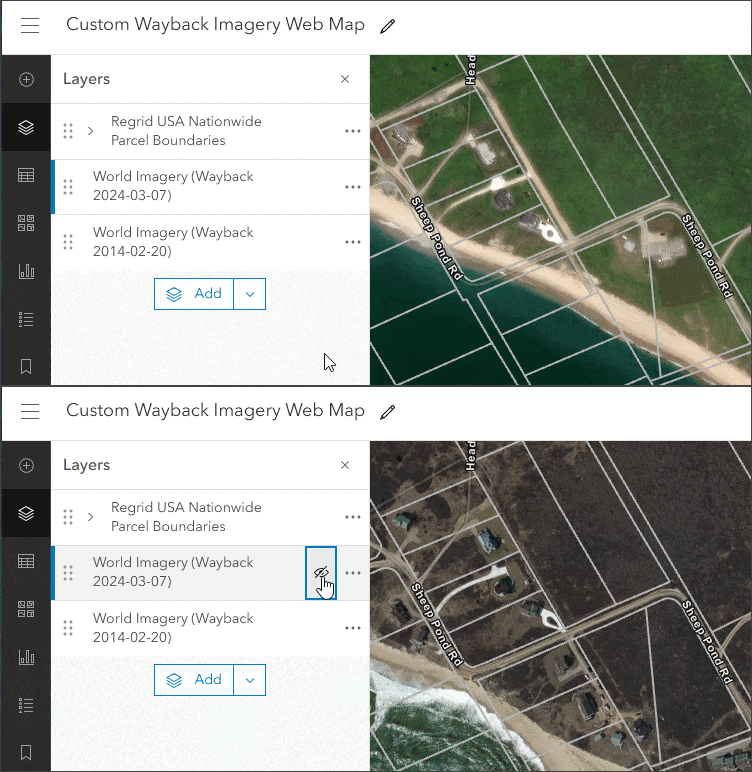
The Regrid parcel outlines will appear on the map and you can toggle visibility between the older and newer Wayback layers to view change over time. Note that the Regrid parcel outlines have scale dependencies, so you will need to zoom in to see them. Save the map when finished.
View the example map or click the image below.

Use Instant Apps
In this next section, you will choose an Instant App that includes a swipe tool and configure the app to easily compare the two Wayback imagery layers with parcels on top. This section continues the workflow from the preceding section.
Step 1 — On the Contents toolbar, click Create app, then choose Instant Apps.
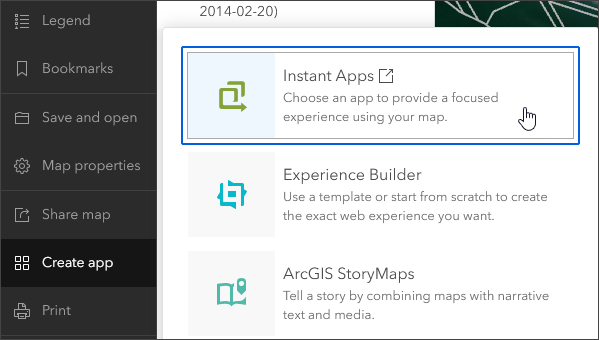
Step 2 — On the Instant Apps home, enter “swipe” in search to locate the app templates that include a swipe tool.
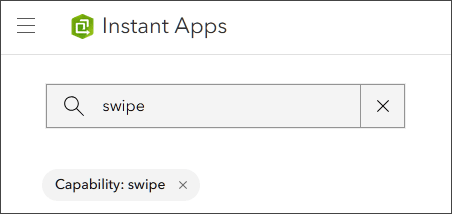
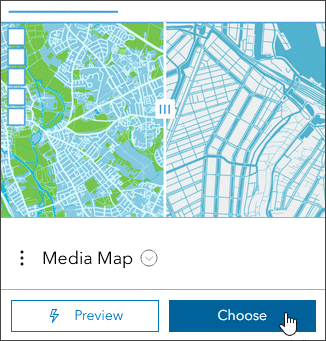
This filters the app templates, showing only those that support swipe. Media Map is the one that will be used in this example.
Step 3 — Click Choose on the Media Map card.
Step 4 — Create the app by providing a title and optionally tags. Click Create app when finished.
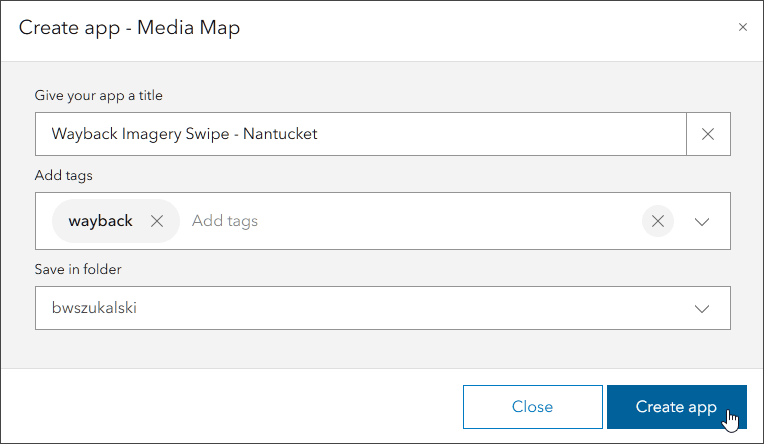
This opens the app template in express configuration mode, the easiest way to quickly step through creating an app. Full setup mode provides access to additional tools and capabilities. While Media Map supports swipe, it’s only available in full setup mode.
Step 5 — To configure the swipe tool, first locate it by entering “swipe” in search.
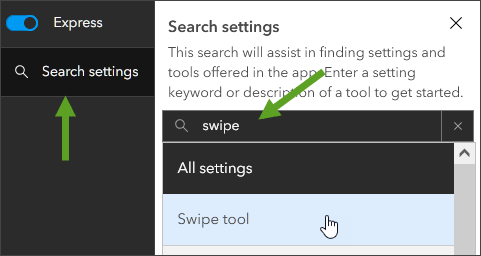
This will toggle to full setup mode and open the configuration pane at the Swipe options.
Step 6 — Enable the swipe too to display additional swipe configuration options.
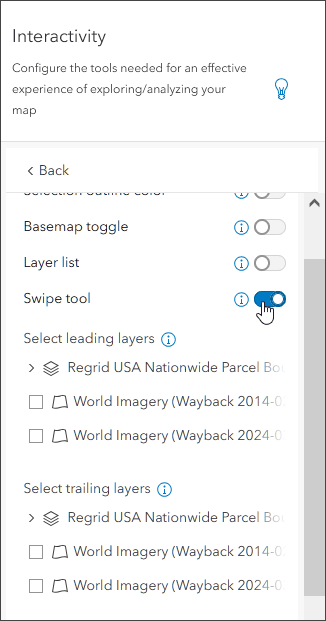
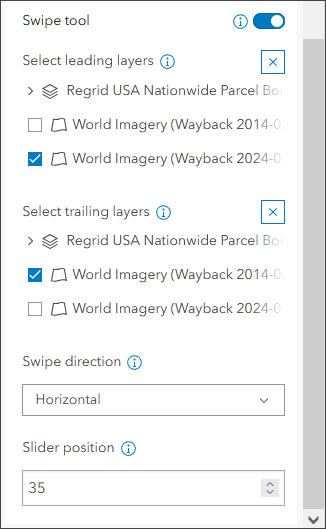
Additional swipe configuration options include selecting the leading and trailing layers, the visible layers on either side of the swipe tool. For this example, the Regrid parcel layer should remain visible with the swipe tool used against the two Wayback layers in the map.
Step 7 — Complete the swipe tool configuration using the settings shown below.
Step 8 — Consider other configurations to the app template you may want to make. When finished, publish and share the app.
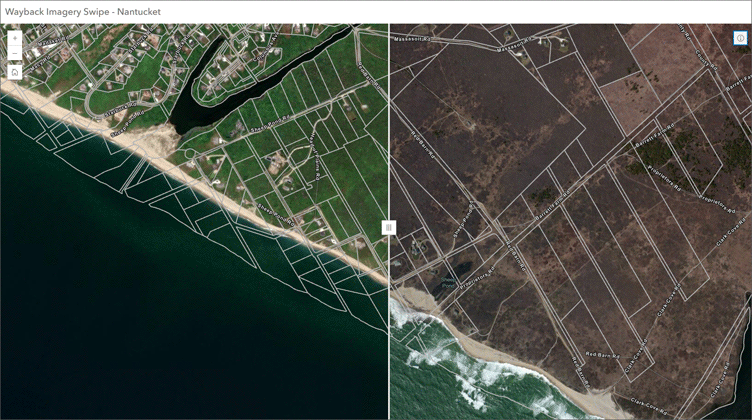
View the example app or click the image below.

More information
For more information, see the following:

Commenting is not enabled for this article.