The Copernicus Sentinel-2 mission provides optical imagery for a wide range of applications including land, water and atmospheric monitoring. The mission is based on a constellation of two identical satellites, phased at 180 degrees, flying in tandem and covering all of Earth’s land and coastal waters every five days.
Each satellite carries a multispectral sensor that generates optical images in the visible, near-infrared, and shortwave-infrared part of the electromagnetic spectrum. The images contain a total of 13 spectral bands at resolutions of 10 meters, 20 meters, and 60 meters.
With its multispectral sensor and wide swath coverage, the Sentinel-2 mission not only offers continuity with the Landsat missions, it also expands upon them by offering greater spatial resolution and unique spectral capabilities for monitoring agriculture and vegetation around the world.
Quick links
Use the links below to jump to sections of interest.
Introduction
Explore
Compare
Analyze
- Analyze – Index mask
- Analyze – Temporal profile
- Analyze – Spectral profile
- Analyze – Change detection
Introduction
About the Sentinel-2 mission
Sentinel-2 is a European mission that utilizes wide-swath, high-resolution, multi-spectral imaging. Dedicated to Europe’s Copernicus programme, the mission supports operational applications primarily for land services, including the monitoring of vegetation, soil and water cover, as well as the observation of inland waterways and coastal areas. For more information, see Introducing Sentinel-2.
Sentinel-2 Explorer essentials
The Sentinel-2 Level-2A imagery archive is available in ArcGIS Living Atlas of the World as a dynamic time enabled image service, accessible across the ArcGIS platform and used to power the Sentinel-2 Explorer app. For more about the service and the data, see Sentinel-2 Level-2A.
Sentinel-2 Explorer is an ArcGIS Living Atlas app that enables you to unlock and explore the wealth of information that Sentinel-2 provides.
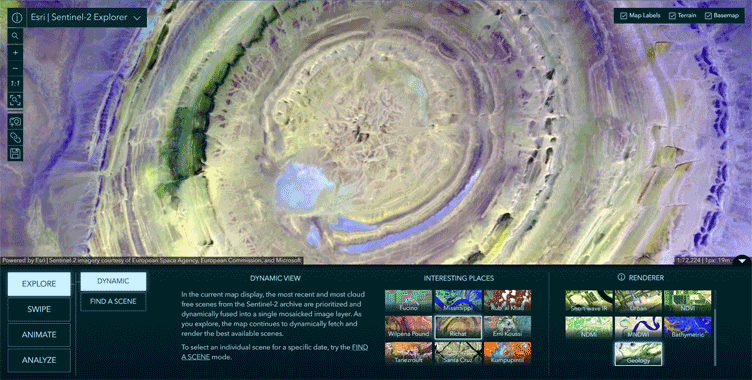
The app offers key capabilities, including the following:
- Visual exploration of a dynamic global mosaic of the latest available Sentinel-2 scenes.
- On-the-fly band/polarization combinations and indices for visualization and analysis.
- Interactive Find a Scene by location, sensor, time, and cloud cover.
- Visual change by time, and comparison of different renderings, with swipe and animation modes.
- Analysis such as threshold masking and temporal profiles for vegetation, water, and more.
Open the app
Sentinel-2 Explorer can be opened from the ArcGIS Living Atlas Apps page, found at the Apps tab at the Living Atlas Home. The app can also be opened directly from the Sentinel-2 Explorer item overview. The overview provides additional information about the app and the Sentinel-2 program.
Essential tools
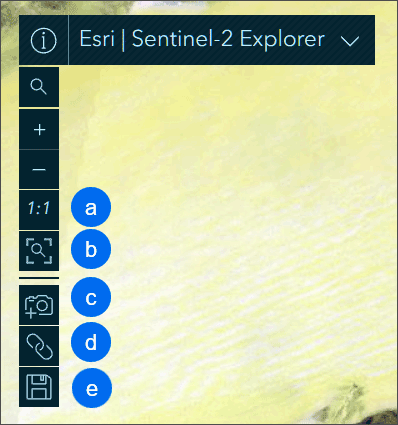
The following tools are always available and can be used to navigate, share, make screen captures, and more.
In the upper left you’ll find tools to learn more about the app, zoom, and also the following:
a – Zoom to Sentinel-1 imagery native pixel resolution.
b – Zoom to the full extent of the imagery.
c – Capture the current map view as an image.
d – Copy a link to the app in its current state. This is a useful way to save all settings and share your work.
e – Save a new instance of the Sentinel-2 Explorer in its current state. This creates a new ArcGIS Online web application.
Explore
Dynamic view mode
The app opens in Dynamic View mode by default. In this mode, the most recent and most cloud free scenes from the Sentinel-2 archive are prioritized and dynamically fused into a single mosaicked image layer. As you pan and zoom, the map continues to dynamically fetch and render the best available scenes.
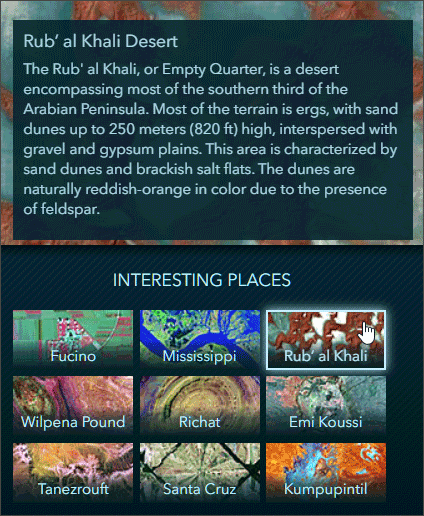
The app opens in one of several interesting places, each using a different renderer that most effectively highlights specific characteristics of the imagery. You can select and learn more about these locations by following the steps below.
Step 1 – Open Sentinel-2 Explorer. The app opens to an interesting place using a specific renderer, as indicated by the selected (highlighted) cards.

Step 2 – Hover over any card in Interesting Places to learn more about it. Click the card to zoom to the place.
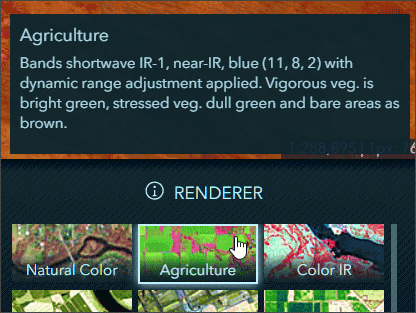
Sentinel-2 multispectral sensors work passively by collecting sunlight reflected from the Earth’s surface. Imagery is collected at distinct ranges, or bands, along the electromagnetic spectrum. These bands of imagery can be combined to create renderings of the Earth for different applications.
Step 3 – Hover over any renderer to learn more about it. Click the card to apply the renderer to the imagery.
Step 4 – Click anywhere on the map to get more information about the Sentinel-2 imagery, such as date and coordinates. Other information presented includes Normalized Difference Moisture Index (NDMI), Normalized Difference Vegetation Index (NDVI), and Modified Normalized Difference Water Index (MNDWI).
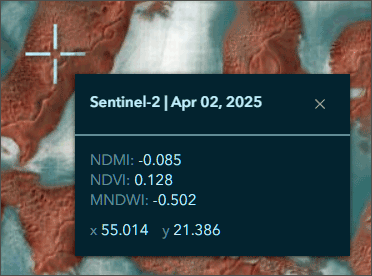
In the next section, you will use tools and settings described above to learn more about a specific area.
Step 5 – From Interesting Places, choose Fucino. Hover over the card to learn more about the area.
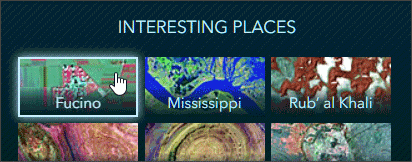
Note that when Fucino is displayed, the Color IR renderer is applied automatically. Hover over the Color IR card to learn more; This renderer displays healthy vegetation as bright red, stressed vegetation is dull red.

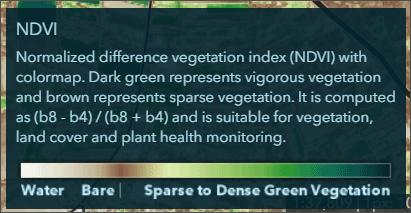
Step 6 – Change the renderer to NDVI and view the imagery. Hover over the renderer card to learn more about it. Dark green represents vigorous vegetation and brown represents sparse vegetation.
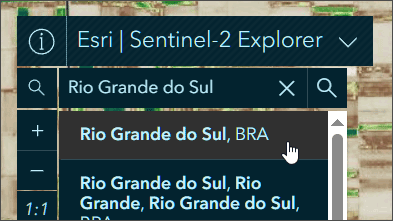
Step 7 – Explore further using other interesting places and renderers. Use the search tool in the upper left to find other locations of interest.
Step 8 – Use the Copy link tool described in the Sentinel-2 Explorer essentials section to capture the current state of your map as you explore. Here are some examples:
Atacama Desert, Chile, lithium evaporation ponds using MNDWI renderer
Atacama Desert, Chile, lithium evaporation ponds using NDMI renderer
Belize City coastline using Natural Color renderer
Belize City coastline using NDVI renderer
Find a scene
This mode allows for the selection of individual Sentinel-2 scenes by year, month, and day. In the next exercise, you will find scenes that cover the area near the village of Odeceixe, a village in Portugal where several wildfires occurred in 2023.
Step 1 – Click the button below to open Sentinel-2 Explorer to the area near Odeceixe in Dynamic mode.

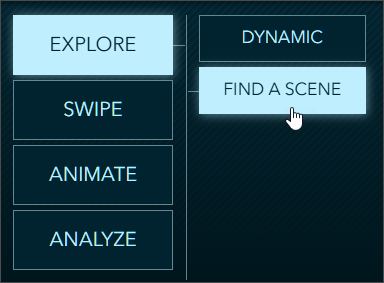
Step 2 – Click Find A Scene to switch to scene mode.
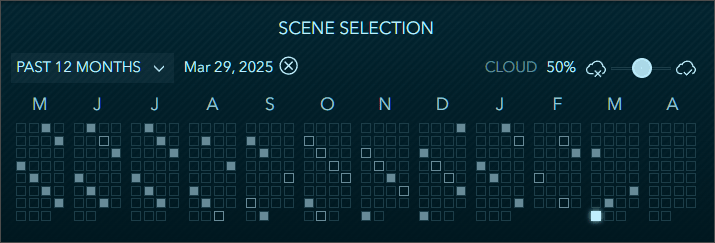
The Scene Selection calendar appears showing available Sentinel-2 scenes. Filters at the top of the calendar enable you find scenes by date and by cloud cover.
The scenes matching your criteria are included in the calendar and those meeting the date and cloud cover parameters are highlighted with a solid fill.
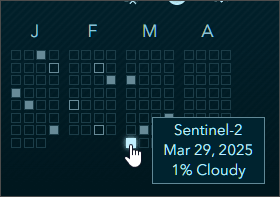
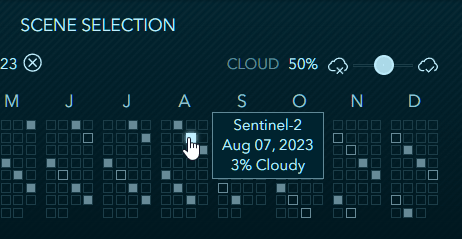
To learn more about a specific scene, hover over a square to view the scene information tip.
Next, you will find available scenes around the time of the 2023 wildfires.
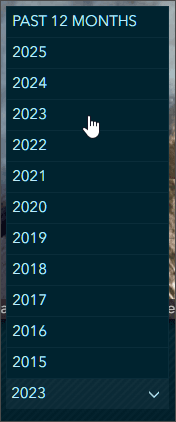
Step 3 – Click the date drop-down from the calendar and select 2023 to find available scenes for that year.
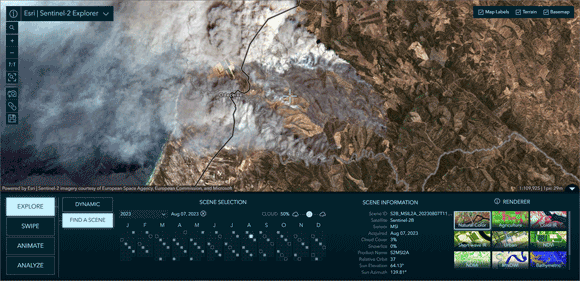
Step 4 – Choose the August 7, 2023, scene.
The scene, using the Natural Color renderer, shows the huge smoke plumes from the 2023 fire blowing west.
Step 5 – Choose a different renderer to view the wildfires. Experiment with renderers to find one that delivers the best visualization.
Examples:
- Natural Color
Shows smoke from the wildfires. - Short Wave IR
This renderer cuts through smoke to show the actively burning areas. - Urban renderer
This renderer clearly shows the actively burning areas.
2022 Mauna Loa eruption
Explore the scenes below to visualize the 2022 eruption of Mauna Loa, Hawai’i, the largest active volcano in the world. The eruption lasted for approximately 12 days in late 2022.
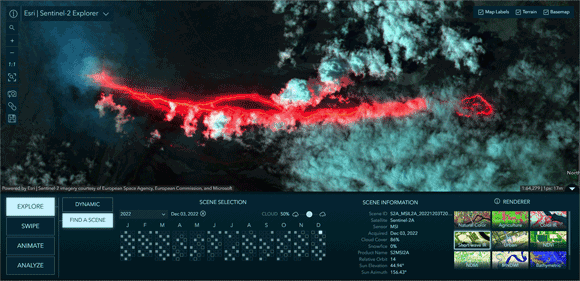
- Mauna Loa, December 3, 2022, with Natural Color renderer
- Mauna Loa, December 3, 2022, with Color IR renderer
- Mauna Loa, December 3, 2022, with Short Wave IR renderer
- Mauna Loa, December 3, 2022, with Agriculture renderer
- Mauna Loa, December 3, 2022, with Urban renderer
Fagradalsfjall volcano, Iceland
The following scenes visualize the Fagradalsfjall volcano in Iceland, near the town of Grindavik.
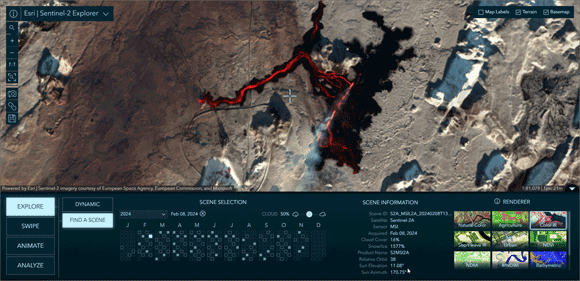
- Fagradalsfjall volcano, February 8, 2024, with Natural Color renderer
- Fagradalsfjall volcano, February 8, 2024, with Color IR renderer
- Fagradalsfjall volcano, February 8, 2024, with Short Wave IR renderer
Note that the Find A Scene workflow is leveraged throughout the rest of the app, simplifying the discovery and selection of scenes.
Compare
Use swipe to compare scenes
In Swipe mode, you can select two scenes to swipe and visually compare differences between them. It is common to choose between scenes of different dates, but you can also swipe and compare different renderings of the same date, or mix and match the two. Swipe is a simple yet extremely powerful way to visually detect, explore, and analyze differences and similarities between two images.
The Cameron Peak fire was a wildfire that started near Chambers Lake, Colorado on August 13, 2020. The fire burned 208,663 acres in the Arapaho and Roosevelt National Forests in Larimer and Jackson Counties and Rocky Mountain National Park. The fire became the largest wildfire in Colorado history.
Step 1 – Click the button below to open Sentinel-2 Explorer in dynamic mode with the Natural Color renderer around the area of the fire.

Step 2 – Click Swipe to switch to scene swipe mode.
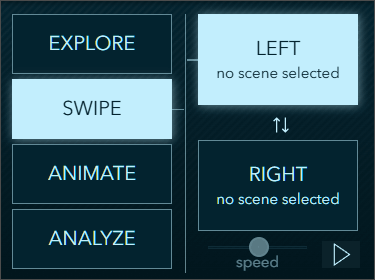
The stacked Left and Right boxes indicate the scenes selected for the left and right sides of the swipe.
Step 3 – Click Left, and following the scene selection workflow described in the previous section, select the scene for July 20, 2020. This is the pre-fire Sentinel-2 scene.
Step 4 – Choose the Short-wave IR renderer for the left scene.
Step 5 – Click Right, and following the scene selection workflow used in Step 3, select the scene for October 8, 2020. This is a post-fire scene.
Step 6 – Choose the Short-wave IR renderer for the right scene.
Your swipe should be configured as shown below:
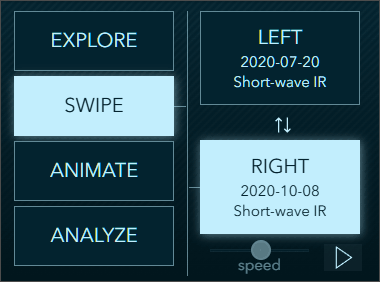
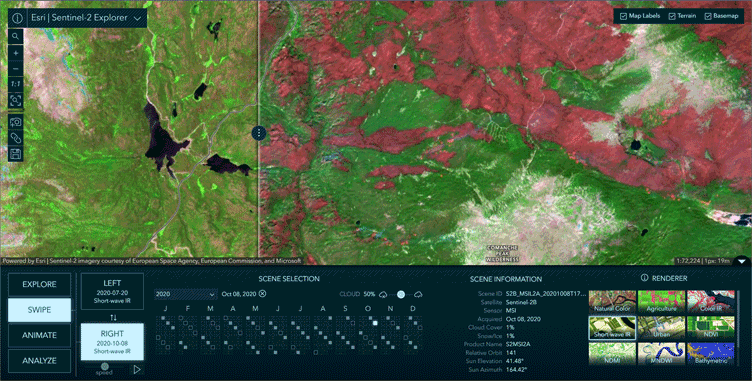
Step 7 – Use the swipe tool to compare the two scenes. The image on the left shows pre-fire conditions, while the image on the right is post-fire. The burned areas are readily visible as red in the scenes using the Short-wave IR renderer.
Step 8 – Click the image below to compare with your map, or open Sentinel-2 Explorer with the exercise settings from the steps above.
Animate multiple scenes
In Animate mode, you can select multiple scenes to create compelling time animations. When you have gathered your collection of images, click the play button to start the animation. During playback, you can choose your frame rate and optionally export your animation to an MP4 with the layout of your choosing.
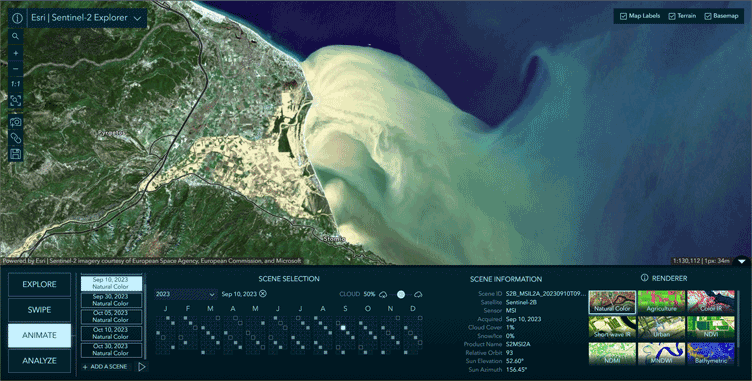
Starting in September, 2023, the Pineios River in Greece was heavily impacted by widespread flooding caused by Storm Elias. In the next exercise, you will animate scenes around the Pineios Delta.
Step 1 – Click the button below to open Sentinel-2 Explorer in dynamic mode with the Natural Color renderer to the area encompassing the Pineios Delta.

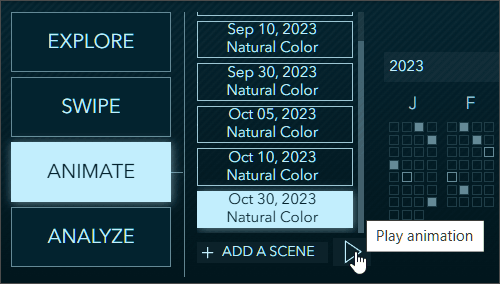
Step 2 – Click Animate to switch to animate mode, then click Add A Scene.
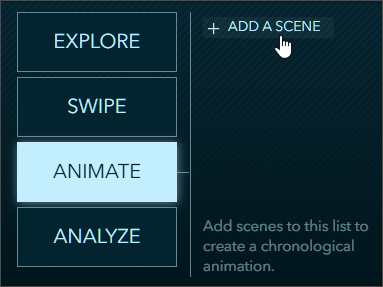
Step 3 – Using the Scene Selection calendar, add the following scenes. Remember to click Add A Scene to add additional scenes.
- August 21, 2023, Natural Color
- September 10, 2023, Natural Color
- September 30, 2023, Natural Color
- October 5, 2023, Natural Color
- October 10, 2023, Natural Color
- October 30, 2023, Natural Color
Step 4 – When finished, click the arrow at the bottom of the scene list to play the animation.
Step 5 – Use the play controls to (from left to right):
- Adjust the animation speed.
- Capture a link to the animation.
- Download the animation as an MP4 file.
- Pause/Play.
- Dismiss the play controls.

Tip: After adjusting the speed, you can pause the animations and use the link on the playback toolbar or the toolbar that appears in the upper right of the app to save the current animation settings.
Step 6 – Click the image below to compare with your map, or open Sentinel-2 Explorer with the exercise settings.
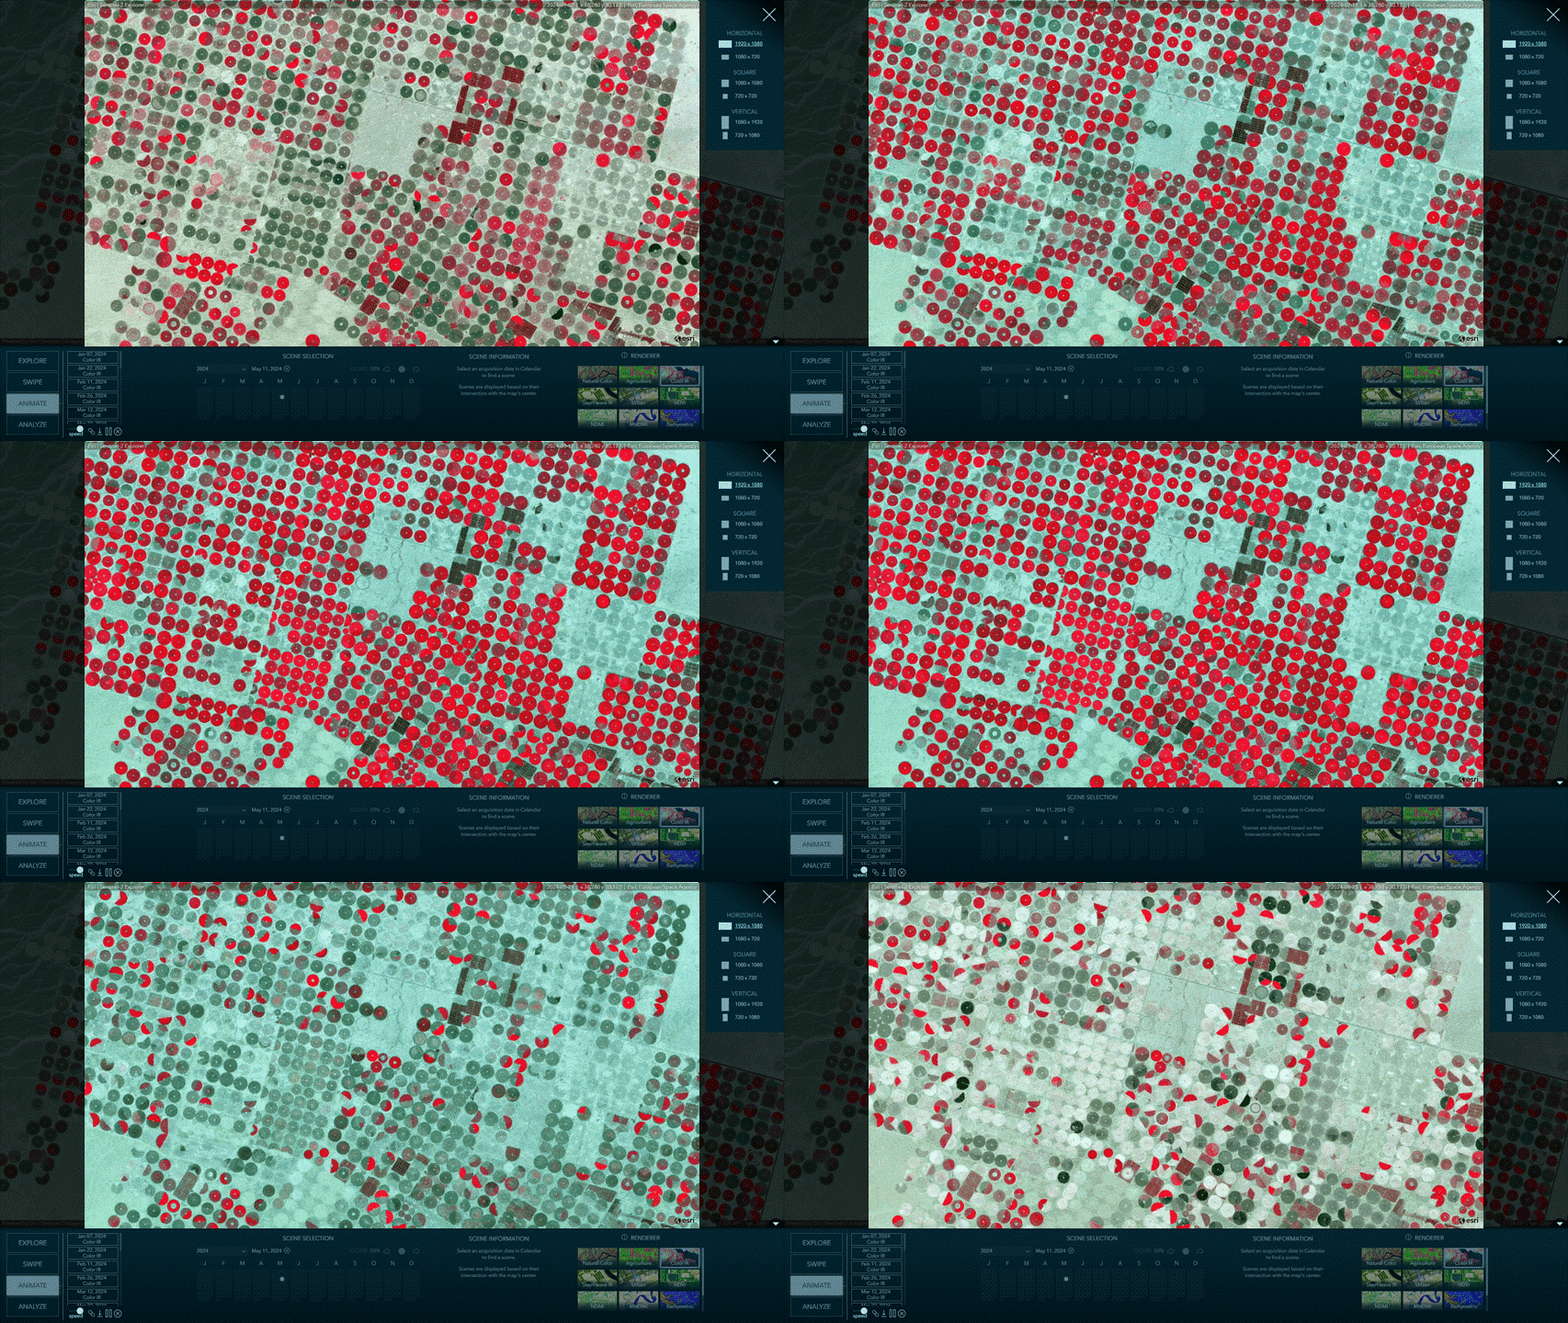
The animation below shows seasonal variations in center-pivot agricultural field irrigation in the desert near Tubarjal, Saudi Arabia throughout 2024. Click the image to open Sentinel-2 Explorer with the animation.
Analyze
Analyze: Index Mask
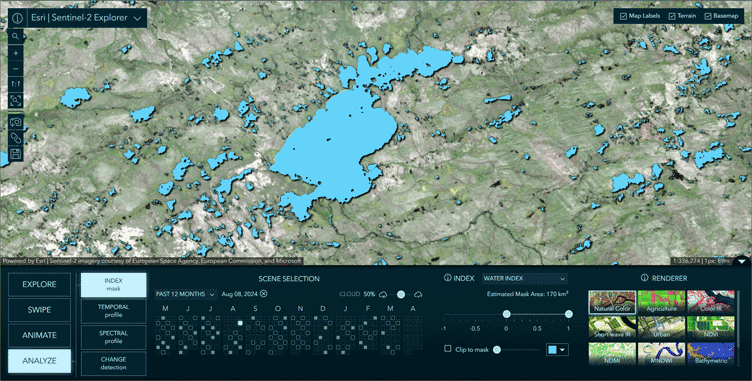
use spectral indices, derived from band arithmetic, to measure relative abundance of things like water, moisture, and vegetation. As you move the slider, a mask is dynamically rendered on screen indicating the areas meeting the specified thresholds. Alternatively, the mask can be used to clip the image and only show the original image pixels meeting the specified thresholds.
In this next exercise, you will examine the water index in an area in northern Canada.
Step 1 – Click the button below to open Sentinel-2 Explorer to an area in northwestern Saskatchewan Province, using a scene captured on August 8, 2024, shown using Natural Color renderer.

Step 2 – Click Analyze, then choose Index mask.
Step 3 – Choose Water Index from the Index drop-down.
Step 4 – Adjust the slider to the desired values. Note that the calculated mask area adjusts.
Step 5 – (Optional) Experiment using the Clip to mask and color options.
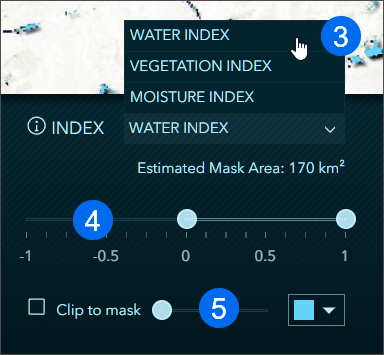
Step 6 – Use the Copy link tool to capture the current settings.
The areas with the highest water index are highlighted. Click the image below to view a larger version to compare to your map, or open Sentinel-2 Explorer to the saved settings from the exercise steps above.
Experiment with other locations and other index masks.
Analyze: Temporal Profile
Using the Temporal profile tool you can detect categorical trends over time, including moisture, vegetation, and water. You can also select the time interval: yearly or monthly.
When Yearly is selected, you can specify the target month you would like to be sampled year over year. This option is best for identifying long term patterns and trends. When Monthly is selected, you specify the target year and all 12-months within that year will be sampled. The monthly option is useful for seeing seasonal patterns and fluctuations throughout the year.
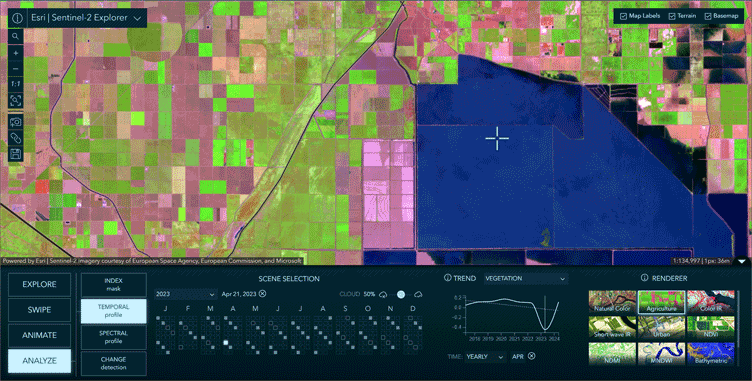
In this exercise, you will examine the temporal profile of the Tulare Lake Basin in Central California. This area flooded in the spring/summer of 2023. When using the annual temporal profile, the flooding peak is evident.
Step 1 – Click the button below to open Sentinel-2 Explorer in Dynamic view mode to the Tulare Lake Basin area using the Agriculture renderer.

Step 2 – Click Analyze, then choose Temporal profile.
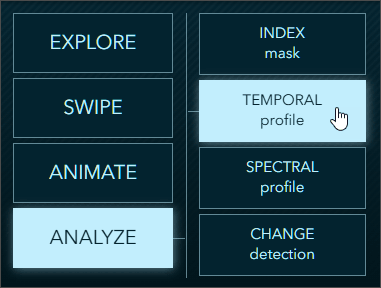
Step 3 – Using the Scene Selection calendar, choose April 21, 2023.
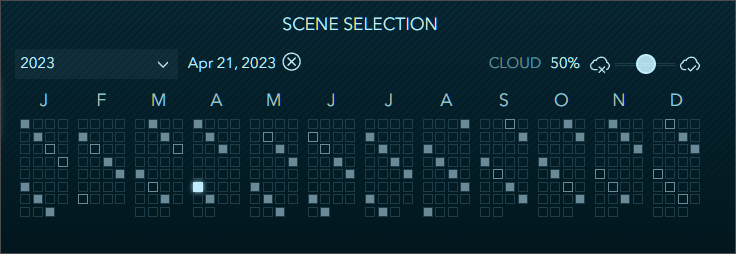
This scene clearly shows the shallow lake in the agricultural area of the Tulare Lake Basin as blue.
Step 4 – Click anywhere in the dark blue area.
Step 5 – Choose Water as the trend from the Trend drop-down list. Select Yearly as the time interval. Note the peak in April 2023.
Step 6 – Choose Vegetation as the trend from the Trend drop-down list. Select Yearly as the time interval. Note the inverted peak for the same period in April 2023.
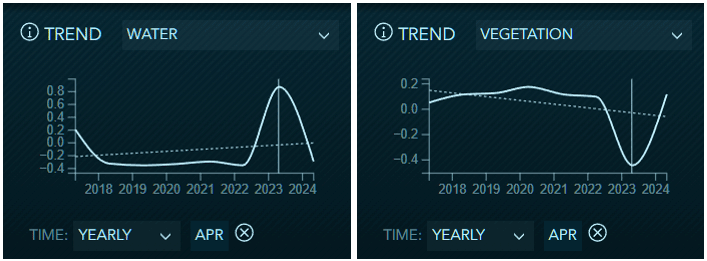
Step 7 – Experiment by clicking other areas and switching from yearly to monthly trends.
Step 8 – Use the Copy link tool to capture the current settings.
Click the image below to view a larger version to compare to your map, or open Sentinel-2 Explorer using the saved settings from the exercise steps above.
Analyze: Spectral Profile
Multispectral imagery provides measurements of the varying amounts of light that different materials reflect. In other words, their spectral responses. By collecting samples of the spectral response for the same type of material on the Earth’s surface, it is possible to build a spectral signature for that material.
To use the Spectral profile tool, click Analyze, then click Spectral profile.
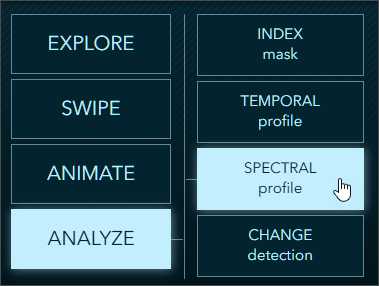
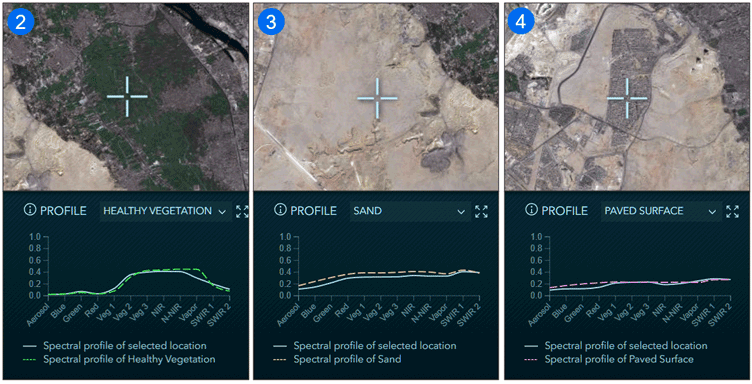
Use any scene and renderer. Using the Spectral profile tool, you can click anywhere on the map and a spectral profile for that point will be generated. The profile will be matched with one of the pre-defined spectral signatures available in the Profile drop-down list. The match accuracy may vary, depending on multiple factors such as sampling methodology and inherent limitations in the data.
Step 1 – Click the button below to open Sentinel-2 Explorer in spectral profile mode to an area along the Nile River near Giza, Egypt, on January 2, 2025.

Step 2 – Click in one of the dark green areas in the center of the scene to view the profile.
Step 3 – Click in one of the light brown areas to view the profile.
Step 4 – Click in one of the dark gray areas to view the profile.
Step 5 – Click the Expand button in the Profile window to view all profiles.
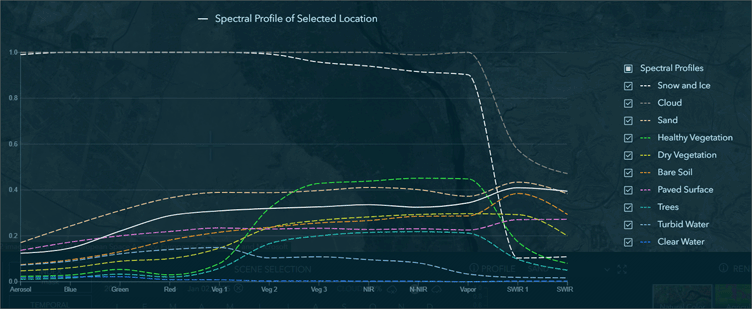
Step 6 – Experiment by clicking other areas or scenes and examining the spectral profiles.
Analyze: Change detection
In this mode, you are able to select two scenes and calculate the difference between them. You can create change masks based on vegetation, water, or moisture indices. Creating difference images allows you to then do further analysis, such as estimating forest and vegetation loss in the event of a wildfire.
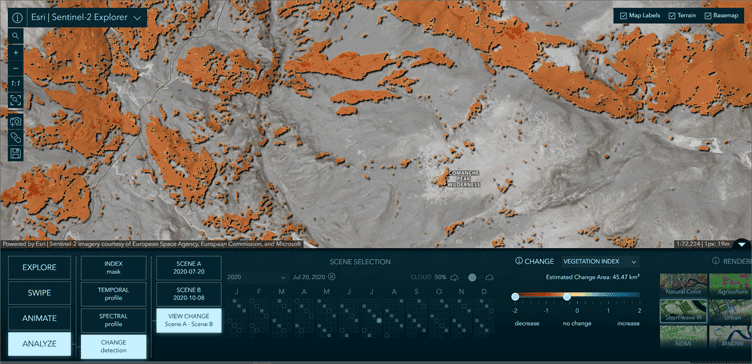
Using similar before and after images from Cameron Peak fire in the swipe example above, we can calculate the difference in vegetation between the images to create a difference mask.
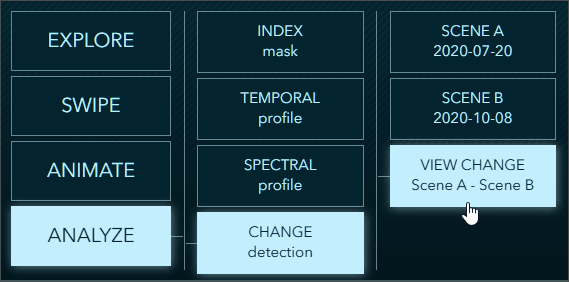
Step 1 – Click the button below to open Sentinel-2 Explorer in change detection mode. The two scenes (Scene A and Scene B) have already been selected to show before and after the fire using the Short-wave IR renderer.

Step 2 – Click View Change Scene A – Scene B.
Step 3 – Choose Vegetation Index from the Change drop-down list, then adjust the range selectors.
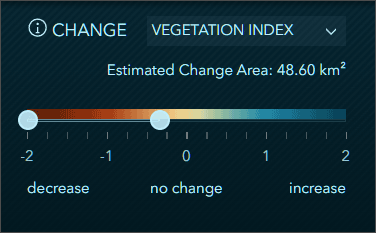
Note the the estimated change area adjusts as you adjust the range, providing an approximate visual delineation and surface area of the vegetation loss due to the fire.
Click the image below to view a larger version to compare to your map, or open Sentinel-2 Explorer using the saved settings from the exercise steps above.
Step 4 – Experiment by choosing other scenes and dates.
More information
For more information, see the following:
- Sentinel-2 Explorer: another level of Earth observation (Blog)
- Sentinel-2 Explorer (Item Overview)
- ArcGIS Living Atlas Apps (Website)


Commenting is not enabled for this article.