Sentinel-1 is a spaceborne Synthetic Aperture Radar (SAR) imaging system and mission from the European Space Agency and the European Commission. The mission launched and began collecting imagery in 2014.
The Sentinel-1 Radiometric Terrain Correction (RTC) data in the collection is an analysis ready product derived from the Ground Range Detected (GRD) Level-1 products produced by the European Space Agency. RTC accounts for terrain variations that affect both the position of a given point on the Earth’s surface and the strength of the returned radar pulses.
With the ability to see through cloud and smoke cover, and because it does not rely on solar illumination of the Earth’s surface, Sentinel-1 is able to collect useful imagery in most weather conditions, day and night. This data is good for a wide range of land and maritime applications, from mapping floods, to deforestation, to oil spills, and more.
Quick Links
Use the links below to jump to sections of interest.
Introduction
Explore
Compare
Analyze
- Analyze – Index mask
- Analyze – Temporal profile
- Analyze – Change detection
- Analyze – Temporal composite
Introduction
About the Sentinel-1 mission
Sentinel-1 is a European radar imaging satellite mission developed by the European Space Agency (ESA) Copernicus program. It is designed to provide continuous all-weather, day-and-night, radar imaging for a variety of services, including monitoring sea ice, maritime surveillance, disaster management, and land monitoring.
Sentinel-1 consists of two satellites, Sentinel-1A and Sentinel-1B, which were launched in 2014 and 2016 respectively. Two mission satellites allows for increased Earth coverage, faster revisit times, and improved data quality. For more information, see the ESA’s Sentinel-1 website.
Sentinel-1 Explorer essentials
Sentinel-1 Explorer is an ArcGIS Living Atlas app that enables you to unlock and explore the wealth of information that Sentinel provides.
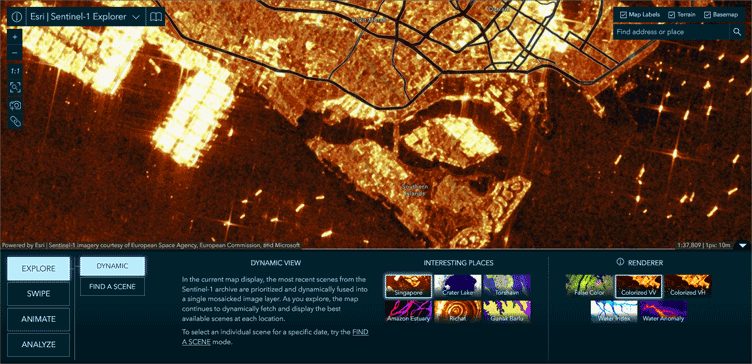
The app offers key capabilities, including the following:
- Visual exploration of a dynamic global mosaic of the latest available scenes.
- On-the-fly band/polarization combinations and indices for visualization and analysis.
- Interactive Find a Scene by location, time, and orbit direction.
- Visual change by time, and comparison of different renderings, with Swipe and Animation modes.
- Analysis such as threshold masking and temporal profiles for vegetation, water, and more.
Open the app
Sentinel-1 Explorer can be opened from the ArcGIS Living Atlas Apps page, found at the Apps tab at the Living Atlas Home. The app can also be opened directly from the Sentinel-1 Explorer item overview. The overview provides additional information about the app and the Sentinel-1 program.
Essential tools
The following tools are always available and can be used to navigate, share, make screen captures, and more.
In the upper left you’ll find tools to learn more about the app, zoom, and also the following:
a – Zoom to Sentinel-1 imagery native pixel resolution.
b – Zoom to the full extent of the imagery.
c – Capture the current map view as an image.
d – Copy a link to the app in its current state. This is a useful way to save all settings and share your work.
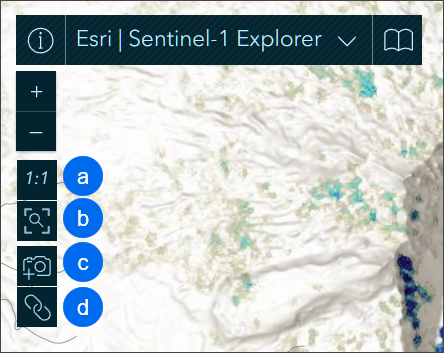
In the upper right you can toggle the visibility of map labels, terrain, and the basemap. Below that, a search tool enables you to find an address or a place.

Explore
Dynamic view mode
The app opens in Dynamic View mode by default. In this mode, the most recent scenes from the Sentinel-1 archive are prioritized and dynamically fused into a single mosaicked image layer. As you pan and zoom, the map continues to dynamically fetch and render the best available scenes.
The app opens in one of several interesting places, each using a different renderer that most effectively highlights specific characteristics of the imagery. You can select and learn more about these locations by following the steps below.
Step 1 – Open Sentinel-1 Explorer. The app opens to place using a specific renderer, as indicated by the selected (highlighted) cards.

Step 2 – Hover over any card in Interesting Places to learn more about it. Click the card to zoom to the place.
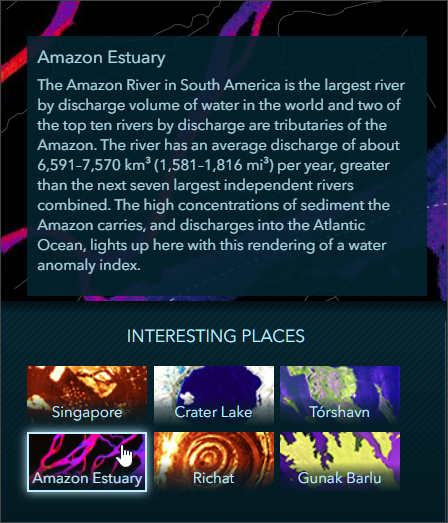
Sentinel-1 sensors send and receive radar pulses that echo off the Earth’s surface. The echoes returned to the sensor are known as radar backscatter. The amplitude (strength) of the backscatter varies depending on the characteristics of the surface at any given location, resulting in dark to light pixels.
For example, smoother surfaces have less backscatter and will have darker pixels. Rough surfaces have higher backscatter and will have brighter pixels. Water bodies and wet soils will have lower backscatter, and therefore will have darker pixels. Vertical objects will have higher backscatter, showing brighter pixels, and so forth. The higher the backscatter, the brighter the pixels.
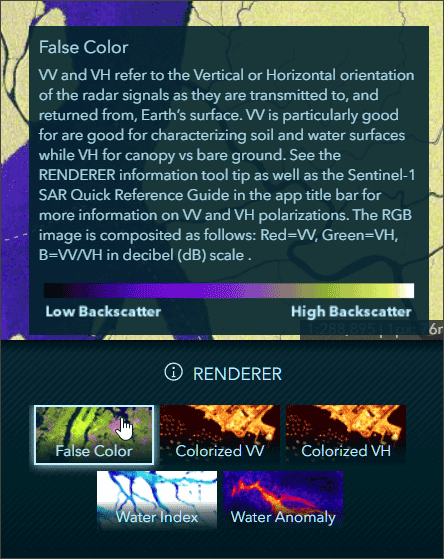
Step 3 – Hover over any renderer to learn more about it. Click the card to apply the renderer to the imagery.
Step 4 – Click anywhere on the map to get more information about the Sentinel-1 imagery, such as date and coordinates.
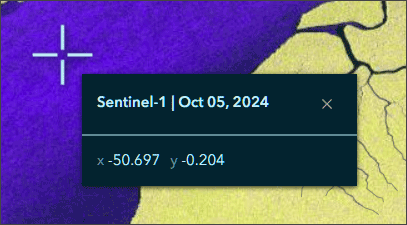
In the next section, you will use tools and settings described above to learn more about a specific area.
Step 5 – From Interesting Places, choose Gunak Barlu. Hover over the card to learn more about the area.
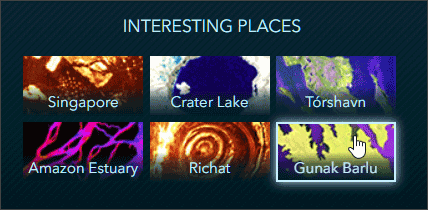
Note that when Gunak Barlu is displayed, the False Color renderer is applied automatically. Land areas are higher backscatter and display in hues ranging to yellow. Water areas have low backscatter and will display in deep purples and black. Hover over the False Color card to see the color range represented in the map.

Step 6 – Change the renderer to Water Index and view the imagery. Hover over the renderer card to learn more about it. Areas of low water content appear white, areas with high water content appear dark blue.

Step 7 – Explore further using other interesting places and renderers. Use the search tool to find other locations of interest.
Step 8 – Use the Copy link tool described in the Sentinel-1 Explorer essentials section to capture the current state of your map as you explore. Here are some examples:
Lake Tahoe, California, using Water Index renderer
Lake Tahoe, California, using Water Anomaly renderer
Singapore using False Color renderer
Singapore using Colorized W renderer
Atacama Desert, Chile, lithium evaporation ponds using False Color renderer
Atacama Desert, Chile, lithium evaporation ponds using Water Anomaly renderer
Find a scene
This mode allows for the selection of individual Sentinel-1 scenes by year, month, and day.
In the next exercise, you will find scenes that cover the Sea of Okhotsk, located between Russia’s Kamchatka Peninsula and the island of Hokkaido, Japan. Ice forms in the sea seasonally, typically from December through April.
Step 1 – Click the button below to open Sentinel-1 Explorer to the area near Hokkaido and the Sea of Okhotsk.

Step 2 – Click Find A Scene to switch to scene mode.
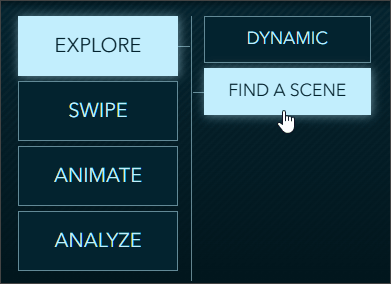
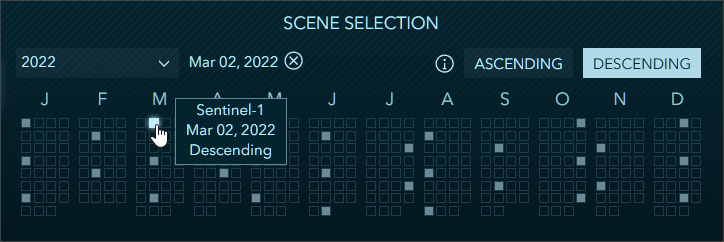
The Scene Selection calendar appears showing available Sentinel-1 scenes. Filters at the top of the calendar enable you find scenes by date and also by orbital direction. As the satellites travel around the earth, the orbit directions alternate. The pass from north to south is descending, from south to north is ascending. When comparing images of the same location, it is best to select images with the same orbit direction.
The scenes matching your criteria are included in the calendar and those meeting the specified orbital direction are highlighted with a solid fill.
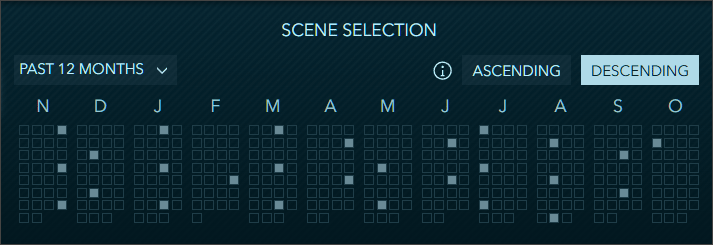
To learn more about a specific scene, hover over a square to view the scene information tip.
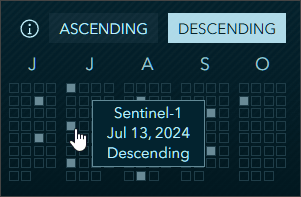
Next, you will find available scenes around ice flows that built up during 2022.
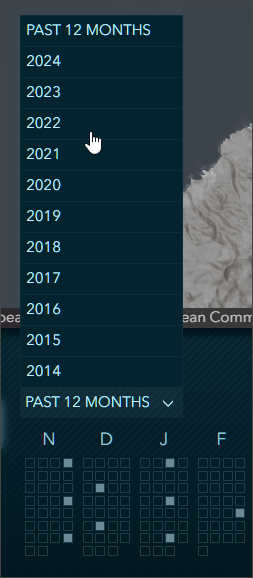
Step 3 – Click the date drop-down from the calendar and select 2022 to find available scenes for that year.
Step 4 – Choose Descending orbit imagery and browse the available scenes. Choose the March 2, 2022, scene.
The ice is indicated by its brighter hues. The surface of sea ice is rougher, therefore will have a higher backscatter and appear lighter than the sea. The image below uses the False Color renderer.
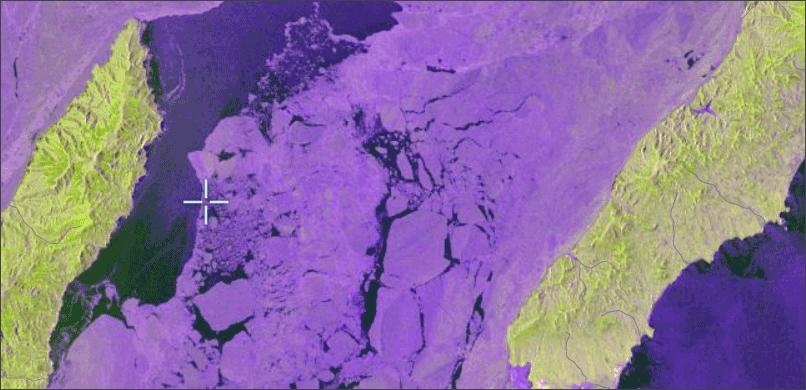
Step 5 – Choose a different renderer to highlight the ice. Experiment with with Colorized VV, Colorized VH, Water Index, and others to find one that delivers the best visualization. Examples:
- Sea of Okhotsk using False Color renderer
- Sea of Okhotsk using Colorized VV renderer
- Sea of Okhotsk using Colorized VH renderer
- Sea of Okhotsk using Water Index
Explore the scenes below showing the location of the weeklong Burning Man festival in the Black Rock Desert of Nevada, on August 30, 2024. The area of camper vans and tents has higher backscatter than the surrounding desert sands, so appears brighter.
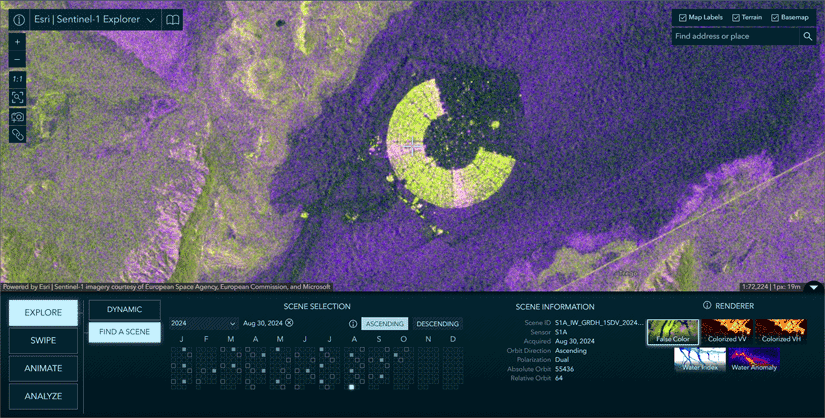
Note that the Find A Scene workflow is leveraged throughout the rest of the app, simplifying the discovery and selection of scenes.

Compare
Use swipe to compare scenes
In Swipe mode, you can select two scenes to swipe and visually compare differences between them. It is common to choose between scenes of different dates, but you can also swipe and compare different renderings of the same date, or mix and match the two. Swipe is a simple yet extremely powerful way to visually detect, explore, and analyze differences and similarities between two images. Remember that when comparing images of the same location, it is best to select images with the same orbit direction.
Madagascar is often hit by cyclones between the months of November and April because of its location in the Indian Ocean. In the next exercise, you will find and compare scenes of flooding in Madasgascar’s Tsiribihina River basin, caused by tropical storm Ava which hit Madagascar between January 5 and the January 7, 2018. The flooding killed at least 36 people and forced more than 20,000 from their homes.
Step 1 – Click the button below to open Sentinel-1 Explorer in dynamic mode with the False Color renderer to the area encompassing the flood.

Step 2 – Click Swipe to switch to scene swipe mode.
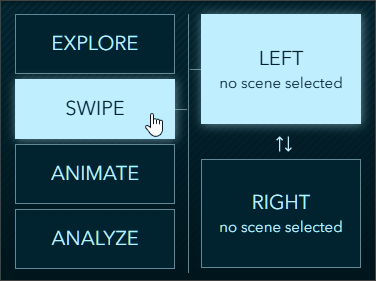
The stacked Left and Right boxes indicate the scenes selected for the left and right sides of the swipe.
Step 3 – Click Left, and following the scene selection workflow described in the previous section, select the scene for December 12, 2017. This is the pre-flood Sentinel-1 scene.
Step 4 – Choose the Water Index renderer for the left scene.
Step 5 – Click Right, and following the scene selection workflow used in Step 3, select the scene for January 11, 2018.
Step 6 – Choose the Water Index renderer for the right scene.
Your swipe should be configured as shown below:
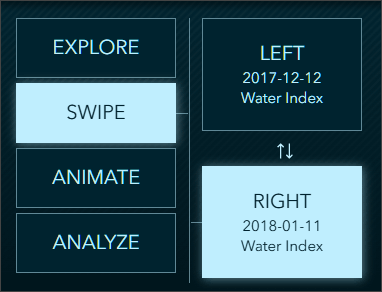
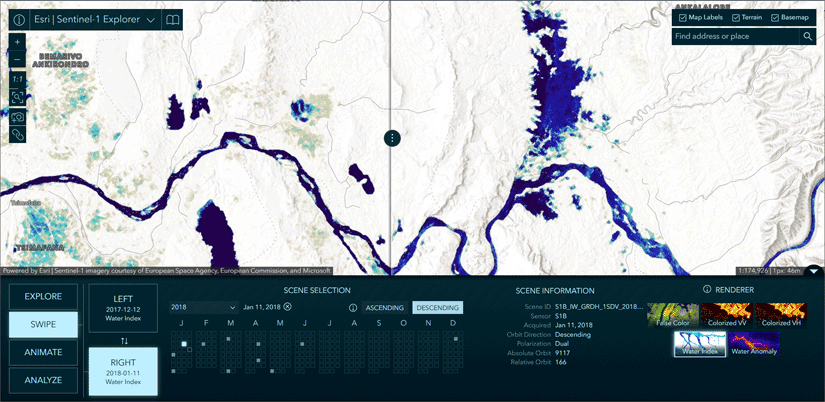
Step 7 – Use the swipe tool to compare the two scenes. The image on the left shows pre-flood conditions, while the image on the right is post-flood. The flooded areas are readily visible as dark blue in the scenes using the Water Index renderer.
Step 8 – Click the image below to compare with your map, or open Sentinel-1 Explorer with the exercise settings in the steps above.
Animate multiple scenes
In Animate mode, you can select multiple scenes to create compelling time animations. When you have gathered your collection of images, click the play button to start the animation. During playback, you can choose your frame rate and optionally export your animation to an MP4 with the layout of your choosing.
In the next exercise, you will animate the movement the flooding in the Tsiribihina River basin discussed in the section above.
Step 1 – Click the button below to open Sentinel-1 Explorer in dynamic mode with the False Color renderer to the area encompassing the flood.

Step 2 – Click Animate to switch to animate mode, then click Add A Scene.
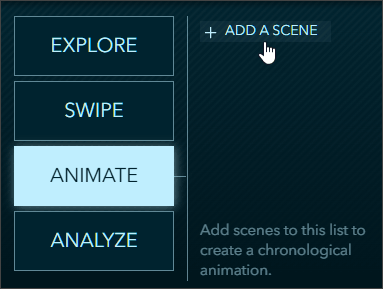
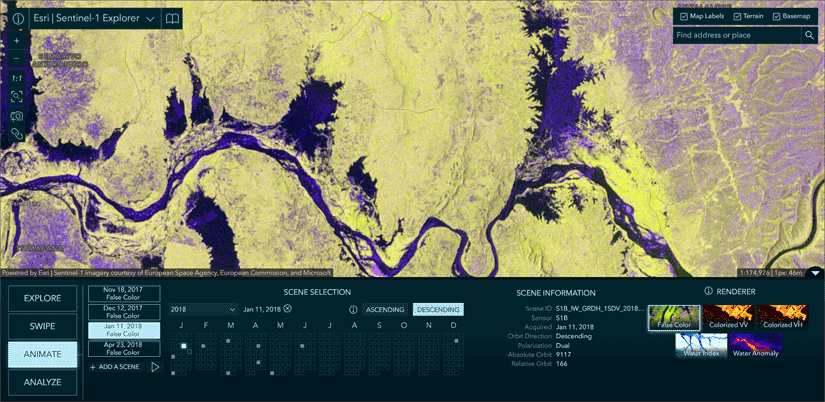
Step 3 – Using the Scene Selection calendar, add the following scenes:
- November 18, 2017, False Color
- December 12, 2017, False Color
- January 11, 2018, False Color
- February 10, 2018, False Color
- March 30, 2018, False Color
Step 4 – When finished, click the arrow at the bottom of the scene list to play the animation.
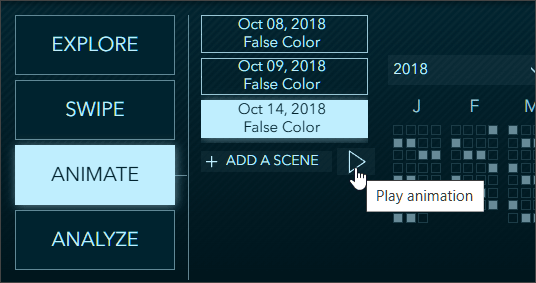
Step 5 – Use the play controls to (from left to right):
- Adjust the animation speed.
- Capture a link to the animation.
- Download the animation as an MP4 file.
- Pause/Play.
- Dismiss the play controls.

Tip: After adjusting the speed, pause the animations and use the link on the playback toolbar to save the current animation settings.
Step 6 – Click the image below to compare with your map, or open Sentinel-1 Explorer with the exercise settings.
Analyze
Analyze: Index Mask
In this mode you can use calculated indices to delineate and measure estimated surface area of things like water and water anomalies (including oil slicks), ships and built-up areas. As you move the index slider to adjust values, a mask is dynamically rendered on screen indicating the areas meeting the specified thresholds. Alternatively, the mask can be used to clip the image and only show the pixels covered by the mask.
In this next exercise, you will examine the water index in an area in northern Canada.
Step 1 – Click the button below to open Sentinel-1 Explorer in Dynamic view mode to an area in northwestern Saskatchewan Province, using a scene captured on August 31, 2024, shown using False Color.

Step 2 – Click Analyze, then choose Index mask.
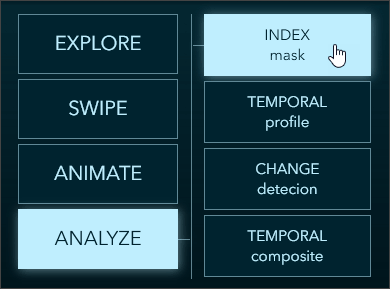
Step 3 – Choose Water Index from the index drop-down.
Step 4 – Adjust the slider to the desired values. Note that the calculated mask area adjusts.
Step 5 – (Optional) Experiment using the Clip to mask and color options.
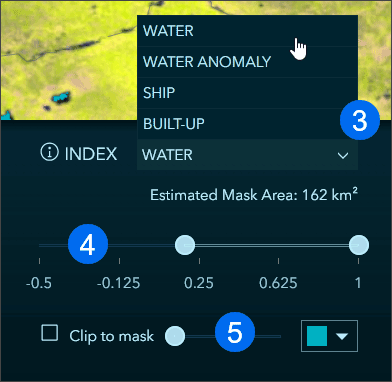
Step 6 – Use the Copy link tool to capture the current settings.
The areas with the highest water index are highlighted. Click the image below to view a larger version to compare to your map, or open Sentinel-1 Explorer to the saved settings from the exercise steps above.
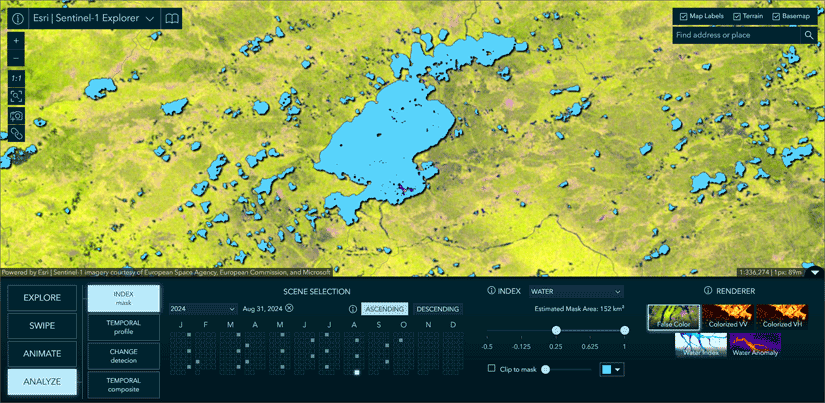
Experiment with other locations and other index masks.

Temporal Profile
Using the Temporal profile tool, you can detect categorical trends over time, including water and water anomaly. You can also select the time interval: yearly or monthly.
When Yearly is selected, you can specify the target month you would like to be sampled year over year. This option is best for identifying long term patterns and trends. When Monthly is selected, you specify the target year and all 12-months within that year will be sampled. The monthly option is useful for seeing seasonal patterns and fluctuations throughout the year.
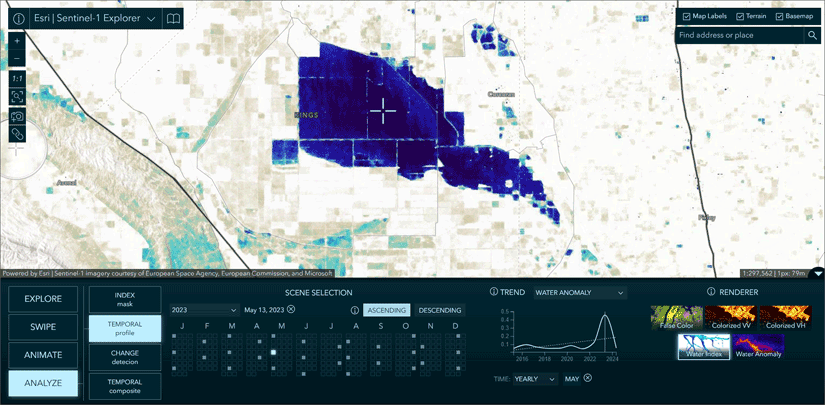
In this exercise, you will examine the temporal profile of the Tulare Lake Basin in Central California. This area flooded in the spring/summer of 2023. When using the annual temporal profile, the flooding peak is evident.
Step 1 – Click the button below to open Sentinel-1 Explorer in Dynamic view mode to the Tulare Lake Basin area using the Water Index renderer.

Step 2 – Click Analyze, then choose Temporal profile.
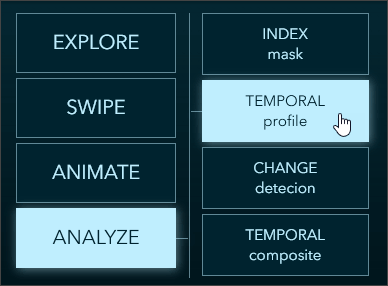
Step 3 – Using the Scene Selection calendar, choose May 13, 2023.

This scene clearly shows the shallow lake in the agricultural area of the Tulare Lake Basin using the Water Index renderer.
Step 4 – Click anywhere in the dark blue area.
Step 5 – Choose Water as the trend, and select Yearly as the time interval. Note the peak in 2023 for May.
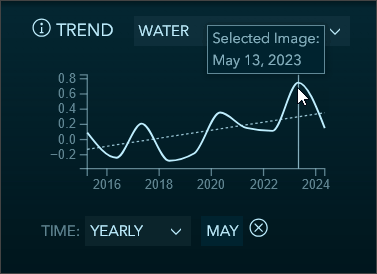
Step 6 – Experiment by clicking other areas and switching from yearly to monthly trends.
Step 7 – Use the Copy link tool to capture the current settings.
The areas with the highest water index appear in deep blue. Click the image below to view a larger version to compare to your map, or open Sentinel-1 Explorer using the saved settings from the exercise steps above.
Change Detection
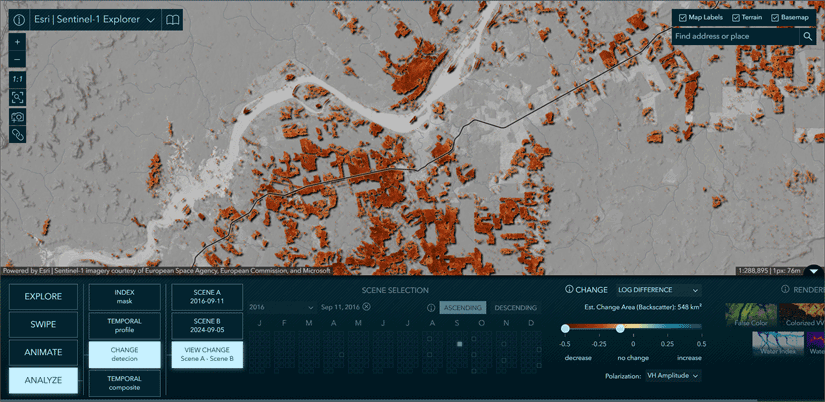
In this mode, you are able to select two scenes and calculate the difference between them. You can view change based on Water and Water Anomaly indices, and can also create a Log Difference image showing all changes in backscatter between the selected images.
In this exercise, you will examine forest and crop change in the Brazilian Amazon, caused by a combination of cattle ranching and agricultural practices.
Step 1 – Click the button below to open Sentinel-1 Explorer in Dynamic view mode to an area near Porto Velho, Brazil.

Step 2 – Click Analyze, then choose Change detection.
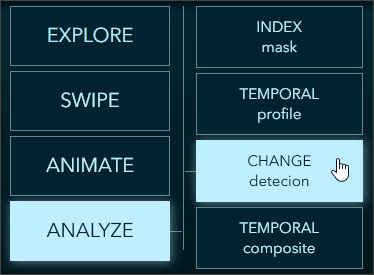
Step 3 – Click choose Scene A.
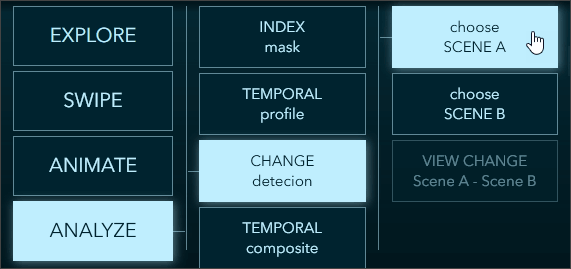
Step 4 – Using the Scene Selection calendar, choose September 11, 2016.

Step 5 – Click choose Scene B and using the Scene Selection calendar, select September 5, 2024.

Step 6 – Click View Change to compare the two scenes.
Step 7 – Use the Change slider to compare the scenes.
a – Choose Log Difference from the drop-down. Log difference shows all changes in backscatter between the two scenes. Other options are Water and Water Anomaly.
b – Choose VH Amplitude from the polarization drop-down. Polarization defaults to VV Amplitude, or vertical-vertical. Vertical-horizontal, or VH Amplitude, provides the best results when examining decreases in backscatter, indicating a change in crops or removal of trees.
c – Adjust the slider to get a crisp rendering of the changes.
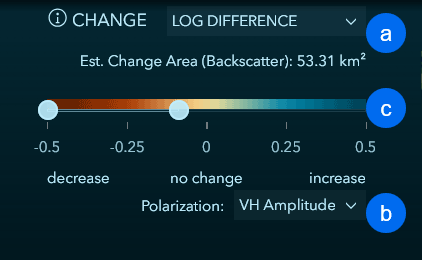
The areas with a decrease in backscatter are highlighted in orange to brown hues. A decrease in backscatter can be caused by a change in planted crops or clearing of trees.
Step 7 – Use the Copy link tool to capture the current settings.
Click the image below to view a larger version to compare to your map, or open Sentinel-1 Explorer using the saved settings from the exercise steps above.
Temporal Composite
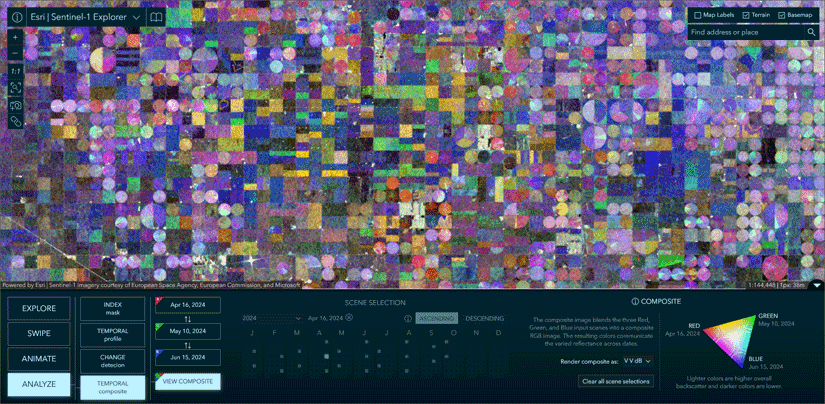
Using the Temporal composite tool, you can view changes over time for up to three selected images at once. Each selected image is used as an individual band in a dynamically generated three band RGB composite image. Color variations in the resulting composite image represent changes in the land cover over time. For example, areas with high backscatter in the scene used as the red band will have a stronger red hue in the composite image. Areas with high backscatter in the red scene and the blue scene, and low backscatter in the green scene, will appear purple, and so on. Areas with more consistent backscatter, meaning little to no change over time, will appear as shades of gray.
In this next exercise, you will create an agricultural application of the temporal composite showing agricultural related changes in Kansas, USA, throughout the 2024 spring growing season. The composite provides indicators of change related to growth patterns, crop types, soil moisture and more.
Step 1 – Click the button below to open Sentinel-1 Explorer in Dynamic view mode to an area of farmland in Kansas.

Step 2 – Click Analyze, then choose Temporal composite.
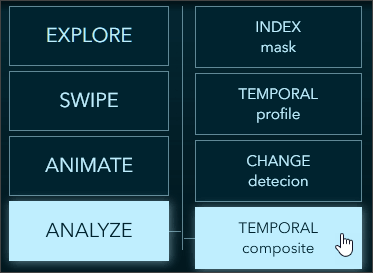
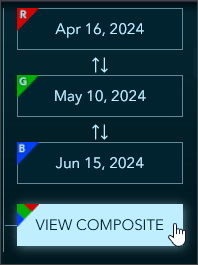
Step 3 – Click Choose red band and select April 16, 2024, from the Scene Selection calendar.

Step 4 – Do the same for the green band and blue band, choosing scenes for May 10, 2024, and June 15, 2024, respectively. When finished, click View Composite.
Color variations in the resulting composite image represent changes over time related to growth patterns, crop types, soil moisture and more. Areas with high backscatter in the scene used as the red band will have a stronger red hue in the composite image. Areas with high backscatter in the red scene and the blue scene, and low backscatter in the green scene, will appear purple. And so on. Areas with more consistent backscatter, meaning little to no change over time, will appear as shades of gray.
Step 6 – Hover over different areas of the color chart in the lower right to get tips for interpreting the composite image.
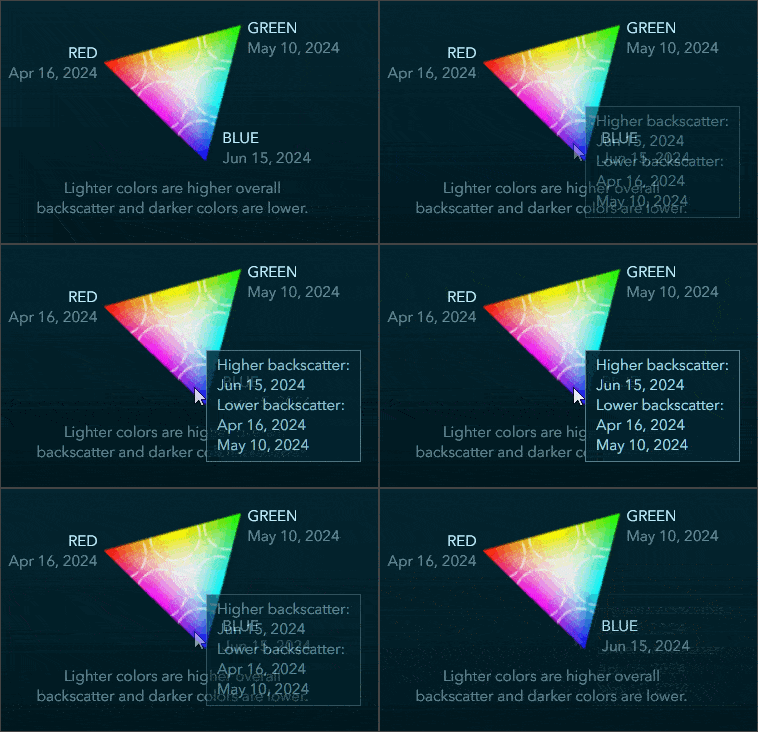
Step 7 – Use the Copy link tool to capture the current settings. Experiment with different scene selections or different areas.
Tip: Click Clear all scene selections to reset current settings.
Click the image below to view a larger version to compare to your map, or open Sentinel-1 Explorer using the saved settings from the exercise steps above.
More information
For more information, see the following:
- Sentinel-1 Explorer: Observing Earth in a different light (Blog)
- Detect and measure wildfires with the Sentinel-1 Explorer (Blog)


Commenting is not enabled for this article.