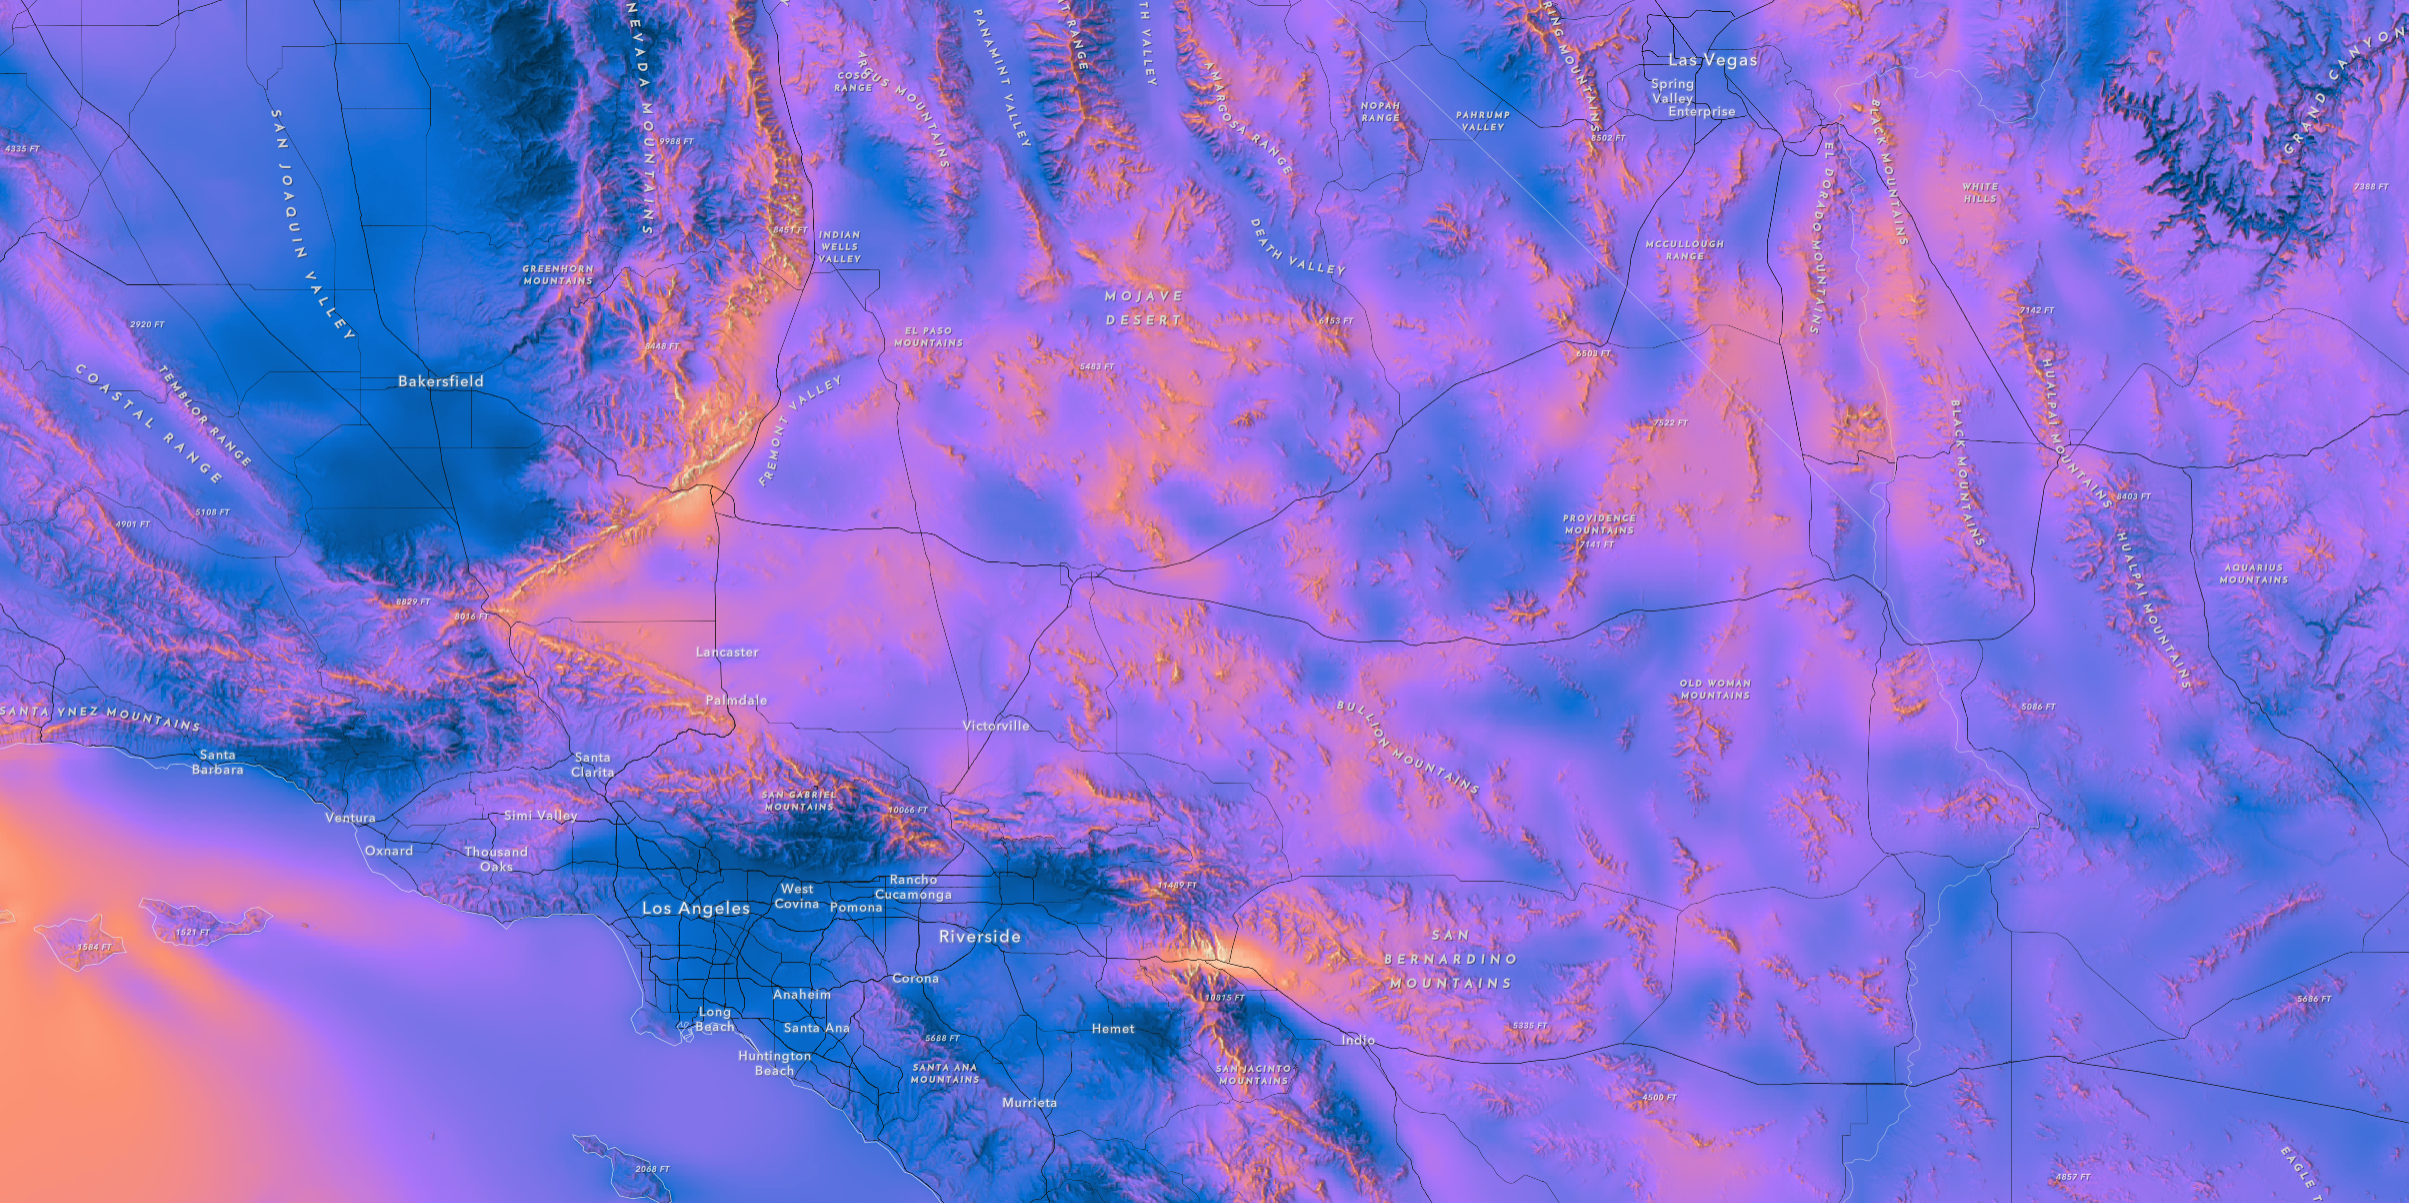
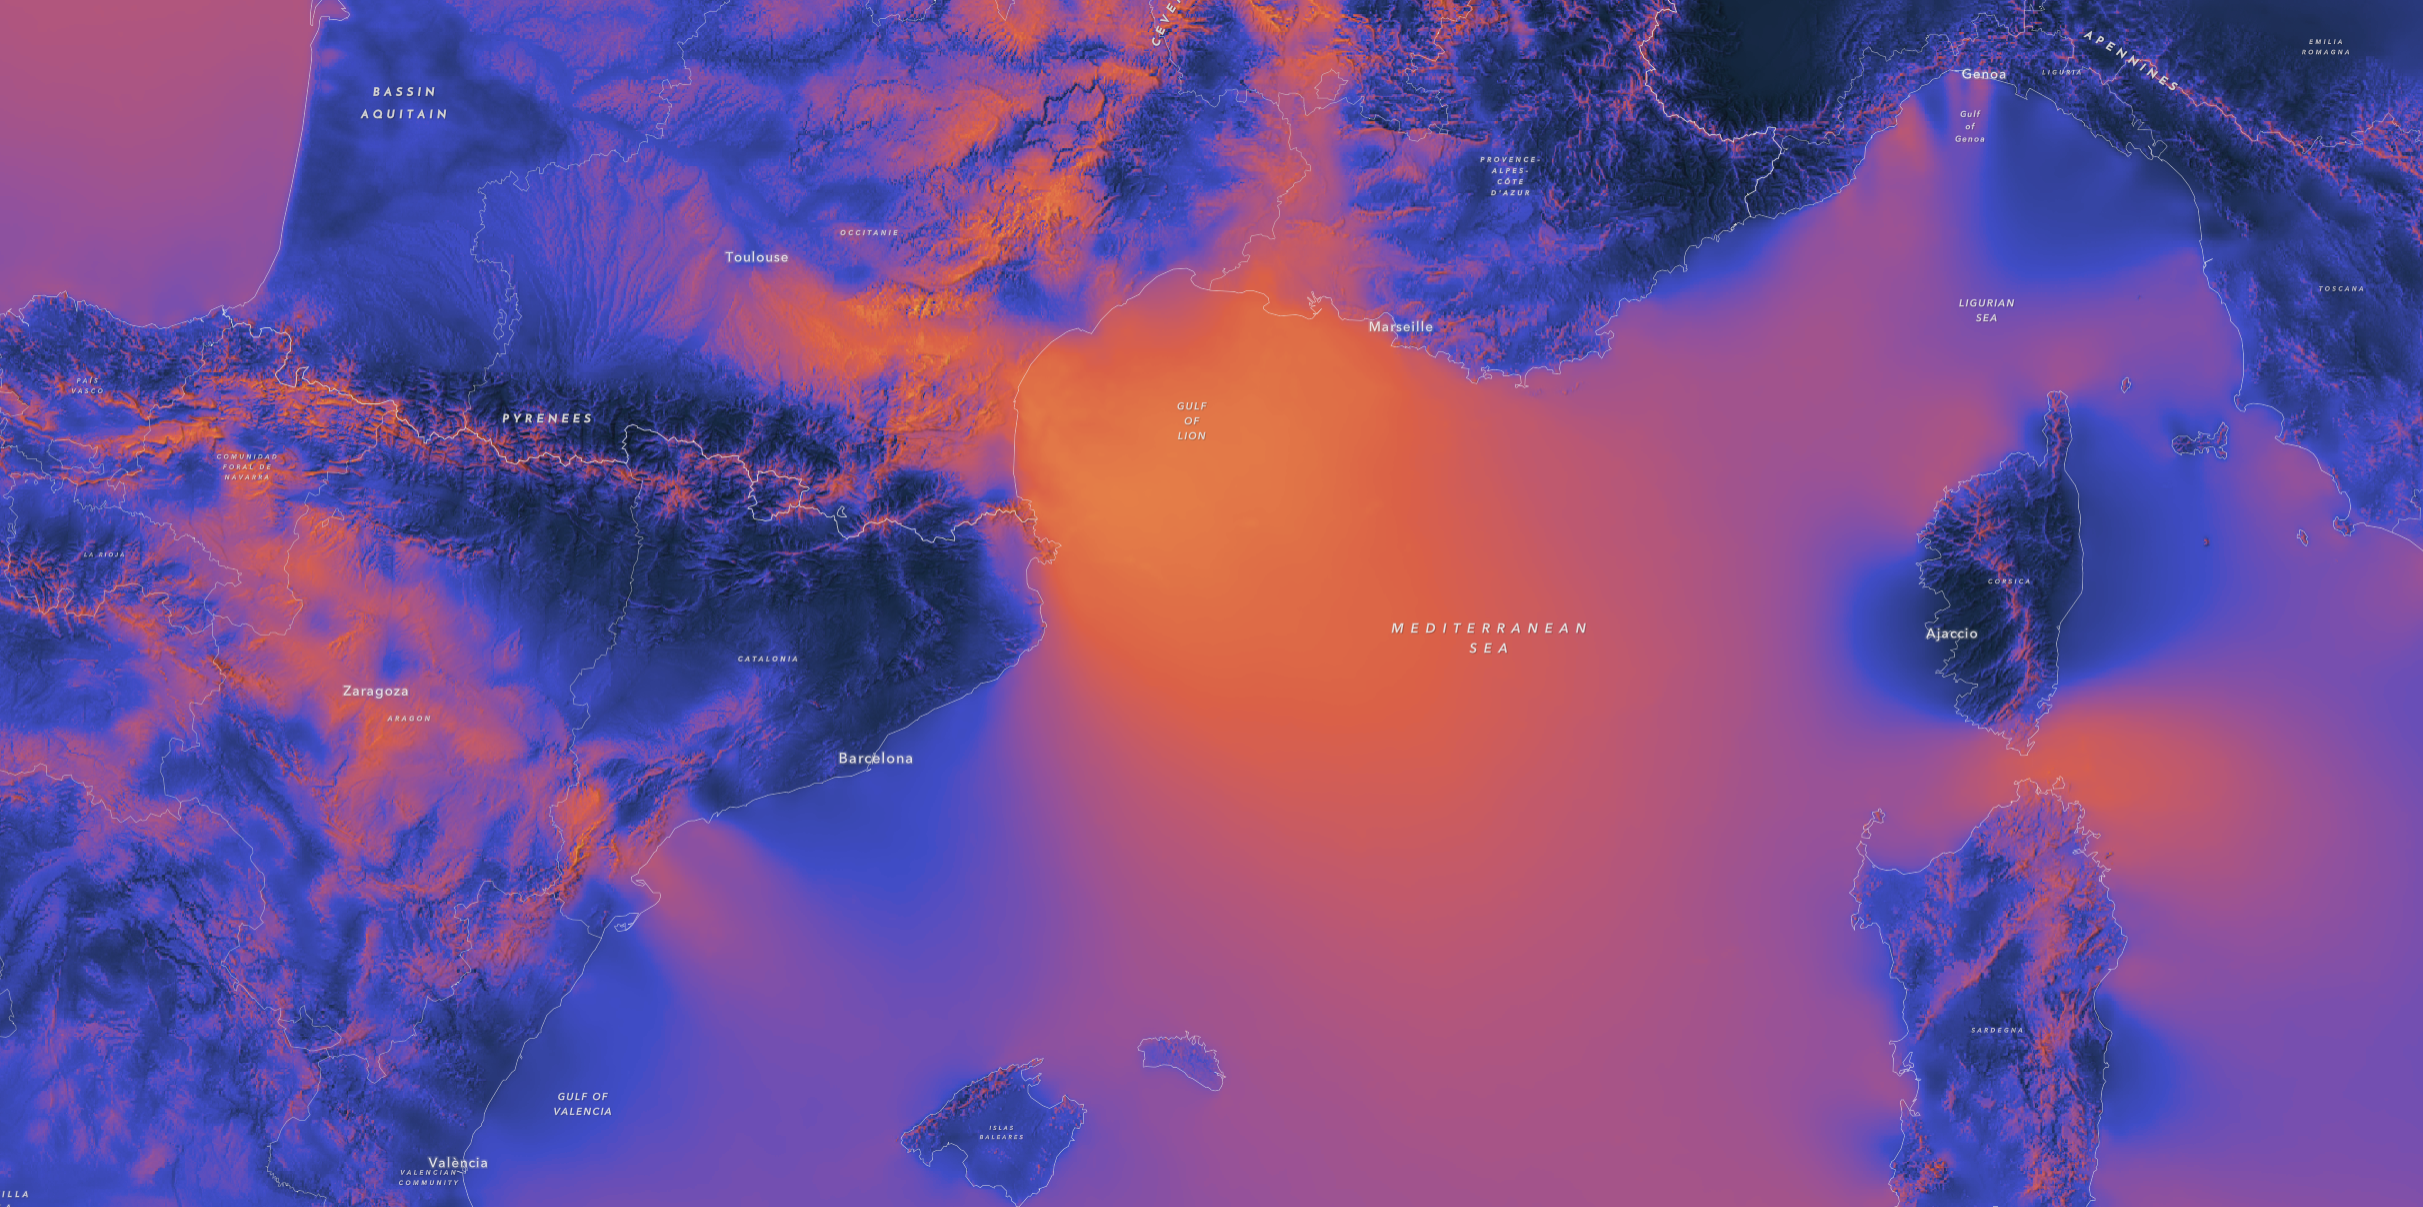
Before 2024 wraps up, Esri is happy to announce the addition of the Global Wind Atlas to ArcGIS Living Atlas. These exciting new multidimensional imagery layers put wind potential on the map – for anyone to use – and are the result of a partnership between the Department of Wind Energy at the Technical University of Denmark (DTU Wind Energy) and the World Bank Group, with the objective of “helping policymakers, planners, and investors identify high-wind areas for wind power generation virtually anywhere in the world.”
These new layers are useful in myriad applications…too many to cover in a short blog, so please visit the Explore the Global Wind Atlas StoryMap:

There you can find out more about the layers and see how we used them to assess wind energy resources for policy and planning, including one example of a wind farm suitability analysis using the Suitability Modeler in ArcGIS Pro.
Here’s a short synopsis of what these three new global layers provide.
Wind Speed: This layer displays mean wind speed measured by meters per second. It has 250 meter resolution as well as information for five height levels of 10, 50, 100, 150, and 200 meters.

Power Density: This measures the total wind resource and takes into consideration the wind speed and elevation, or density of the wind. This layer displays 250 meter resolution power density at five different heights of 10, 50, 100, 150, and 200 meters.

Capacity Factor: The capacity factor layers show three distinct wind turbines, with 100 meter hub height and rotor diameters of 112, 126, and 136 meters. These fall into three International Electrotechnical Commission (IEC) Classes of IEC1, IEC2, and IEC3 and are multidimensional options in the map. Capacity factors can be used to calculate a preliminary estimate of the energy yield of a wind turbine (in the MW range), when placed at a location.

We’re excited to add these new Global Wind Atlas resources to the Living Atlas for the wind energy and GIS community. Additional questions or feedback? Feel free to contact the Environment team, we’d love to hear from you!


Article Discussion: