Fish serves as the major source of protein for over 3 billion people worldwide, requiring a global, industrial fishing effort that spans the farthest reaches of our oceans – while applying unrelenting pressure on global fish stocks, sovereign waters, and sensitive ecosystems. For the first time, we can now illuminate these vessels and put their activity on the map, answering the question, “Do you know where your fish comes from?”
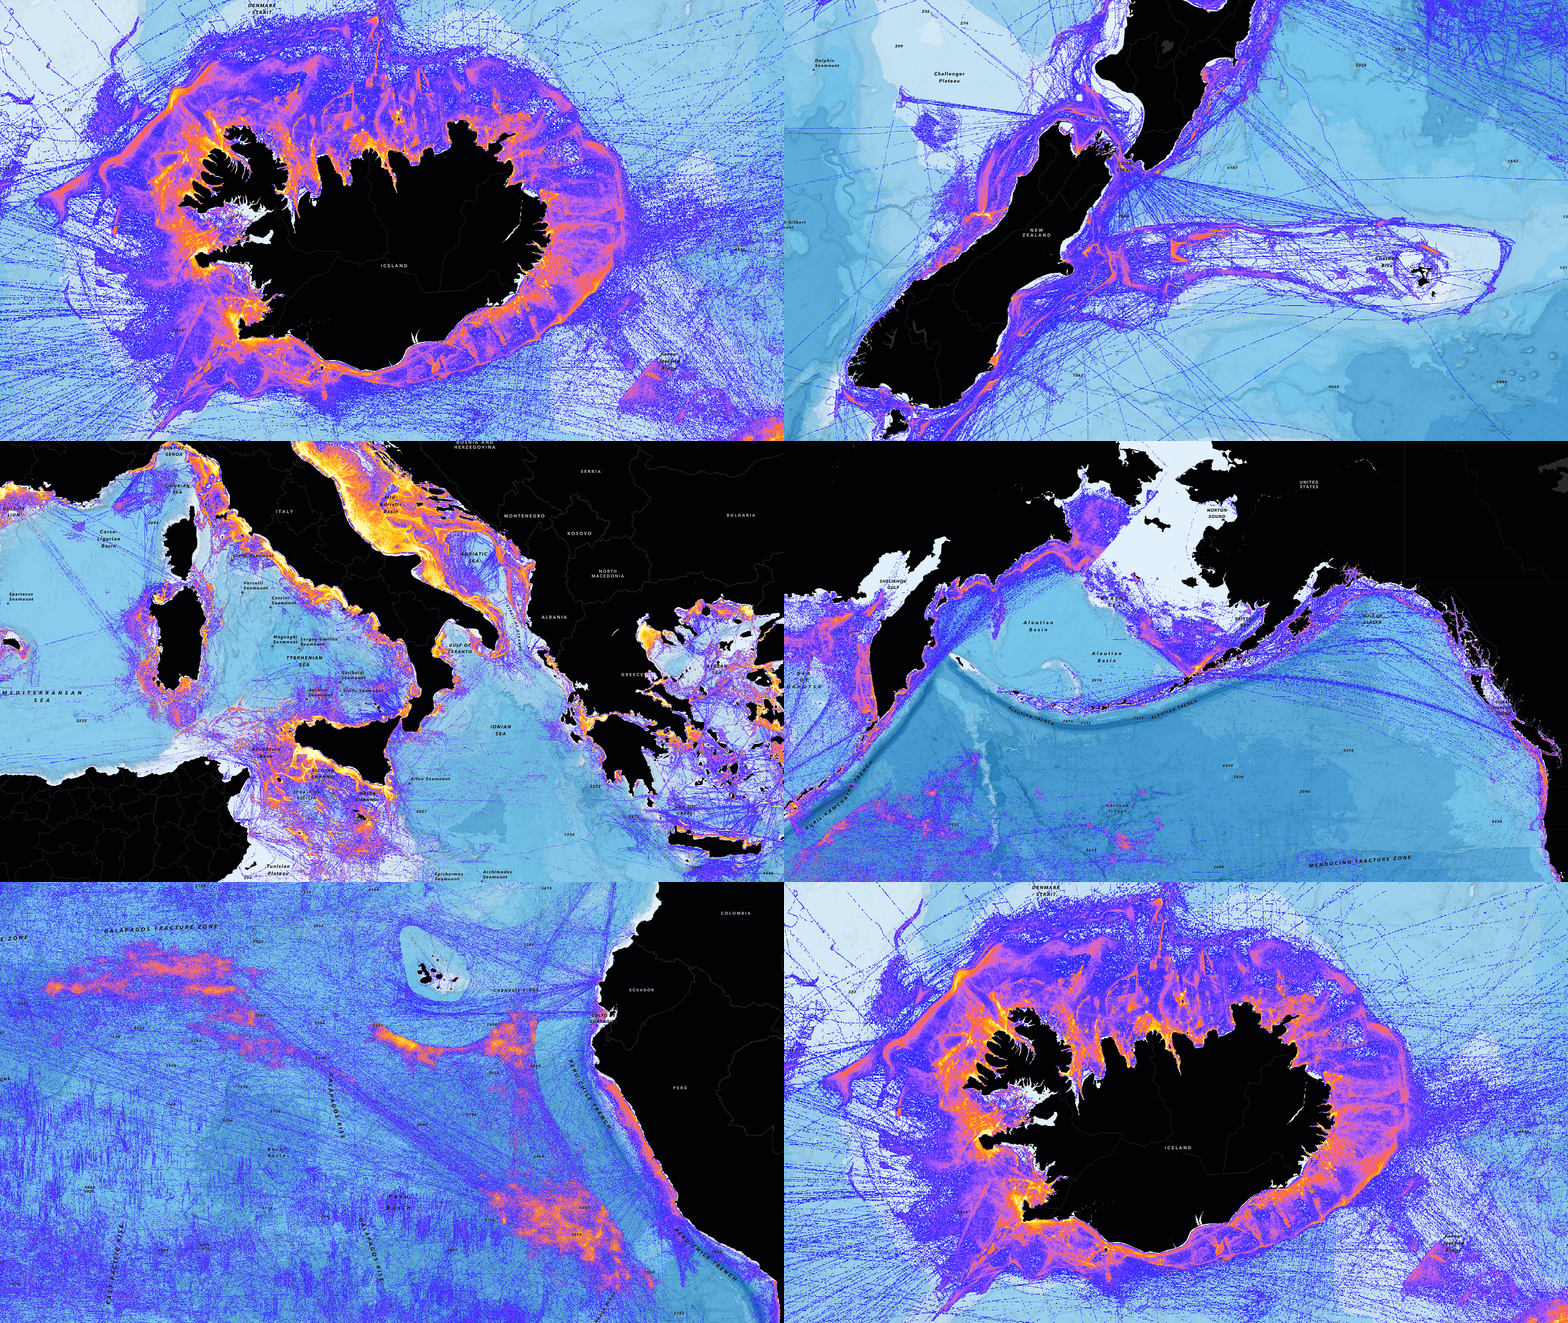
Fishing intensity around the globe
Esri is excited to announce the addition of global fishing intensity layers to ArcGIS Living Atlas of the World. These new 1-kilometer resolution multidimensional datasets are the product of Global Fishing Watch, an independent, international nonprofit organization whose purpose is to provide a global real-time view of fishing – making human activity at sea publicly accessible.
Here’s a short summary of what these new layers include:
Global Fishing Intensity (Year 2020) provides a global summary of vessel activity in the world’s oceans, detected from AIS tracking data, and is represented as total hours per 1km cell for the year 2020. This snapshot includes two multidimensional variables: vessel hours, and fishing hours. Vessel hours include any fishing vessel activity within that cell, including transit to/from port, while fishing hours shows only apparent fishing activity, as detected by Global Fishing Watch.
Use the swipe map below to explore vessel hours (left) and fishing hours (right) variables in southern Africa:
Global Fishing Intensity – Monthly Time Series (Year 2020) provides a more granular look at fishing intensity, with monthly summaries for 2020. Same as the yearly service, both vessel hours and fishing hours variables are available for visualization and analysis in ArcGIS Pro or Online.
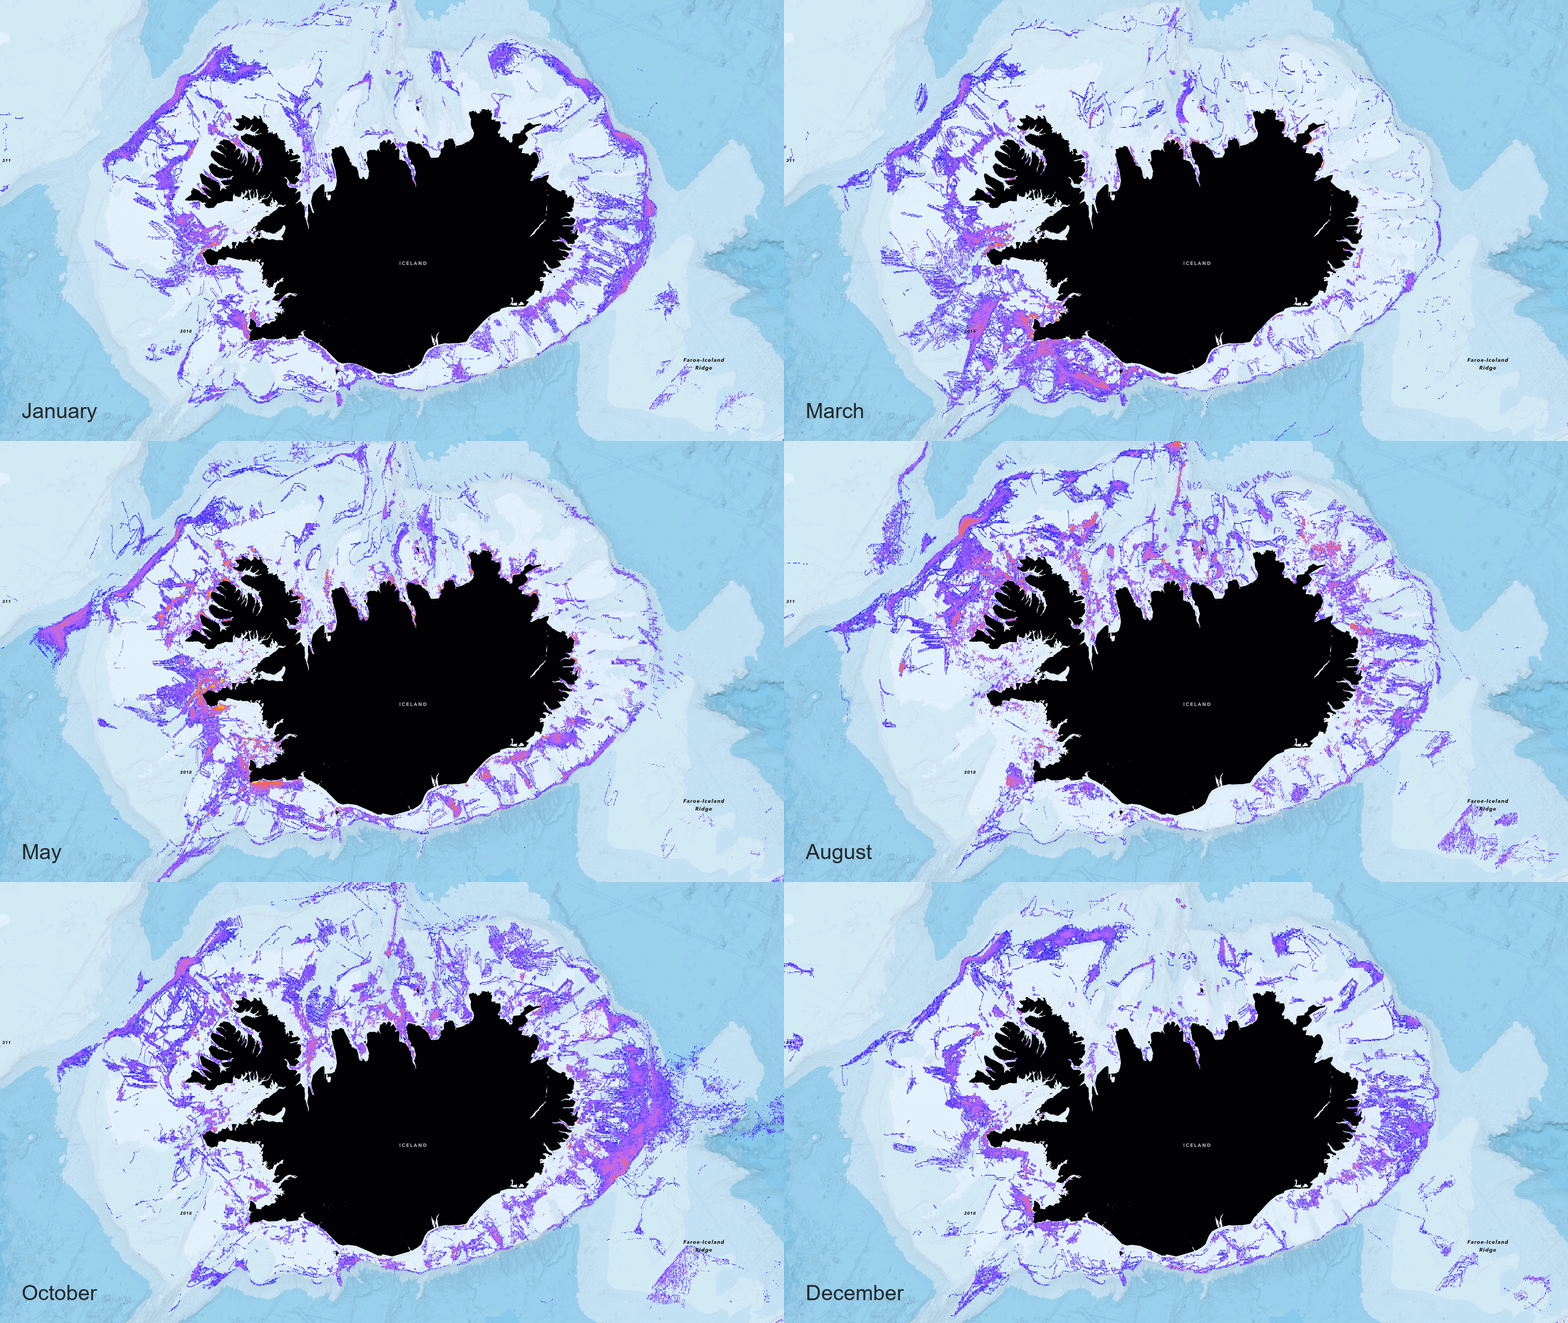
The animation below shows the change in monthly fishing intensity in the shallow waters around the island nation of Iceland, the highest per-capita consumer of fish in the world:
What can you do with these layers?
A lot. Simply exploring global patterns of fishing intensity prompts questions about why certain waters are heavily fished – while others aren’t. Combining fishing intensity with other Living Atlas layers, like bathymetry, marine protected areas, or sovereign boundaries can begin to answer these questions, highlighting sharp changes in fishing activity in time, space, and depth.
For a deeper dive into how the Global Fishing Watch fishing intensity layers were created, and how they can be used for monitoring and protecting the world’s oceans, visit the Global Fishing Watch: Illuminating vessel activity on the open ocean StoryMap.
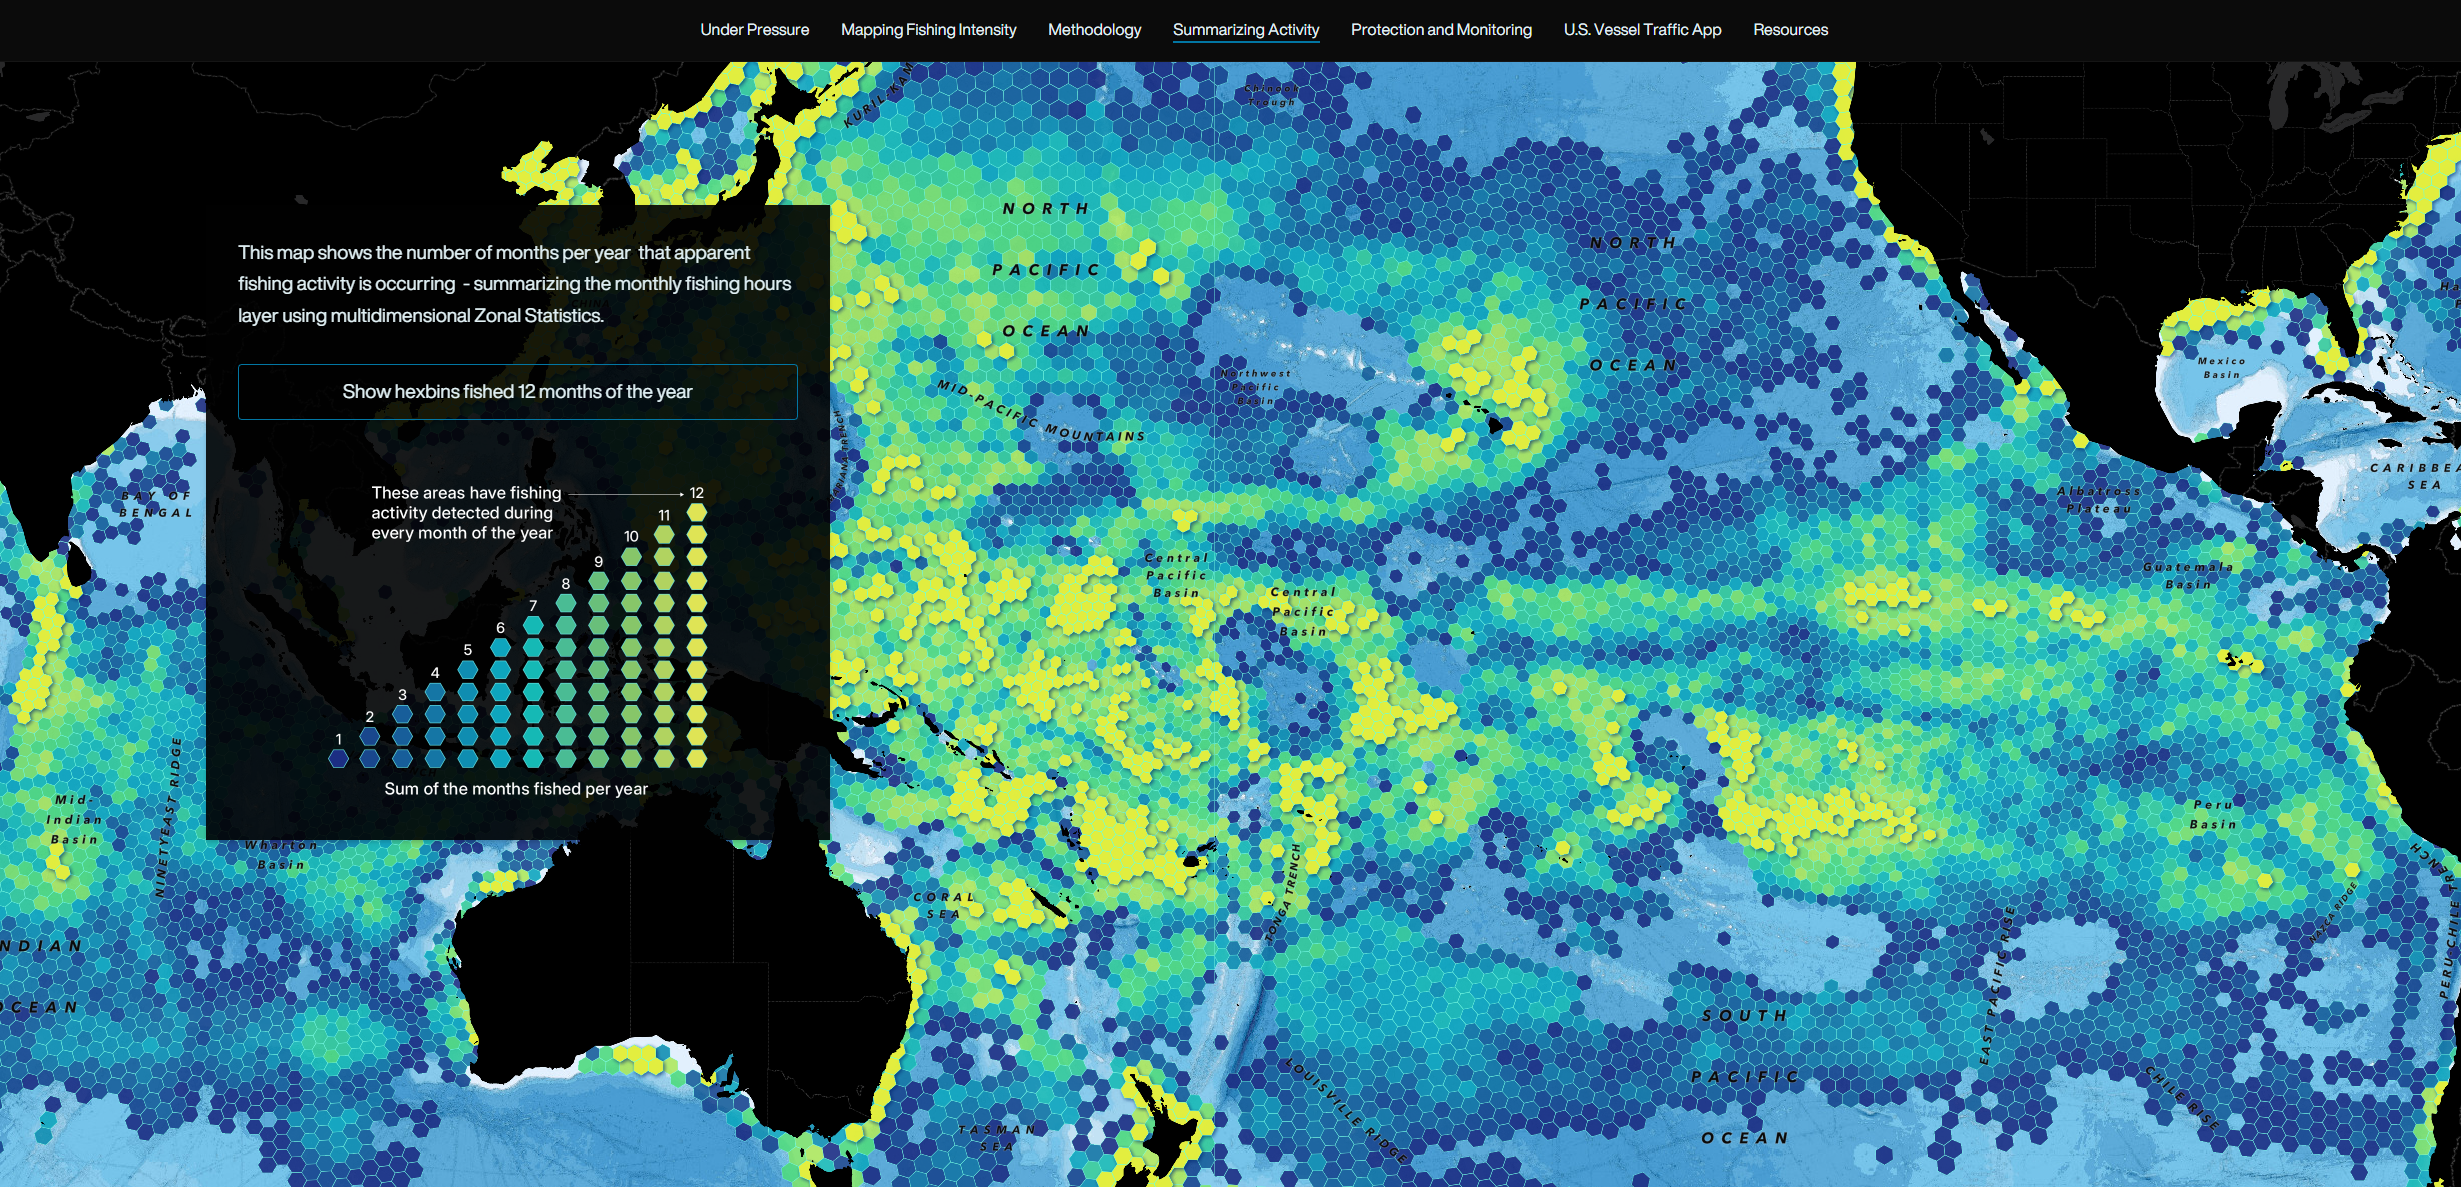
For example, equal-area hexbin summaries can be used in combination with the monthly fishing intensity service to determine regions where there is fishing activity 1, 2, 3, or all 12 months of the year:
Sovereign offshore boundaries – known as Exclusive Economic Zones, or EEZs, in combination with the World Database of Protected Areas and NOAA’s Marine Protected Areas do much of the explaining for why fishing activity is so heavily concentrated in seemingly random “wedges” of open ocean. They can also be helpful for monitoring possible illegal fishing activity in our most sensitive “no-take” marine sanctuaries.
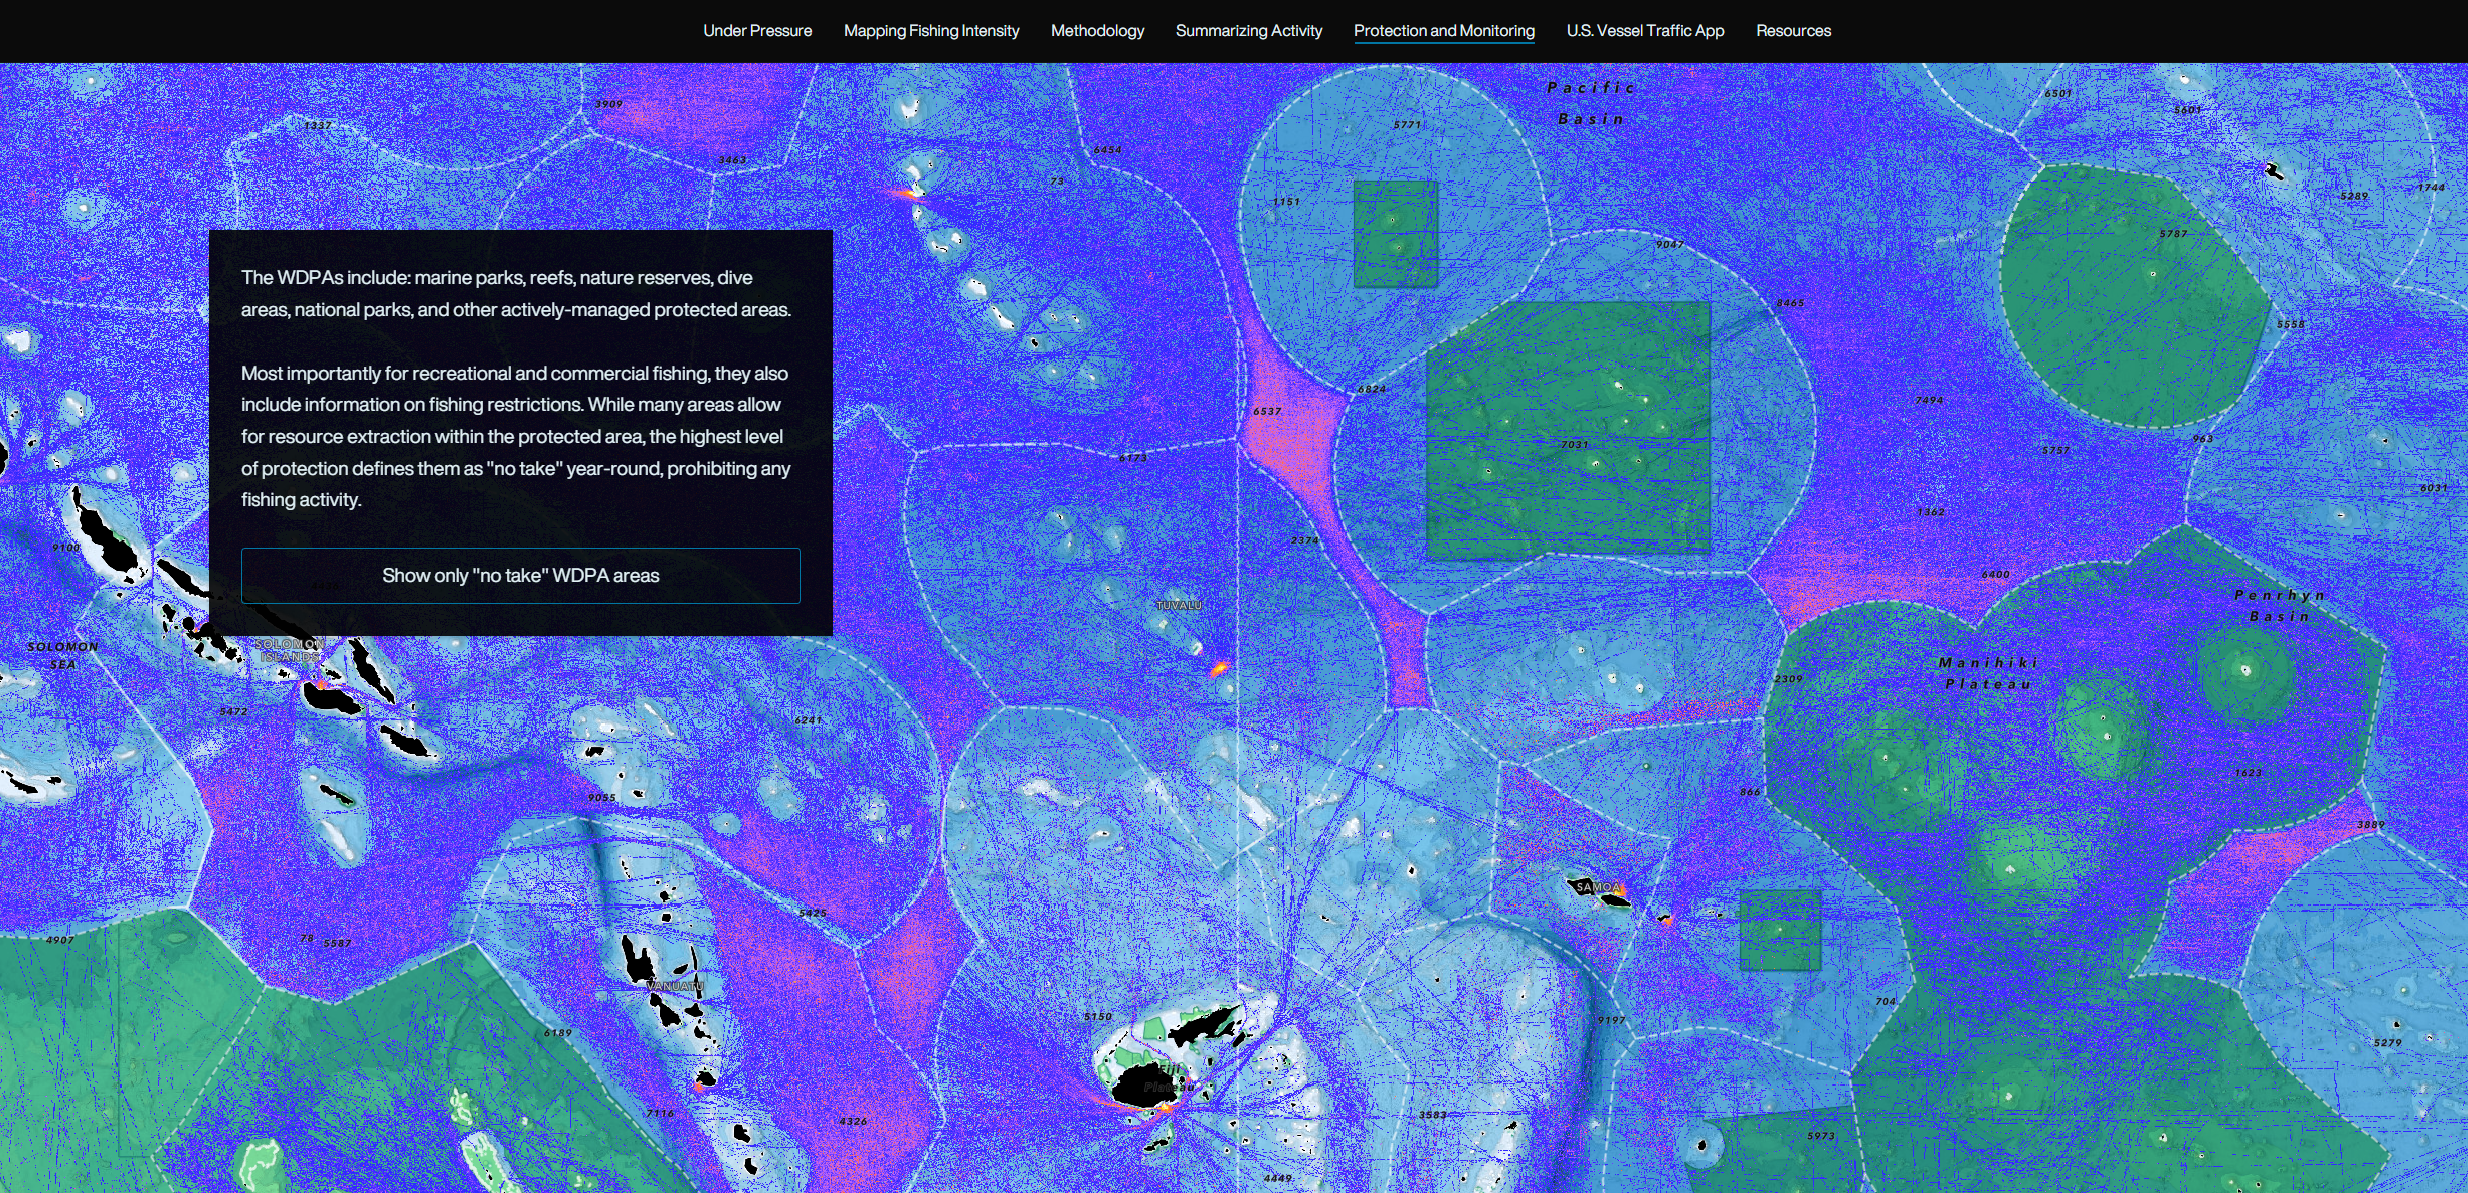
Want to go deeper? Combine Global Fishing Watch layers with AIS vessel track lines from the Living Atlas U.S. Vessel Traffic App to get details about individual fishing vessels, and track their journeys to and from U.S. ports of call. Check out the StoryMap for more!
We’re excited to add these new ocean resources to the Living Atlas for use by the fishing, ocean conservation and GIS communities. Additional questions or feedback? Feel free to contact the Environment team, we’d love to hear from you!


Article Discussion: